April 19, 2010
Band Calculations for Ce Compounds with AuCu3-type Crystal Structure on the basis of Dynamical Mean Field Theory I. - CePd3 and CeRh3 -
Abstract
Band calculations for Ce compounds with the AuCu3-type crystal structure were carried out on the basis of dynamical mean field theory (DMFT). The auxiliary impurity problem was solved by a method named NCAvc (noncrossing approximation including the state as a vertex correction). The calculations take into account the crystal-field splitting, the spin-orbit interaction, and the correct exchange process of the virtual excitation. These are necessary features in the quantitative band theory for Ce compounds and in the calculation of their excitation spectra. The results of applying the calculation to CePd3 and CeRh3 are presented as the first in a series of papers. The experimental results of the photoemission spectrum (PES), the inverse PES, the angle-resolved PES, and the magnetic excitation spectra were reasonably reproduced by the first-principles DMFT band calculation. At low temperatures, the Fermi surface (FS) structure of CePd3 is similar to that of the band obtained by the local density approximation. It gradually changes into a form that is similar to the FS of LaPd3 as the temperature increases, since the band shifts to the high-energy side and the lifetime broadening becomes large.
1 Introduction
Nonempirical band calculations for strongly correlated electron systems have been extensively developed on the basis of dynamical mean field theory (DMFT) [1, 2]. The electrons in Ce compounds are typical strongly correlated electrons [3, 4, 5]. Recently, a DMFT band calculation scheme for Ce compounds was developed in refs. \citenA6 and \citenA7. In the present work, it is applied to Ce compounds with the AuCu3-type crystal structure, which show a wide variety of electronic states from the most itinerant limit to the localized limit.
The state splits into the ground multiplet and the excited multiplet with a separation of about 0.3 eV owing to the spin-orbit interaction (SOI). The multiplet shows crystal-field splitting (CFS) of the order of 100 K. In cubic crystals, the multiplet splits into the () doublet and the () quartet. Hereafter, we call them the and states, respectively. It is important to take account of the SOI and CFS effects in systems [3]. In DMFT, the correlated band electron problem is mapped onto the calculation of the single-particle excitation spectrum of the auxiliary impurity Anderson model in an effective medium. Reliable methods of solving the impurity Anderson model with CFS and the SOI effect are needed in the DMFT band calculation for compounds. A theory named NCAvc (noncrossing approximation including the state as a vertex correction) has been developed [8, 9, 10, 11] and combined with the linear muffin-tin orbital (LMTO) method [12, 13] to carry out the DMFT band calculation [7]. NCAvc can include CFS and the SOI effect, and also the correct exchange process of the virtual excitation. The calculation gives an accurate order of the Kondo temperature ().
The DMFT band calculation will be applied in a series of studies to Ce compounds with the AuCu3-type structure: CePd3, CeRh3, CeIn3, and CeSn3. Each of these materials is classified as a typical example of strongly correlated systems [5, 14, 15, 16, 17, 18, 19].
CePd3 is a typical heavy Fermion system with of about 250 K, and has been studied extensively by various methods [5, 18, 19, 20, 21, 22, 23, 24, 25, 26, 27, 28, 29, 30, 31]. It has a nonmagnetic Fermi liquid (FL) ground state at low temperatures. A controversy existed in the experimental works on inelastic magnetic excitation, but it has recently been resolved by a detailed study of the wave number vector (wave vector) dependence of spectra [19, 21, 22, 23]. The wave-vector-integrated-spectrum of the magnetic excitation has a broad peak at approximately 55 meV. In the single-particle excitation, a broad peak with the character was observed on the inverse photoemission spectrum (IPES) side (i.e., in the energy region above the Fermi energy ()). This seems to be consistent with the high of this compound [24, 25, 26, 27]. However, a strong peak structure has never been observed on the photoemission spectrum (PES) side (i.e., in the energy region below ), contradicting other physical properties [28, 29]. Recent careful study using the - high-resolution resonant photoemission spectrum (RPES) revealed that the bulk component of the PES of this compound shows strong intensity at consistently with high [30]. The angle-resolved PES (ARPES) has also been studied recently [31]. It may be worthwhile whether to confirm these recent results of studies are reproduced or not by the first-principles DMFT band calculation. CeRh3 is known as one of the compounds having the most itinerant 4f states [25, 26, 32, 33, 34, 35, 36].
CeSn3 is also known to show the nonmagnetic FL ground state with a high characteristic temperature [37, 38]. CeIn3 has an antiferromagnetic ground state with a Neel temperature of K. Recently, it was found that decreases to zero under the pressure of 2.5 GPa, in addition, the transition to superconductivity occurs at K [39, 40, 41]. It will be interesting to study the change of the band structure under pressures by the DMFT calculation.
These compounds commonly have the AuCu3-type crystal structure, which is classified into the simple cubic (sc) lattice. The DMFT band structure of these compounds will be reported in two papers. In CePd3 and CeRh3, the hybridization of states with states of the transition metal is very strong. The states almost sink to below in CePd3 whereas they are located near in CeRh3 [42]. In this paper, calculations for these compounds will be reported. Calculations for CeSn3 and CeIn3 will be given in a subsequent paper. Their states hybridize with broad states of ligand ions.
Calculated results of CePd3 and CeRh3 generally show reasonable agreement with experimental results of the PES, IPES, ARPES, and inelastic magnetic excitation by neutrons. However, the calculation gives a higher than that expected from experiments when it is examined in detail. The DMFT band calculation for CePd3 gives a Fermi surface (FS) structure similar to that obtained by the local density approximation (LDA) calculation at very low temperatures. When the temperature increases, bands shift to the high-energy side and their lifetime broadening increases. This leads to the change of the FS structure into one that is similar to the FS of LaPd3. At K, the FS has a different form from both FSs of LaPd3 and the LDA band of CePd3 as an intermediate stage of the change. The lifetime broadening overcomes the fine wave vector dependence of the spectrum at K. In CeRh3, the band is located at about 0.9 eV above , and the dispersion of the DMFT band is almost identical to that of the LDA band in the energy region near . The density of states (DOS) has an appreciable value slightly below in the ARPES. This low-binding energy part shows a weak wave vector dependence, though no flat bands do not exist in the vicinity of the Fermi energy.
In §2, we briefly give the formulation on the basis of the LMTO method. Results of the application to CePd3 are shown in §3, and results for CeRh3 are given in §4. A summary is given in §5. In the appendices, notes on the calculation of the total electron number are given. An efficient method of calculating the Cauchy integral using the spline interpolation scheme is also presented. This integral is frequently used in the DMFT calculation.
2 Formulation
The method of calculation is described briefly because its details have been given in previous papers [6, 7]. We consider the excitation spectrum of the following Hamiltonian:
| (1) |
Here, is the annihilation operator for the atomic localized state at site with the orbital of the -irreducible representation. The quantity is determined using the occupation number of the atomic electron per Ce ion in the LDA calculation. We assume that the local Coulomb interaction acts only on the orbital .
The excitation spectrum is expressed by introducing the self-energy terms [6],
| (2) |
where is the single-electron energy level of the state, and is the energy level in the LDA calculation. The self-energy is calculated by solving the auxiliary impurity problem with the use of NCAvc; its outline is described in the Appendix of ref. \citenA7.
In later calculations we will approximate the localized state by the band center orbital because its localization is good for the state. has the logarithmic derivative on the muffin-tin surface [12, 13].
In the LMTO method, the Hamiltonian is diagonalized using the LMTO bases,
| (3) |
Here, is the expansion coefficient of the th eigenvector on the LMTO base of the Bloch type, , with the wave number vector , the angular momentum (), and the spin () at site in the unit cell, where [13].
The explicit expression of has been given in a previous paper [6]. Note that they are not orthogonal to each other, but the eigenvectors are orthonormal.
The DMFT band structure is calculated in the following way: (A) first the LDA part of the Hamiltonian is diagonalized for a given , (B) then the matrix equation of the Greenian is prepared in the manifold of the eigenvectors . The Greenian equation for the given is written as
| (4) |
where is the unit matrix and is the diagonal matrix of the eigenenergies of with . The matrix elements of are given by calculating the self-energy operator term of eq. (2) based on eq. (3).
The DOS on the atomic state is given by
| (5) |
where the projection operator is defined as
| (6) |
The local DOS in the DMFT band calculation is obtained by summing over in the Brillouin zone: [43]. Here, is the total number of unit cells.
The auxiliary impurity problem is solved by the NCAvc method. The splitting of the self-energy due to the SOI and CFS effects is considered. As shown in ref. \citenA7, this method gives an accurate order of the Kondo temperature when the result is compared with that of the more correct numerical renormalization group (NRG) calculation [7, 44] in a simple model case.
Since the method of the self-consistent calculation in the DMFT has been described previously [6, 7], we exclude the detailed explanation from this paper. First of all, we calculate the self-consistent LDA band by the LMTO method, and potential parameters, except for the levels, are fixed to those in the LDA calculation. (I) We calculate the atomic density of states ( DOS) for the auxiliary impurity Anderson model by the NCAvc method with a trial energy dependence of the hybridization intensity (HI) and levels[45], then calculate the local self-energy. (II) The DMFT band calculation is carried out using the self-energy term, and the local DOS in the DMFT band is calculated. The calculation is iterated so that the DOS of the local auxiliary impurity model and the DMFT band satisfy the self-consistent conditions [46, 47].
The level is adjusted in the DMFT self-consistent iterations under the condition that the occupation number has a given target value, , which is estimated from the LDA band calculation. The temperature dependence of the Fermi energy, , is neglected by fixing it at a value determined at a low temperature. It is estimated using the occupation number of the renormalized band (RNB) calculation, in which the self-energy is approximated by an expansion form up to the linear term in the energy variable at (see Appendix A for the calculation of the total occupation number). The target electron number is imposed on the occupation number calculated directly using the resolvents to stabilize the self-consistency iterations. The occupation number obtained by the integration of the DOS, , has a deviation within 1.0% from because many intermediate calculation process are included.
3 CePd3
3.1 Density of states
@ cccc
0.084 0.719 0.185
(Ry)
-0.19027 -0.19182 -0.16493
3.8 59.0 0.5
6.3 6.7 3.6
(Ry)
0.0153 0.0057 0.1184
(Ry)
2.7 16.0 3.0
meV, meV
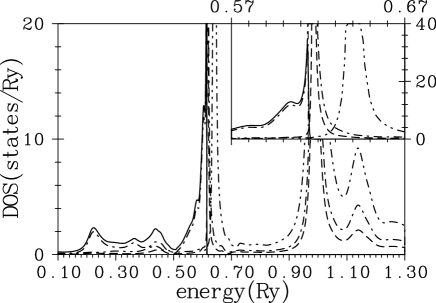
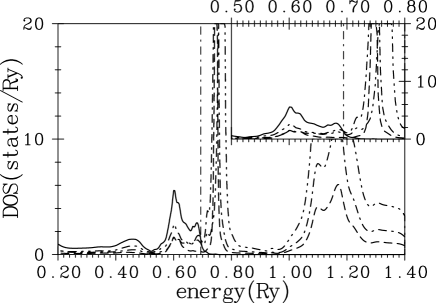
In Fig. 1, we show the DOS of the component ( DOS) for CePd3 at K. The solid line shows the total component of the PES ( PES). The dashed line is the DOS of the component and the dot-dash line is the DOS of the component. The two-dots-dash line is the DOS of the component. The CFS of the self-energy in the excited multiplet is neglected. The vertical dot-dash line indicates the Fermi energy Ry. The inset shows spectra in the energy region near . The DOS has a large peak at 0.642 Ry, about 0.028 Ry (0.38 eV) above . This has mainly the character. The spin-orbit splitting on the IPES side is usually enhanced in Ce systems. The spectral intensity on the PES side consists mostly of the component. The PES has a sharp peak at with a steep tail up to 0.094 Ry (1.3 eV) below . It also has a long tail with small structures reflecting the DOS of states of Pd on the high-binding-energy side. In the steep tail region, shoulders appear at binding energies of 0.004 Ry (0.05 eV) and 0.024 Ry (0.33 eV). These may correspond, respectively, to the CFS and the SOI side band. The sharp peak at with the steep and the long tail has been observed in high-resolution experiments by Kasai et al. [30]. The shoulder due to the SOI seems to be identified.
The Kondo temperature and the CFS excitation energy are, respectively, estimated to be about 27 meV (310 K) and 41 meV (480 K) from magnetic excitation spectra, as will be shown in Fig. 4 in the next subsection. We note that spectra do not show appreciable change even when the temperature is decreased to 18.75 K in the calculation.
The parameters and the calculated values are given in Table 3.1. The LMTO band parameters [13] for states except for the component are fixed to those of the LDA calculation. is fixed to the value determined by the occupied state in the RNB, as is discussed in a later section. The relative occupation number of the component to the , 0.084/0.719 (0.12) is small compared with the 0.5 expected from the ratio of the degeneracy, but is very large compared with the value expected from the simple model of the CFS for an isolated ion with Ry (240 K). The ratio does not change so greatly even when the temperature is raised: 0.089/0.723 (0.12) at 150 K and 0.108/0.707 (0.15) at 300 K. Moreover, the occupation of the component, 0.185, is not small, and is almost independent of . A simple picture of the CFS for an isolated ion cannot be applied.
Usually, the electrostatic potential causes cubic CFS in electron systems with a higher energy level of about 150 K for the state [48, 49]. This is included in the present calculation. Even when it is neglected, the DOS and the magnetic excitation spectrum are not greatly changed because the hybridization effect causes large CFS, of greater than 300 K [50].
The target value of the occupation number on the atomic states, , has been tentatively chosen to be 0.98 in the present calculation. This value is small compared with the occupation number, 1.045, of the LDA band calculation for CePd3. When we carry out the LDA calculation for compounds in which Ce ions are replaced by La ions, the occupation number on the (La) state usually amounts to 0.1 [51]. We use the occupation number as reduced to 94% of the LDA value as the atomic occupation number on the Ce state. Kanai et al. concluded that occupancy in CePd3 is expected to be 0.92 on the basis of the results of resonant inverse photoemission (RIPES) experiments [27, 52, 53]. When we perform the DMFT band calculation by setting to be 0.92, determined from the magnetic excitation spectrum is expected to be 500 K. On the other hand, is greatly reduced to about 10 K when we choose 1.05.
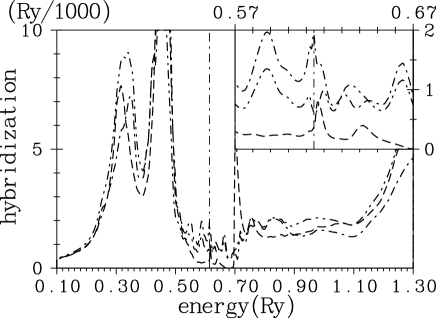
In Fig. 2, we show the trial HI [54] obtained in the DMFT band calculation at 37.5 K. It has very large peaks corresponding to the band of Pd, but these peaks are located in the energy region deep below . The HI is not high in the energy region near . In particular, the HI of the component is low though it is high in the deeper energy region. The overall features of the HI in the DMFT band are similar to those calculated directly using the LDA band, but the HI in DMFT is increased in the vicinity of to about twice the LDA value for the and components, and is decreased in the deep energy region. Moreover, the DMFT calculation causes fine structures of the HI in the vicinity of , which are shown in the inset of the figure. This contrasts with the HI in the LDA, which has a weak energy dependence in this region. The HI of the component in DMFT has a small peak at , while those of the and components have small peaks above or on both sides of . The reason for this different behavior is not clear at present, but we note that the peaks of the DOS for the latter two cases are located above . When we do a calculation in the fictitious case that is mainly occupied by assigning a low energy level to it, the HI of has a small peak at . However, this result should not be used as a general rule, because the modification of HI in DMFT is delicately dependent on details of the band structures. The Kondo temperature is increased in the DMFT calculation in the CePd3 case. We have obtained the Kondo temperature of 10 K in the single impurity calculation using the HI of the LDA band.
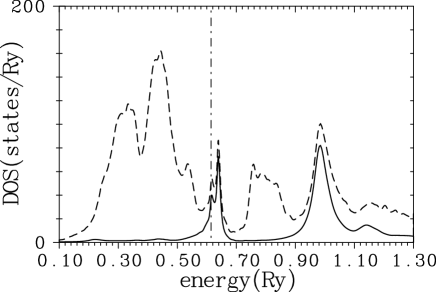
The total DOS at K is shown by the dashed line in Fig. 3. The large peaks at about 0.3 and 0.45 Ry have the character of Pd, and that at 0.8 Ry has the character of Ce. These peaks are also obtained by the LDA calculation [55]. The sharp peaks slightly above , which are called the peak in IPES, are also obtained in the LDA calculation[42]. Their intensity in DMFT is reduced compared with that in the LDA because a part of it is transferred to the intensity of the peak at about 1.0 Ry, which is called the peak. In the present calculation, the width of the peak is not large because the multiplet splitting of the final state is neglected.
In the analysis of RIPES experiments, the ratio of the peak to the total RIPES intensity has been given as 0.22 [27], whereas it is estimated to be about 0.2 in the present calculation. The present DMFT calculation seems to give results that emphasizes the hybridization effects strongly (i. e. the higher ).
3.2 Magnetic excitation
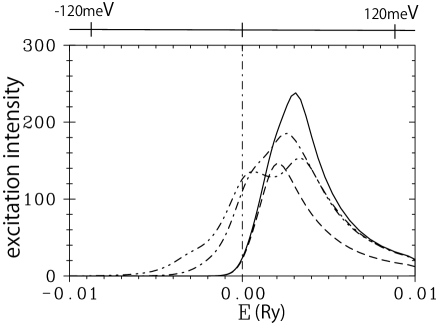
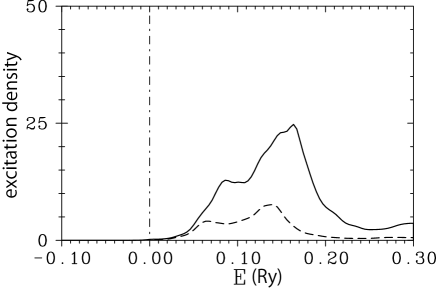
In Fig. 4 we show the magnetic excitation spectrum. The total magnetic excitation spectrum at K is shown by the solid line. It has a peak at about Ry (41 meV). The dashed line depicts the spectrum for a fictitious case in which the matrix elements of the magnetic moment are nonzero only in the manifold of , and thus it may correspond to the excitation spectrum within the manifold. It has a peak at about Ry (27 meV), and leads to a faint shoulder in the solid line. The CFS excitation energy seems to be slightly larger than in the present calculation. The calculated magnetic susceptibility is 1.9 emu/mol, whereas the experimental value is 1.5 emu/mol at K [56, 57]. We show magnetic excitation spectra at K and at K by the dot-dash line and the two-dots-dash line, respectively. The spectrum at K has a broad peak centered at about 0.003 Ry (41 meV). The shoulder shifts to and becomes a peak. the overall features do not change so greatly when we neglect the electrostatic CFS of 150 K. The magnetic excitation spectrum observed in the wave-vector-integrated case has a peak at about 55 meV at K, and the peak shifts to the low-energy side as T increases [21]. The calculated results seem to be generally consistent with those of the experiment. However, the peak at is higher at K in the experiments [21]. The present DMFT calculation seems to give stronger HI compared with the value in the experiments. The detailed calculation of physical quantities using finely tuned parameters will be given in the future.
In ref. \citenA20, excitation peaks with an energy of 15 meV and less than 3 meV are indicated. Low-energy peaks are not expected in the present calculation of the wave-vector-integrated spectra because is not low. One possibility of the origin of the low-energy peaks may be the wave vector dependence of the magnetic excitation spectra, as noted in ref. \citenA21.
3.3 RNB, and wave number-vector-dependent DOS
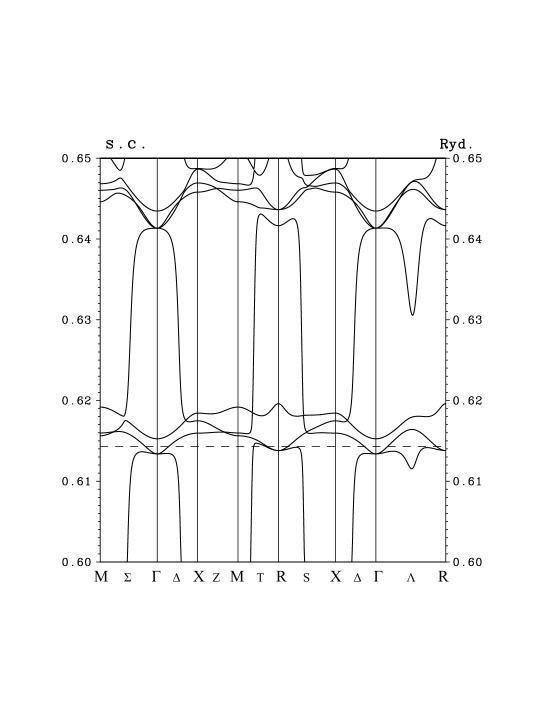

In Fig. 5, we show the RNB dispersion at K. The energy shift (the real part of the self-energy at : )) and the mass renormalization factor (), which are given in Table 3.1, are taken into account in this calculation. Narrow bands with the character appear slightly above , and those with the character of appear around the energy 0.645 Ry which is near the energy of the peak in the DOS shown in Fig. 1.
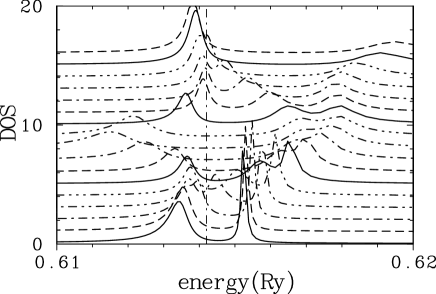
The lowest band sinks to below near the and R points, and is located above in the other regions. The dispersion of RNB corresponds well with the behavior of the -dependent density of states (k-DOS). For example, we show the k-DOS when moves from the (bottom) to the R (top) point along the line in Fig. 6. A peak of the DOS with mainly the character is located below at the and R points. Starting from the peak below at the point, one of ridge lines runs above the Fermi energy across , and then connects to the peak below at the R point. Another runs to the low-energy side of up to 0.611 Ry at the halfway, and then turns back to connect to the peak below at the R point. This “hanging” branch does not cross the Fermi energy.
Note that we have depicted the total spectral intensity, not the -component, in Fig. 6. In the energy region shown in the figure, the spectral intensity has mainly the character. On the other hand, very sharp spectral peaks of a non- character appears in the energy region outside of the figure. The hanging band on the axis has a stronger non- character. This branch is a hybridization band between the of Ce and a conduction band that has the character of the -free electron band and the of Ce.
The dispersion of the RNB is qualitatively similar to the result of the band structure determined by Hasegawa and Yanase by the LDA calculation [58], although the width of the band with is about 0.005 Ry in the RNB, whereas that of the LDA band is about 0.02 Ry. Both calculations give electron pockets at the and R points, and hole pockets centered on the T axis [59].
The Main features of the band dispersion near the Fermi energy are formed by the hybridization of the narrow bands and the wide bands. The bands have dispersion characterized by the LMTO (linear combination of atomic orbitals) tight-binding bands of the lattice. Although the band width is reduced in DMFT, the qualitative features of the dispersion of the - hybridized bands are not changed because the number of participating bands is small and their dispersion is very rapid compared with that of bands.
Here, we must note a weak point of the NCAvc method, that is it does not automatically ensure the Fermi liquid sum rule, i.e., the integral of the total DOS below , , is not equal to the occupation number of electrons calculated by the volume of the occupied states in the space. The quantity is a smaller value in CePd3, and thus we obtain a higher Fermi energy. If we use it in the RNB calculation, the volume of the occupied states in the space becomes large. In the case of CePd3, which has an even total electron number, the balance between the electron and hole states is lost. In this study, we tentatively use the Fermi energy determined using the quantity to ensure the electron-hole balance in the RNB band, where is the energy obtained by the RNB calculation. (For more details, see Appendix B.)
When we calculate the RNB dispersion at K, the band shifts slightly to the high-energy side. The state at the point nears , and the state at the R point is located on . Therefore, a part of the hanging band on the line rises above . Hole pockets on the T axis grow into larger hole regions around the R point. As the temperature increases further, the state at the R point shifts up to above , and a large hole surface enclosing the R point appears. In other words, we have a connected electron Fermi surface (FS) that contains the X and M points inside it.
The primary structure of the FS of the RNB at high temperatures is similar to that of the FS of the LDA band of LaPd3, but their fine topologies will differ. At K, the main part of the hanging band on the line is still located below . The hole sheets around the and R points are separated by an electron region on the axis. On the other hand, this entire hanging branch is located above in LaPd3, and thus the separation by the electron region does not occur.
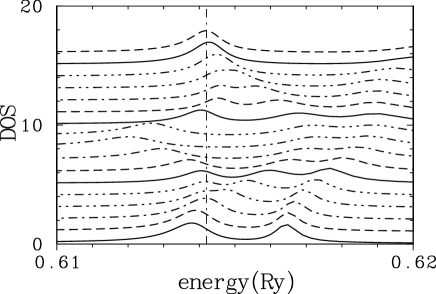
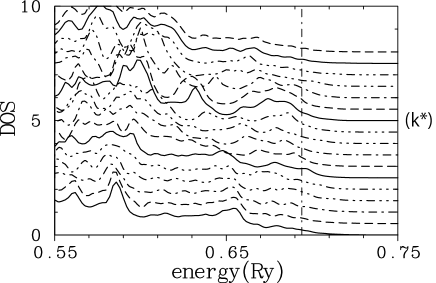
We should, of course, note that the RNB picture has only limited meaning at high temperatures because the imaginary part is large [60]. The k-DOS at K for along the line is shown in Fig. 7. The widths of peaks become large, but we can see that the peak at the R point is located almost at , and the peak at nears . The trace of broad peaks shows a shift corresponding to that of the RNB dispersion. We can recognize that the ridge of the peaks of the hanging band crosses the Fermi energy, as noted in the previous paragraph. At K, the width of peaks becomes so large that it surpasses the fine dependence of the spectra. However, the peak near the Fermi energy still exists in the DOS calculation, similar to that shown in Figs. 1 and 3. It moves slightly to the high-energy side with increasing width at 300 K.
The present calculation has been performed with fixed and . The calculated total occupation number in the DMFT band increases to at K, although the energies of the bands shift upward [61]. We point out that even when we move , the energy of bands relative to the Fermi energy will not change greatly because the Kondo resonance peak usually shifts following the change of the Fermi energy.
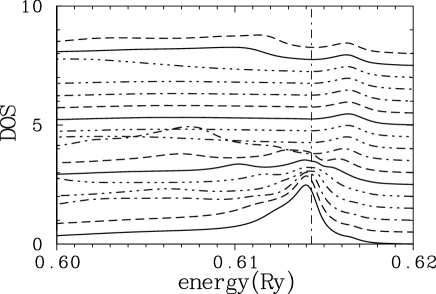
Recently, the wave vector dependence of the PES has been observed under the resonant condition [31]. The experiment was carried out for the (111) surface of a thin film by sweeping the vector along -K̄-M̄-K̄- in the surface Brillouin zone (BZ). This may correspond to the following sweeping of in the 3-dimensional sc BZ: the component parallel to the surface runs as -()-M-()- with averaging over its components normal to the surface. This means that the sweeping of the parallel component R-(S)-X-(S)-R is also included.
In Fig. 8, we show the PES when the representative wave vector moves from the (bottom) point to the M (top) point with average intensities for normal to the surface. The total intensity is plotted in the figure, but the intensity above the energy of 0.612 Ry has mainly the character. The spectra have a peak for near , and this corresponds well to the experimental results. The intensity below the energy of 0.611 Ry has a non character. As noted previously, the contribution from the R point is also included at the representative point. At these points, the component is located below at K. In Fig. 9, we show spectra at K. The peak of the intensity at nears because of the shifting up of the band. The thermal distribution effect and the very high intensity of the DOS above also have affect this spectral shape. The change of the peak can be checked in experiments.
4 CeRh3

@ cccc
0.178 0.319 0.446
(Ry)
-0.26923 -0.26921 -0.24426
(Ry-1)
0.27 1.40 0.99
2.2 1.9 1.9
(Ry)
0.1218 0.1216 0.1646
(Ry)
Ry
In Fig. 10, we show the DOS of CeRh3 at K. The spectrum has a sharp and large peak at an energy about of 0.76 Ry, which is 0.066 Ry (0.9 eV) above the Fermi energy. This separation of energy from is slightly smaller than that of the band in the LDA, about 0.009 Ry (1.2 eV). The result seems to be consistent with those of RIPES experiments and their detailed analysis [26, 32]. The PES has a relatively large peak at about 0.1 Ry (1.4 eV) below and a peak at . The qualitative behavior of the present PES is similar to the result obtained by Harima in the LDA [62]. However, the binding energy of the peak at 0.1 Ry below is slightly lower and the intensity is higher than that of the LDA. The peak at is also slightly sharper. In the experiment, the sharp peak at was observed, but the peak at 0.1 Ry below has not been identified at present [33, 34, 35, 36].
In Fig. 11, we show the total and DOS of CeRh3 at K. The band of Rh exhibits strong peaks of the DOS at about 0.4 and 0.6 Ry. The component also has a small peak at about 0.6 Ry, as noted previously. The Fermi energy is located in the top region of the band, and the hybridization intensity in this region is high. Dispersions of the RNB are almost identical to those of the LDA in the energy region very near , but the width of the band, which is located at 0.76 R, is about 2/3 that of the LDA. A satellite peak appears in DMFT at about 1.2 Ry on the high-energy side. The ratio of the intensity of peak at 0.76 Ry ( peak) to the total IPES intensity is estimated to be about 0.4 in the present calculation, while a slightly larger value, 0.6, was obtained in the experiment. Uozumi et al. predicted the occupation number to be 0.86 [32], but we tentatively used , which is 94% of the LDA value. The difference between these values is not small, but will not cause extreme differences in the calculation of the very strong hybridization limit. The mass enhancement factor is expected to be about 2, as given in Table 4.
In Fig. 12, we show the PES for the (111) surface when the representative wave vector moves from the point (bottom) to the M point (top). In the energy region between and 0.6 Ry, the relative intensity of the component is about 10% of the total. The spectra have fine peaks as if some flat bands exist slightly below . However, we note that no flat bands exist very near in the RNB dispersion. Let us denote as the representative corresponding to the second solid line from the top (i.e., the point on the axis at a distance of about 0.3 length of the axis from the M point). The spectral intensity slightly below is relatively large for near . For the wave vectors near , several bands stay slightly below around the M and X points when the normal components are varied. Calculated results show quantitatively similar behaviors to experimental results, but the careful separation of the surface and bulk components is necessary to enable a detailed comparison [63].
The magnetic excitation spectra are shown in Fig. 13. They have a steep increase at the excitation energy of about 0.03 Ry. This energy may correspond to the energy from to the low-energy edge of the peak at 0.76 Ry of the DOS. The-low energy end of the spectrum mainly originates from the excitation within the components, but contribution of the components is not small even in the low-excitation-energy region. The components also join the Kondo effect. We may expect the Kondo temperature of this system to be about 0.03 Ry (4700 K). The calculated value of the magnetic susceptibility is emu/mol. The experimental magnetic susceptibility ( emu/mol) [57] may indicate a high of several thousand K, but the calculated value of 4700 K seems to be too high. DOSs, both of the total and of the component, do not have any gap, as seen in Fig. 10, but the magnetic excitation spectrum has a shape indicating the existence of a pseudogap. We note that, in Fig. 13, the excitation spectra of only intra- components are shown. A broad continuous component will be superposed on these spectra.
The HI of CeRh3 in the LDA calculation has a spectrum shape similar to that of the partial DOS on the state of Rh, i.e., the spectral shape given by subtracting the and parts of the Ce ion from the total DOS in Fig. 11. The HI in DMFT is almost equal to that of the LDA in the high-energy region, but it has a steep dip at an energy slightly above . Similar behavior has been seen in the HI of the component of CePd3 which has shown in Fig. 2.
5 Summary and Discussion
We have studied the electronic structures of CePd3 and CeRh3 on the basis of the DMFT calculation. The auxiliary impurity problem was solved by a method named NCAvc, which includes the correct exchange process of the and virtual excitation. The splitting of the self-energy owing to the SOI and CFS effects was also considered.
The DMFT band calculation gives Fermi surface structures similar to those obtained by the LDA calculation in CePd3 [58] at very low temperatures. Electron pockets appear at the bottom of the band at the and R points. Hole pockets appear that are centered on the T symmetry axis.
The band shifts to the high-energy side relative to the Fermi energy as the temperature increases. At the same time, the lifetime width of the states increases. The band structures produced by the band overlap between the and non- components shift up to the high energy side of the Fermi energy. Therefore the primary structures of the band in the vicinity of the Fermi energy approaches to those of the free-electron-like band of LaPd3. However, some characteristic features of the LDA band of CePd3 remain at higher temperatures. For example, a region that electrons occupy will appear on the axis in CePd3 at K, which is not expected in LaPd3. In CePd3, the lifetime broadening overcomes the dependence of the spectrum at room temperature, thus, the state becomes a broad dispersionless state located above .
The ARPES of CePd3 shows strong intensity near the representative point at low temperatures because the band is located below the Fermi energy at the and R points. This result seems to be consistent with the recent experimental results [31]. The observed component will be greatly reduced at room temperature because of the shift of the band to the high-energy side.
The k-integrated magnetic excitation spectrum has a peak at 41 meV and a faint shoulder structure at about 27 meV at low temperatures. The temperature dependence of the excitation spectrum generally seems to be consistent with the results of experiments [21]. The magnetic CFS excitation energy is estimated to be about 41 meV, while the Kondo temperature is slightly smaller, 320 K (27 meV).
The calculated PES shows good correspondence with the bulk component obtained in recent high-resolution experiments [30]. The intensity ratio of the peak of the IPES to the total IPES is estimated to be about 0.2, while it was predicted to be 0.22 by the recent experiment analysis [27]. The HI is enhanced near the Fermi energy in the DMFT band compared with that of the LDA calculation. The present DMFT calculation seems to give electronic structures with slightly stronger HI than that expected from experiments for CePd3.
The DMFT calculation for CeRh3 gives an almost identical band structure to that obtained by the LDA calculation. However, the energy of the peak of the IPES in the former is slightly lower than that in the latter. In addition, the satellite peak appears in the DMFT band calculation. The calculated intensity ratio of the peak to the total IPES, 0.4, is comparable to, but smaller than the experimental value of 0.6. [32]. The calculated PES has a sharp peak at the Fermi energy. A peak reflecting the (Rh) DOS also appears, similarly to the result of the LDA calculation. The former has been observed, but the latter has not been identified in experiments [35, 36].
The Fermi energy is located in the energy region of the band of Rh in CeRh3, therefore the HI near the Fermi energy is strong, about three times greater than that of CePd3. The band width of CeRh3 is about twice that of CePd3 in the LDA calculation. In the DMFT calculation, the characteristic energy scales are drastically different from each other, 300 and 5000 K.
In CeRh3, the ARPES shows an appreciable DOS slightly density below the Fermi energy and is weakly dependent on the wave vector, although no flat bands exist near the Fermi energy in the RNB dispersion. The spectra have stronger intensity halfway along the axis from the to M points of the Brillouin zone. This seems to be similar to the results of experiments, but further studies to separate the surface effects are necessary [63].
General features of the experimental results for CePd3 and CeRh3 are reproduced by the DMFT band calculation with the LMTO+NCAvc scheme. However, the present DMFT calculation gives a higher Kondo temperature than that in the results of the detailed analysis of experiments. Moreover, there is some arbitrariness in the choice of the target value of the occupation number, . According to calculations for AuCu3-type Ce compounds, accurate calculated results seem to be obtained when a occupation number between 90% and 95% of the LDA value is used. We have used 94% in the present calculation, and we obtained 310 K (27 meV) for of CePd3 () and K (0.03 Ry) for of CeRh3 () from the magnetic excitation spectrum. When we perform calculations using 90%, the are K for CePd3 () and K for CeRh3 (). These values are not greatly different from the previous values because these compounds belong to a group of materials having high . For materials with lower , drastically depends on the choice of . Careful treatment of the target value is necessary in such cases.
The effectiveness and some of the weaknesses (for example, the correct calculation of the occupied electron number) of the present DMFT scheme are recognized. Calculations of the band state in CeIn3 and CeSn3, and also various Ce compounds will be carried out in the near future.
At the end of this paper, we refer the very early and recent application of methods similar to NCAvc to the DMFT band calculation. Lægsgaard and Svane calculated the band structure of Ce pnictides in 1998 [64]. Recently, Haule et al. studied the transition of Ce metal [65], and Shim et al. studied the electronic band structure of CeIrIn5 [66]. The CFS of the self-energy was not considered in those studies.
Acknowledgments
The author would like to thank H. Shiba for encouragements, and Y. Kuramoto and J. Otsuki for important comments on the resolvent method, H. Harima for valuable comments on the band calculation method, and Y. Shimizu for valuable collaboration in the early stage of developing the LMTO+NCAvc code. This work was partly supported by Grants-in-Aid for Scientific Research C (No. 21540372) from JSPS, and on Innovative Areas “Heavy Electrons”(No. 21102523) and for Specially Promoted Research (No. 18002008) from MEXT.
Appendix A Occupation number
The calculation based on the NCAvc method usually does not satisfy the FL sum rule, i.e., the integral of the total DOS below the Fermi energy, , is not equal to the value , where is the Fermi distribution function at . In the RNB calculation, in which the self-energy term is approximated by , we obtain real eigen energies where is the band suffix. The number of occupied states in the RNB band, , is expected to agree with at if the imaginary part can be neglected near the Fermi energy. However, the imaginary component has a considerable magnitude in NCAvc even at very low temperatures; this is partly because must maintain the condition . For example, , , and are 33.59, 34.16, and 34.01, respectively, at K in CePd3. The difference between these values becomes serious when the detailed structure of the Fermi surface is discussed. In this study, we use to determine the Fermi energy at because this quantity is directly related to the occupation number of electrons calculated from the volume of the occupied states in the space.
Appendix B Cauchy integral of using spline interpolation
The Cauchy integral appears in various places in the DMFT calculation. Therefore, an efficient and accurate numerical calculation of the Cauchy integral is needed. We briefly explain a method of using the spline interpolation for the DOS. Let us assume that numerical data of DOS at energy points () are given. In the cubic spline interpolation [67], the DOS in the interval is expressed as
| (7) |
where . The quantity is the second derivative of the DOS at , and is given by the usual procedure of the spline interpolation.
The integral of the interval is calculated as
| (8) |
The total integral is given by summing the contribution from each interval. Equation (8) is expressed as a combination of powers of quantities and ; therefore it is applicable for when is not much lager than . When approaches the edge of the integration, i.e., or , the singularity of the logarithm term is removed by the counter contribution of the neighboring or region. The round-off error due to the subtraction of logarithm terms of neighboring regions is not serious even when is extremely near the edge point, because the divergence of the logarithm is very weak. The integral (8) is expected to be when . Therefore, mutual cancellation occurs among terms in (8) in this limit. We find that the integral is re-expressed by a compact form in this case
| (9) |
This equation gives a highly accurate estimation of the integral even when terms are truncated up to .
In most cases, it is convenient to use the linear interpolation scheme with a very fine mesh for the DOS,
| (10) |
where . The Cauchy integral is expressed by the following forms
| (11) |
and for ,
| (12) | |||||
References
- [1] K. Held, I. A. Nekrasov, G. Keller, V. Eyert, N. Blümer, A. K. McMahan, R. T. Scalettar, T. Pruschke, V. I. Anisimov, and D. Vollhardt: phys. Status Solidi B 243 (2006) 2599.
- [2] L. V. Pourovskii, B. Amadon, S. Biermann, and A. Georges: Phys. Rev. B 76 (2007) 235101.
- [3] A. C. Hewson: The Kondo Problems to Heavy Fermions (Cambridge University Press, Cambridge, 1993)
- [4] J. W. Allen: J. Phys. Soc. Jpn. 74 (2005) 34.
- [5] J. C. Parlebas and A. Kotani: J. Electron Spectrosc. Relat. Phenom. 136 (2004) 3.
- [6] O. Sakai, Y. Shimizu, and Y. Kaneta: J. Phys. Soc. Jpn. 74 (2005) 2517.
- [7] O. Sakai and Y. Shimizu: J. Phys. Soc. Jpn. 76 (2007) 044707.
- [8] O. Sakai, M. Motizuki, and T. Kasuya: Core-Level Spectroscopy in Condensed Systems Theory, ed. J. Kanamori and A. Kotani (Springer-Verlag, Berlin, 1988) p. 45.
- [9] J. Otsuki and Y. Kuramoto: J. Phys. Soc. Jpn. 74 (2006) 064707.
- [10] J. Kroha and P. Wölfle: J. Phys. Soc. Jpn. 74 (2005) 16.
- [11] For the resolvent method, see, for example, N. E. Bickers: Rev. Mod. Phys. 59 (1987) 845.
- [12] O. K. Andersen: Phys. Rev. B 12 (1975) 3060.
- [13] H. L. Skriver: The LMTO Method (Springer-Verlag, Berlin, 1984).
- [14] D. W. Lynch and J. H. Weaver: in Handbook on Physics and Chemistry of Rare Earths, ed. K. A. Gschneidner, Jr., L. Eyring, and S. H. Hüfner (Elsevier Science, Amsterdam, 1987) Vol. 10, p. 231.
- [15] F. U. Hillebrecht and M. Campagna: in Handbook on Physics and Chemistry of Rare Earths, ed. K. A. Gschneidner, Jr., L. Eyring, and S. H. Hüfner (Elsevier Science, Amsterdam, 1987) Vol. 10, p. 425.
- [16] Y. Ōnuki and A. Hasegawa: in Handbook on Physics and Chemistry of Rare Earths, ed. K. A. Gschneidner, Jr., and L. Eyring (Elsevier Science, Amsterdam, 1995) Vol. 20, p. 1.
- [17] M. R. Norman and D. D. Koelling: in Handbook on Physics and Chemistry of Rare Earths, ed. K. A. Gschneidner, Jr., L. Eyring, G. H. Lander, and G. R. Choppin (Elsevier Science, Amsterdam, 1993) Vol. 17, p. 1.
- [18] M. Loewenhaupt and K. H. Fisher: in Handbook on Physics and Chemistry of Rare Earths, ed. K. A. Gschneidner, Jr., and L. Eyring (Elsevier Science, Amsterdam, 1993) Vol. 16, p. 1.
- [19] E. Holland-Moritz and G. H. Lander: in Handbook on Physics and Chemistry of Rare Earths, ed. K. A. Gschneidner, Jr., L. Eyring, G. H. Lander, and G. R. Choppin (Elsevier Science, Amsterdam, 1994) Vol. 19, p. 1.
- [20] J. M. Lawrence, J. D. Thompson, and Y. Y. Chen: Phys. Rev. Lett. 54 (1985) 2537.
- [21] A. P. Murani, A. Servering, and W. G. Marshall: Phys. Rev. B 53 (1996) 2641.
- [22] S. M. Shapiro, C. Stassis, and G. Aeppli: Phys. Rev. Lett. 62 (1989) 94.
- [23] J. M. Lawrence, V. R. Fanelli, E. A. Goremychkin, R. Osborn, E. D. Bauer, K. J. McClellan, and A. D. Christianson: Physica B 403 (2008) 783.
- [24] M. Grioni, D. Malterre, P. Weibel, B. Dardel, and Y. Baer: Physica B 186-188 (1993) 38.
- [25] M. Grioni, P. Weibel, D. Malterre, Y. Baer, and L. Duò: Phys. Rev. B 55 (1997) 2056.
- [26] K. Kanai, Y. Tezuka, T. Terashima, Y. Muro, M. Ishikawa, T. Uozumi, A. Kotani, G. Schmerber, J. P. Kappler, J. C. Parlebas, and S. Shin: Phys. Rev. B 60 (1999) 5244.
- [27] K. Kanai, T. Terashima, A. Kotani, T. Uozumi, G. Schmerber, J. P. Kappler, J. C. Parlebas, and S. Shin: Phys. Rev. B 63 (2001) 033106.
- [28] R. D. Parks, S. Raaen, M. L. denBoer, and Y.-S. Chang: Phys. Rev. Lett. 52 (1984) 2176.
- [29] S. Ogawa, S. Suga, A. E. Bocquet, F. Iga, M. Kasaya, T. Kasuya, and A. Fujimori: J. Phys. Soc. Jpn. 62 (1993) 3575.
- [30] S. Kasai, S. Imada, A. Yamasaki, A. Sekiyama, F. Iga, M. Kasaya, and S. Suga: J. Electron Spectrosc. Relat. Phenom. 156-158 (2007) 441.
- [31] S. Danzenbächer, Yu. Kucherenko, M. Heber, D. V. Vyalikh, S. L. Molodtsov, V. D. Servedio, and C. Laubschat: Phys. Rev. B 72 (2005) 033104.
- [32] T. Uozumi, K. Kanai, S. Shin, A. Kotani, G. Schmerber, J. P. Kappler, and J. C. Parlebas: Phys. Rev. B 65 (2002) 045105.
- [33] E. Weschke, C. Laubschat, R. Ecker, A. Höhr, M. Domeke, and G. Kaindl: Phys. Rev. Lett. 69 (1992) 1792.
- [34] D. Malterre, M. Grioni, Y. Baer, L. Braicovich, L. Duò, P. Vavassori, and G. L. Olcese: Phys. Rev. Lett. 73 (1994) 2005.
- [35] R.-J. Jung, B.-H. Choi, S.-J. Oh, H.-D. Kim, E.-J. Cho, T. Iwasaki, A. Sekiyama, S. Imada, S. Suga, and J.-G. Park: Phys. Rev. Lett. 91 (2003) 157601.
- [36] Yu. Kucherenko, S. L. Molodtsov, and C. Laubschat: Phys. Rev. Lett. 94 (2005) 039709.
- [37] A. P. Murani: J. Phys C: Solid State Phys. 33 (1983) 6359.
- [38] I. Umehara, Y. Kurosawa, N. Nagai, M. Kikuchi, K. Satoh, and Y. Ōnuki: J. Phys. Soc. Jpn. 59 (1990) 2848.
- [39] N. D. Mathur, F. M. Grosche, S. R. Julian, I. R. Walker, D. M. Freye, R. K. Haselwimmer, and G. G. Lonzarich: Nature 394 (1998) 39.
- [40] F. M. Grosche, I. R. Walker, S. R. Julian, N. D. Mathur, D. M. Freye, M. J. Steiner, and G. G. Lonzarich: J. Phys.: Condens. Matter 13 (2001) 2845.
- [41] R. Settai, H. Shishido, T. Kubo, A. Araki, T. C. Kobayashi, H. Harima, and Y. Ōnuki: J. Magn. Magn. Mater. 310 (2007) 541.
- [42] L. Severin and B. Johansson: Phys. Rev. B 50 (1994) 17886.
- [43] The summation over is carried out on a mesh dividing the axis into 8 parts. Usually this gives a nearly smooth spectrum for components, but gives fictitious fine structures for non- components. The total DOS is calculated by smoothing with the introduction of the imaginary part Ry in the energy variable.
- [44] O. Sakai, Y. Shimizu, and T. Kasuya: J. Phys. Soc, Jpn. 58 (1989) 3666.
- [45] In NCAvc, the atomic energy levels are treated as independent input parameters. The energy level of the state is and the energy level of the state is when levels are measured from . The energy level of the state is assumed to be , where is the average of levels of the multiplet, and is the Coulomb constant.
- [46] The impurity Green function is given using the DOS as the Cauchy integral: . It is also expressed as , where is the impurity level, and and are, respectively, the self-energies due to the Coulomb interaction and the hybridization [6]. The self-energy is calculated as by solving the impurity model with the HI . The self-consistent condition on the DOS in DMFT is . Under the self-consistent condition, the self-energy due to the hybridization is given by .
- [47] We find that the maximum relative difference of the DOS hardly decreases below 0.5, even when we advance the iteration process. The average of the relative differences of the Greenian on the imaginary axis is monitored as the convergence parameter, but this also hardly decreases below . We usually stop the iteration process when this parameter reaches approximately and shows stationary behavior.
- [48] A. Furrer and H-G. Purwins: J. Phys. C 9 (1976) 1491.
- [49] U. Walter and E. Holland-Moritz: Z. Phys. B: Condens. Matter 45 (1981) 107.
- [50] When the CFS of the electrostatic term is not included, a large number of iteration loops are needed to reach a solution for large CFS because the calculation starts with a condition of equal energy levels: .
- [51] When we perform the LDA calculation for a fictitious LaPd3 with the lattice constant of CePd3, the occupation number on the state is estimated to be 0.188, which is larger than that of usual compounds, about 0.1. This large occupation is induced through the strong hybridization between the state and the (Pd) state located in the energy region deep below . Some parts of the occupation in LaPd3 may be ascribed to the tail of the (Pd) extending to the Ce region.
- [52] Kasai et al. predicted the occupation number to be 0.79 from their bulk PES analysis [30]. However, they analyzed the PES using the NCA calculation and obtained a small occupation number because the configuration was neglected. For NCA, see, for example, refs. \citenB1 and \citenA46.
- [53] Y. Kuramoto: Z. Phys. B 53 (1983) 37.
- [54] Under the self-consistent condition, the self-energy due to the hybridization is given by , where is the impurity level, is the impurity Green’s function and is the self-energy due to the Coulomb interaction. The HI shown in Fig. 2 is defined as . This is the quantity corresponding to in the usual impurity problem, where is the hybridization matrix and is the energy of the band state.
- [55] C. Koenig: Z. Phys. B: Condens. Matter 50 (1983) 33.
- [56] R. M. Galera, A. P. Murani, J. Pierre, and K. R. A. Ziebeck: J. Magn. Magn. Mater. 63-64 (1987) 594.
- [57] T. Gambke, B. Elchner, J. Schaafhausen, and H. Schaeffer: Valence Fluctuations in Solids, ed. L. M. Falicov, W. Hanke, and M. B. Maple (North-Holland, Amsterdam, 1981) p. 447.
- [58] A. Hasegawa and A. Yanase: J. Phys. Soc. Jpn. 56 (1987) 3990.
- [59] The electron occupation number calculated using the RNB is 0.84 at K for CePd3. This value is large compared with the value supposed from the impression of Fig. 5 in which only the bottoms of bands are occupied. The occupation number through the hybridization with conduction bands is considerable in the RNB picture of CePd3. The LDA calculation also gives bands where only their bottoms are occupied in the same way as in the RNB calculation, and leads to the occupation number of 1.045.
- [60] The DOS calculated by DMFT is shown in Fig. 1. The spectrum intensity in the deep region from (“the incoherent component” in the terminology of band theory and “the excitation part” in the terminology of the local Kondo problem) has a considerably high intensity. However, this deep energy component is disregarded in RNB, but its intensity is recovered as the full value of the intensity of the “coherent part” in the calculation of the occupied state. Only the band dispersion in the neighborhood of and the count of the occupied states at very low temperatures compared with the Kondo temperature have meaning in the RNB calculation.
- [61] Note that the temperature dependence of is not strong: it is 33.59 at K, and is 33.60 at K.
- [62] H. Harima: private communication. See Fig. 3 of ref. \citenA33.
- [63] W. Schneider, S. L. Molodtsov, M. Richter, Th. Gantz, P. Englemann, and C. Laubschat: Phys. Rev. B 57 (1998) 14930.
- [64] J. Lægsgaad and A. Svane: Phys. Rev. B 58 (1998) 12817.
- [65] K. Haule, V. Oudovenko, S. Y. Savrasov, and G. Kotliar: Phys. Rev. Lett. 94 (2005) 036401.
- [66] J. H. Shim, K. Haule, and G. Kotliar: Science 318 (2007) 1618.
- [67] See for example, A. Ralston, and P. Rabinowitz: A First Course in Numerical Analysis (McGraw-Hill, New York, 1978) 2nd ed.