Forming the first planetary systems: debris around Galactic thick disc stars
Abstract
The thick disc contains stars formed within the first Gyr of Galactic history, and little is known about their planetary systems. The Spitzer MIPS instrument was used to search 11 of the closest of these old low-metal stars for circumstellar debris, as a signpost that bodies at least as large as planetesimals were formed. A total of 22 thick disc stars has now been observed, after including archival data, but dust is not found in any of the systems. The data rule out a high incidence of debris among star systems from early in the Galaxy’s formation. However, some stars of this very old population do host giant planets, at possibly more than the general incidence among low-metal Sun-like stars. As the Solar System contains gas giants but little cometary dust, the thick disc could host analogue systems that formed many Gyr before the Sun.
keywords:
planetary systems – circumstellar matter – infrared: stars1 Introduction
Debris discs are generated by collisions among comets or asteroids, and so are a signpost of planetary systems, indicating that bodies of at least planetesimal size formed. The debris absorbs starlight and re-emits it at longer wavelengths, and observations since 2003 with the Spitzer space telescope have yielded many new debris detections in the mid- to far-infrared. The relation between giant planets and planetesimal belts is still uncertain. Bryden et al. (2009) find that the incidence and brightness of cool outer-system debris is not affected by the presence or absence of gas giants in the system, which is not surprising if the formation and evolution of giant planets at a few AU and comets at tens of AU are decoupled processes. More subtle effects may occur, such as the clearing out of comet belts when giant planets migrate, analagous to the Late Heavy Bombardment (LHB) era in Solar System history. This could result in brief dusty episodes as more planetesimals collide, and subsequent lower dust levels due to the ejection of many comets from the system. However, such LHB events seem to be atypical, as Spitzer has commonly found old star systems that are still very dusty (Booth et al., 2009).
Greaves et al. (2007) argued that the incidence of giant planet and debris systems, and the weak overlap between them, could be explained if the mass of refractory elements at the planet-formation stage controlled the outcome. Young circumstellar discs with a large ‘solid’ mass could quickly form planet cores that go on to accrete gas atmospheres, while less substantial discs only form planetesimals by the time the gas disperses and so evolve into debris systems. This model (see also Wyatt et al. (2007)) addresses the differing metallicity dependences observed – metal-rich discs tend to have a higher solid mass and so a greater probability for building a planet core, while lower solid reservoirs are needed to build comets and so debris has little dependence on metallicity (Trilling et al., 2008; Greaves et al., 2007; Bryden et al., 2006; Beichman et al., 2006).
| HD | [Fe/H] | d | type | observation | |
|---|---|---|---|---|---|
| (pc) | date | (24,70 ) | |||
| new observations | |||||
| 19034 | -0.41 | 35 | G5 | 27/08/07 | 2,20 |
| 22879 | -0.84 | 24 | F9V | 03/03/07 | 2,5 |
| 29587 | -0.61 | 28 | G2V | 29/10/07 | 2,10 |
| 30649 | -0.50 | 30 | G1V-VI | 29/10/07 | 2,15 |
| 65583 | -0.67 | 17 | G8V | 07/11/06 | 2,5 |
| 68017 | -0.42 | 22 | G4V | 07/11/06 | 2,5 |
| 88725 | -0.70 | 36 | G1V | 29/05/07 | 2,10 |
| 111515 | -0.52 | 33 | G8V | 12/07/07 | 2,20 |
| 144579 | -0.70 | 14 | G8V | 13/04/07 | 2,5 |
| 218209 | -0.43 | 30 | G6V | 16/08/06 | 2,20 |
| 221830 | -0.45 | 32 | F9V | 21/08/07 | 2,10 |
| other volume-limited objects | |||||
| 3795 | -0.59 | 29 | K0V | ||
| 63077 | -0.83 | 15 | F9V | ||
| 114729 | -0.25 | 35 | G0V | ||
| 114762 | -0.70 | 41 | F9V | ||
| other thick disc stars | |||||
| 6582 | -0.86 | 8 | G5Vb | ||
| 23439 | -1.03 | 24 | K2V,K3V | ||
| 76932 | -0.86 | 21 | F9V | ||
| 101259 | -0.23 | 65 | G8IV | ||
| 106516 | -0.74 | 23 | F5V | ||
| 157214 | -0.41 | 14 | G0V | ||
Here we investigate the formation of planetary systems by observing some of the oldest Galactic stars with Spitzer. A good test of models is to observe old, metal-poor stars. If these proceeded only as far as planetesimal growth, a high incidence of debris might be seen, but perhaps modified by the longer time available for collisional grinding and dust removal compared to mid-Galactic-age stars like the Sun (Wyatt, 2008) . The sample of stars studied here is identified as nearby members of the thick disc – stars that formed within about the first Galactic Gyr (Chiappini et al., 2001) and have orbits inclined with respect to the Galactic Plane. These systems are about twice as old as the Solar System.
2 Sample selection
The targets (Table 1) were initially derived from Karataş et al. (2005), who identified 22 Galactic thick disc stars near the Sun. The identification uses criteria of low metallicity and rotation speed, with values centred around [Fe/H] = –0.5 and 180 km/s respectively, removing halo stars that have lower for the same metallicity. The sample was then reduced to the 15 stars that lie within 40 pc of the Sun, to make the best use of the sensitivity of the MIPS instrument (Rieke et al., 2008). Four of these stars had been observed in previous Spitzer programs (Beichman et al., 2006; Trilling et al., 2008; Bryden et al., 2009), and the other 11 were observed for our Spitzer program number 30339. Since the survey was proposed, Reddy et al. (2006) identified further thick disc stars, several of which were observed in various Spitzer programs, as was one of the more distant stars of Karataş et al. (2005), HD 101259. The total number of stars discussed here is 22, of which 19 have data at two Spitzer wavelengths.
| HD | F24 | F70 | E24 | R70 | |
|---|---|---|---|---|---|
| (mJy) | (mJy) | (mag) | |||
| 3795 | 137.7 0.7 | 19.5 2.7 | 0.03 | 1.3 | 1.5 |
| 6582 | 350 1 | 0.05 | |||
| 19034 | 19.9 0.5 | 0.1 2.4 | -0.02 | 0.0 | -0.9 |
| 22879 | 59 0.4 | 15.4 5.2 | -0.04 | 2.4 | 1.7 |
| 23439A | 25.3 0.5 | -0.01 | |||
| 23439B | 19.9 0.5 | -0.05 | |||
| 29587 | 38.8 1.2 | 2.2 3.9 | -0.02 | 0.5 | -0.5 |
| 30649 | 48.2 1.2 | 1 3.6 | 0.01 | 0.2 | -1.2 |
| 63077 | 227.8 1.1 | 15.5 4.1 | 0.00 | 0.6 | -2.3 |
| 65583 | 65 0.3 | 12.2 6.5 | -0.01 | 1.7 | 0.8 |
| 68017 | 64.8 0.3 | 6.2 6.1 | -0.02 | 0.9 | -0.2 |
| 76932 | 133.8 0.7 | 14.7 2.1 | 0.03 | 1.0 | -0.0 |
| 88725 | 24.3 0.4 | 2.3 3.2 | -0.03 | 0.9 | -0.1 |
| 101259 | 152.3 0.7 | 23.3 2.2 | 0.06 | 1.4 | 2.6 |
| 106516 | 80.4 0.4 | 6.2 6.2 | -0.04 | 0.7 | -0.4 |
| 111515 | 20.2 0.5 | 0.9 2.3 | -0.02 | 0.4 | -0.6 |
| 114729 | 62.1 0.7 | 7.9 2.2 | -0.02 | 1.2 | 0.5 |
| 114762 | 32.4 0.3 | 0.2 3.1 | -0.05 | 0.1 | -1.1 |
| 144579 | 88.6 0.5 | 13.1 4.9 | -0.02 | 1.3 | 0.7 |
| 157214 | 217.5 1 | 23.9 4.2 | 0.04 | 1.0 | -0.0 |
| 218209 | 33.4 1.4 | 0.8 4.2 | -0.03 | 0.2 | -0.7 |
| 221830 | 53.5 0.4 | 9.6 2.7 | -0.02 | 1.6 | 1.4 |
The (logarithmic) metallicities in this sample are -0.23 to -1.03, considerably lower than the mean of –0.06 with standard deviation of 0.25 for local thin disc stars (Valenti & Fischer, 2005). For nine of the volume-limited objects, Takeda et al. (2007) have calculated the ages based on isochrone fitting, a method that is most accurate for old stars that have evolved off the main sequence. Where the age is well determined (uncertainties of % for HD 3795, 30649, 68017, 114729, 218209 and 221830), these stars are dated at 9.6–11.6 Gyr old. This is in very good agreement with their thick disc membership (Karataş et al., 2005), and independent age estimates are consistent with this conclusion. We checked for chromospheric activity, and although current calibrations of age versus activity (Mamajek & Hillenbrand, 2008, e.g.) are only for roughly solar metallicity, all of our program stars are inferred to have low activity consistent with ages greater than 4 Gyr.
3 Observations and data reduction
The eleven new stars were observed between 2006 August and 2007 October, using MIPS at 24 and 70 m (Table 2). Exposure times were 3 and 10 seconds at these wavelengths respectively, multiplied by the number of repeats given in Table 1. The data reduction and instrument calibration procedures are described in Engelbracht et al. (2007); Gordon et al. (2007). The initial data reduction was by aperture photometry as described in Trilling et al. (2008). Subsequently, these observations plus the archival data for the other stars were re-reduced homogeneously as part of a Spitzer legacy catalogue (Su et al., 2010) and these values are presented.
To identify candidate excesses, photospheric signals were predicted systematically. K-band magnitudes from 2MASS were extrapolated to 24 m based on a set of photospheric solar-type stars. A few stars have K-band magnitudes that would saturate the 2MASS images, and for these heritage photometry was transformed into the 2MASS system. These fluxes, for HD 3795, 6582, 63077, 76932 and 157214, will be discussed in the legacy papers (Su, Rieke & Whitelock, in prep.); the last value is rather uncertain with a rms error of mag. As no 24 m excesses were found, the excess at 70 m was then calculated relative to the 24 m flux. The significance of excess at 70 m includes 5% photometric errors plus the statistical error.
One system, HD23439, is a binary with two resolved components that are treated separately here. Amongst the rest of the systems, HD 221830 has a binary companion at approximately 9 arcsec separation that could add 10-15 % extra photospheric flux at 70um (based on the relative K-band brightnesses), and HD 111515 has a similarly separated companion of a fainter nature, but both of these contaminants are neglected here.
4 Results
4.1 Survey limits
From Table 2, we find no dust excess towards any of the stars. At 24 m, the differences between observed and photospheric fluxes vary between -0.05 and 0.06 magnitudes, so there are no positive outliers. The standard deviation of the excesses is 0.03 magnitudes and the mean is -0.01 magnitudes. At 70 m, there is one candidate excess of , but the most negative value is at , so there are again no notably positive outliers.
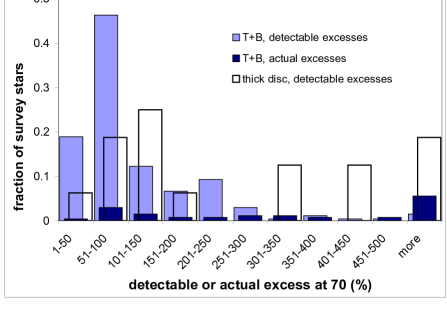
About half the stars were not detected at all at 70 m. This is mainly attributable to larger distances of rare thick disc objects compared to thin disc stars. For example, the median target distance is 28 pc compared to 20 pc in Trilling et al. (2008), while the average 70 m noise level is about 5 mJy in both cases. Three of the stars (HD 29587, 30649, 218209) observed here also had high sky backgrounds that can increase the noise. Figure 1 assesses the sensitivity achieved within the thick disc sample. Survey stars are binned here according to the minimum excess that could be detected with confidence. The fraction of thick disc stars where only excesses above three times the photosphere can be detected (i.e. bins from 301-350 % upwards) is rather large. In the general stellar surveys, the sensitivity attained was generally better than this (light blue bins). However, many excesses above 300 % were seen in those studies (dark blue bins), suggesting that our survet could be adequately deep if the thick disc stars have typical debris . The biases in comparing the incidence of debris for the thin and thick disc stars are discussed further below.
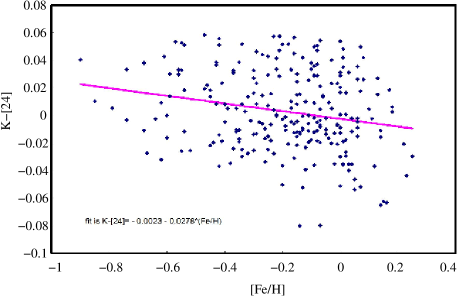
It was noted that some stars have 70 m fluxes well below the photospheric prediction, although with large errors. Since the MIPS calibration is reliable over a wide range of fluxes (Gordon et al., 2007), we considered whether the stars could be under-bright for reasons related to metallicity. However, for a wide sample of stars observed at 24 m, there is a mild trend of enhanced flux at low [Fe/H], contributing about 0.02 magnitudes at our median metallicity of –0.6 (Figure 2). If the 24 m fluxes are normal or slightly high, it would be surprising if metal-poor stars switched to being under-bright somewhat longwards111The stars HD 65583, 68017, 144579 and 157214 have also been observed with Spitzer IRS and have no excesses out to 34 m (Lawler et al., 2009)., at 70 m. Since stars observed with good signal-to-noise tend not to be under-bright, an optimal scaling test was carried out to check the observed to predicted flux ratio. The scale factor is found to be , so we conclude that there is no general 70 m flux deficit and the faint results are by chance. Also, the distribution of significance values (Table 2) is a slightly broadened Gaussian ( =1.15) centred close to zero, indicating the 70 m results are not anomalous.
4.2 Dust excesses
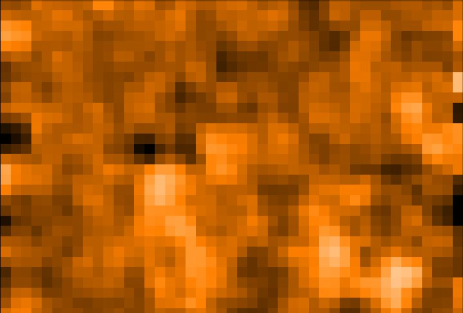
To search more deeply for cool excess among the ensemble, frames for the 11 new 70 m observations were stacked about the stellar positions, taking the resulting mean per-pixel signals. In Figure 3, the mean photosphere is now faintly visible at centre, although background structures from individual frames are also present. Aperture photometry gives a mean flux of mJy, consistent with minimal debris given the mean 70 m photospheric flux of 5.2 mJy.
A better estimate of the net cool dust within the whole thick disc sample can be found from a weighted average of the 70 m excesses (Table 2). We define E70 = R70-1 and weight the values by 1/error2, where the error in E70 can be written as E70/70. The net excess for the 19 stars with 70 m data is , i.e. % above the photosphere at the 1-sigma upper bound. This result is however dominated by five stars with low-noise data. For a stellar effective temperature of around 5600 K and dust peaking in brightness at 70 m, i.e. of temperature around 50 K, an excess of % gives an upper limit on fractional dust luminosity of (Beichman et al., 2006).
Approximately 80 % of nearby Sun-like stars are also dust-free at this level individually (Greaves & Wyatt, 2010). Hence, if the thin and thick disc populations have similar debris incidence and levels, the null result here for only 19 stars is not surprising. In more detail, the expected number of debris detections at 70 m can be estimated from Figure 1, taking into account the limiting depths of the thick disc data. The number of detection per 50%-wide excess bin is then the fraction in the general (T+B) surveys, scaled to 19 stars, and multiplied by the fraction of thick disc targets where such an excess was detectable. This yields a cumulative 2.1 expected detections, with a Poisson error of , so finding no debris systems is within the errors. Similarly, there is a 5 % incidence of 24 m excess for Sun-like stars in general (Koerner et al., 2009), so finding none among 22 stars here is consistent with similar populations. Studying trends by age, Gáspár et al. (2009) found a 24 m debris-incidence of approximately % at 3-10 Gyr. In theoretical models, some slow fading is predicted, with fractional dust luminosity decreasing e.g. by 25 % by 11 Gyr compared to typical mid-age Galactic systems at about 5 Gyr (Löhne et al., 2008).
Statistics are ultimately limited by the small numbers of thick disc stars actually passing through the Solar vicinity at the present time, and in our volume-limited sample we have already searched for debris among the nearest 15, or 70 %, of objects catalogued by Karataş et al. (2005). Fainter levels of debris or cooler dust may be accessible to the Herschel satellite, now observing at wavelengths of 70 to 500 m.
5 Discussion
The debris incidence in the thick disc is either low or normal; we can rule out a particularly high incidence of excess in these metal-poor systems. Recent theoretical work by Johansen et al. (2009) has suggested that low-metal systems could have late planetesimal formation as the gas disc is dispersed, in which case more collisional debris might have been expected around the thick disc stars, but this is not seen here. In contrast, some thick disc stars do host giant planets – an outcome thought to reflect more efficient planetesimal-building at early stages. In our sample HD 114729 has a gas giant (Butler et al., 2003), and four other good planet-candidates exist for thick disc stars (Gonzalez, 2009). The M sini of these planets range from 0.5 to 7 Jupiter masses and the semi-major axes from 0.15 to 2 AU.
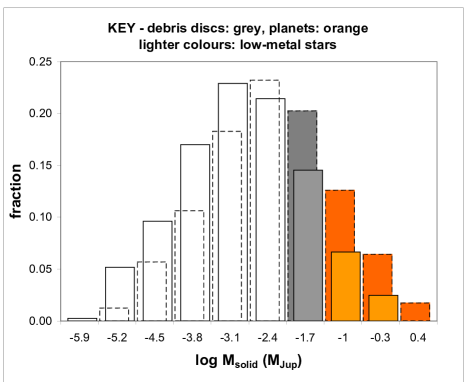
Figure 4 shows the predictions of our model (Greaves et al., 2007) based on the mass of solids available at the planet(esimal) formation stage. The model is based on a threshold of solid material needed for a successful outcome such as building a gas giant core, and with the solid mass within the disc scaling by the metal fraction in common with the star. The distribution is obtained by multiplying the log-normal distribution of overall disc masses (Andrews & Williams, 2005) by the log-normal distribution [Fe/H] for the population of interest, here with mean and standard deviation of -0.6 and 0.2 respectively. The thresholds for forming detectable debris discs and gas giants are around 0.02 and 0.1 Jupiter masses in solids respectively (Greaves et al., 2007). For simplicity we neglect systems with both planets and debris, since the two phenomena appear uncorrelated (Bryden et al., 2009), and so this is a small subset of Sun-like stars.
Figure 4 then predicts that 15 % of thick disc stars should form giant planets, with a further 9 % forming comet belts. Around the general local population of Sun-like stars, the corresponding numbers are 21 % and 20 %. The differences are modest because the availability of solid material is largely dictated by the total disc masses, which have a very broad distribution of dex, compared to the standard deviations around 0.2 dex for the metallicities. Hence, while the peaks of the solid-mass distributions do shift for differing metals (Figure 4), the upper tails associated with forming planet(esimals) are broad and do not have greatly different numbers of stars.
These values are compatible with survey data, taking into account that not all systems of planets and debris have yet been discovered. In the general stellar population, the extrapolated planet total is 17-20 % (Cumming et al., 2009) and the debris disc count at 70 m is around 14-20 % (Trilling et al., 2008; Greaves & Wyatt, 2010), which agree well with the predictions of 21 and 20 % respectively. For the thick disc stars, the debris incidence is % versus the 9 % predicted, and the planet count is estimated at %, versus 15 % predicted. It has been noted that lower-metal discs may disperse faster (Yasui et al., 2009), and this could reduce the efficiency of growing planet(esimals) compared to our simple model.
The thick disc planet frequency is poorly known, with our 6 % estimate derived from three planetary systems among 52 thick disc objects that have [Fe/H] and [/Fe] (Reid et al., 2007; Valenti & Fischer, 2005), while the 11 % is for two out of 18 systems in the Fe,Mg-selected, volume-limited, thick disc sample of Fuhrmann & Bernkopf (2008). These planet frequencies are actually higher than for low-metal stars in general, such as the incidence of 1 % for periods of less than three years found in a recent survey by Sozzetti et al. (2009). Conditions that could promote the formation of more gas giants in the old thick disc population compared to younger low-metal thin disc stars are at present unclear.
6 Conclusions
While the scarcity of nearby thick disc stars makes it difficult to study the population, there are examples of disc and planet systems around some comparably old stars. A gas giant is known around the post main sequence star V391 Peg of age Gyr (Silvotti et al., 2007); the Gyr-old G8 V star Ceti has a debris disc (Greaves et al., 2004); and the oldest known star with both a planet and debris is 70 Vir at Gyr (Bryden et al., 2009). These discoveries point to some of the first stars in the Galaxy having had the potential to form planetary systems akin to those around typical stars seen today. If some thick disc stars have minimal cool debris but do host gas giants orbiting at a few AU, these would be analogues to the Solar System formed many Gyr before the Sun.
Acknowledgments
CKWS thanks STFC for a studentship, and JSG thanks STFC for a fellowship, in support of this work.
References
- Andrews & Williams (2005) Andrews S. M., Williams J. P., 2005, ApJ 631, 1134
- Beichman et al. (2006) Beichman C. A. et al., 2005, ApJ 652, 1674
- Booth et al. (2009) Booth M., Wyatt M.C., Morbidelli A., Moro-Martín A., Levison H.F., 2009, arXiv:0906.3755
- Bryden et al. (2009) Bryden G. et al., 2009, ApJ 705, 1226
- Bryden et al. (2006) Bryden G. et al., 2006, ApJ 636, 1098
- Butler et al. (2003) Butler P., Marcy G., Vogt S., Fischer D., Henry G., Laughlin G, Wright J., 2003, ApJ 582, 455
- Chiappini et al. (2001) Chiappini C., Matteucci F., Romano D., 2001, ApJ 554 1044
- Cumming et al. (2009) Cumming A., Marcy G. W., Butler R. P., 2009, ApJ 526, 890
- Engelbracht et al. (2007) Engelbracht C.W. et al., 2007, PASP 119, 994
- Fuhrmann & Bernkopf (2008) Fuhrmann K., Bernkopf J., 2008, MNRAS 384 1563
- Gáspár et al. (2009) Gáspár A., Rieke G.H., Su K.Y.L., Balog Z., Trilling D., Muzzerole J., Apai D, Kelly B.C., 2009, ApJ 697, 1578
- Gonzalez (2009) Gonzalez G., 2009, MNRAS 399, L103
- Gordon et al. (2007) Gordon K.D. et al., 2007, PASP 119, 1019
- Greaves & Wyatt (2010) Greaves J.S., Wyatt M.C., MNRAS (in press)
- Greaves et al. (2007) Greaves J.S., Fischer D.A., Wyatt M.C., Beichman C.A., Bryden G., 2007, MNRAS 378, L1
- Greaves et al. (2004) Greaves J. S., Wyatt M. C., Holland W. S., Dent W. R. F., 2004, MNRAS 351, L54
- Johansen et al. (2009) Johansen A., Youdin A., Mac Low M.-M., 2009, ApJ 704, L75
- Karataş et al. (2005) Karataş Y., Bilir S., Schuster W.J., 2005, MNRAS 360, 1345
- Koerner et al. (2009) Koerner D.W. et al., 2009, ApJ 710, L26
- Lawler et al. (2009) Lawler S.M. et al., 2009, ApJ 705, 89
- Löhne et al. (2008) Löhne T., Krivov A.V., Rodmann J., 2008, ApJ 673, 1123
- Nordström et al. (2004) Nordström B. et al., 2004, A&A 418, 989
- Mamajek & Hillenbrand (2008) Mamajek E.E., Hillenbrand L.A., 2008, ApJ 687, 1264
- Reddy et al. (2006) Reddy B.E., Lambert D.L., Allende Prieto C., 2006, MNRAS 367, 1329
- Reid et al. (2007) Reid I.N., Turner E.L., Turnbull M.C., Mountain M., Valenti J.A., 2007, ApJ 665, 767
- Rieke et al. (2008) Rieke G.H. et al., 2004, ApJS 154, 25
- Silvotti et al. (2007) Silvotti R., 2007, Nature 449, 189
- Sozzetti et al. (2009) Sozzetti A., Torres G., Latham D.W., Stefanik R.P., Korzennik S.G., Boss A.P., Carney B.W., Laird J.B., 2009, ApJ 697, 544
- Su et al. (2010) Su K.Y.L. et al., 2010, BAAS 42, 349
- Takeda et al. (2007) Takeda G., Ford E.B., Sills A., Rasio F.A., Fischer D.A., Valenti J.A., 2007, ApJS 168, 297
- Trilling et al. (2008) Trilling D.E., Beichman C.A., Bryden G., Rieke G.H., Su K.Y.L., 2008, ApJ 674, 1086
- Valenti & Fischer (2005) Valenti J. A., Fischer D. A., 2005, ApJS 159, 141
- Werner et al. (2004) Werner M.W. et al., 2004, ApJS 154, 1
- Wyatt (2008) Wyatt M.C., 2008, ARAA 46, 339
- Wyatt et al. (2007) Wyatt M.C., Clarke C.J., Greaves J.S., 2007, MNRAS 380, 1737
- Yasui et al. (2009) Yasui C., Kobayashi N., Tokunaga A.T., Saito M., Tokoku C., 2009, ApJ 705, 54