-titleA Universe of dwarf galaxies
Ionized gas and sources of its ionization in the Irr galaxy IC 10
Abstract
IC 10 is the nearest starburst irregular galaxy remarkable for its anomalously high number of WR stars. We report the results of an analysis of the emission spectra of HII-regions ionized by star clusters and WR stars based on observations made with the 6-m telescope of the Special Astrophysical Observatory of the Russian Academy of Sciences using MPFS field spectrograph and SCORPIO focal reducer operating in the slit spectrograph mode. We determine the masses and ages of ionizing star clusters in the violent star-forming region of the galaxy in terms of the new evolutionary models of emission-line spectra of HII-regions developed by RefMM . We estimate the amount of stars needed to ionize the gas in the brightest HII-region HL 111 and report new determinations of oxygen abundance in HII regions.
1 Introduction
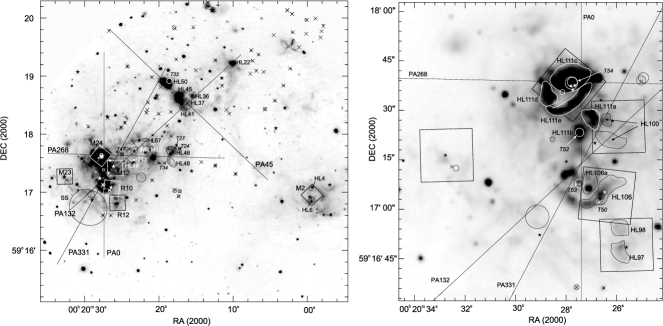
IC10 is the nearest dwarf Irr starburst galaxy; its Hα image appears as a giant complex of multiple shells and supershells with sizes ranging from 50 to 500-800 pc (see Fig. 1). About sixty star clusters have been found in this galaxy (RefHun , RefShar , RefTih ). The stellar population of the galaxy and its anomalously high space density of WR stars (similar to that in massive spiral galaxies) are indicative of a short recent starburst affecting the bulk of the galaxy.
2 Observations
We observed the galaxy with the 6-m telescope of the Special Astrophysical Observatory of the Russian Academy of Sciences using the MPFS field spectrograph and SCORPIO focal reducer operating in the Long Slit Spectrograph mode. Figure 1 shows the locations of MPFS fields (named according to the corresponding central WR star) and those of long-slit spectrograms (named according to their position angle). Below we summarize the main results of these observations, which we reported in detail in our papers (RefArkh , RefLoz ).
3 Results
We analyze the emission spectra of the ionized gas in the HII-regions observed, including the region of violent star formation (see Fig.1). Figure 1 shows clusters from the lists of RefHun , RefTih and RefShar (circles indicate objects from the former two lists and crosses, those from the latter list). HII-regions are labelled by their names according to the RefHL catalog.
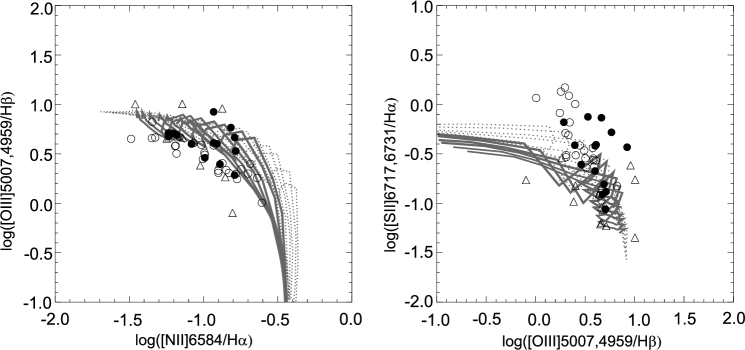
Earlier (RefLoz ) we found that diagnostic diagrams of the relative line intensities from our observations with Long-Slit spectrograph agree poorly with the photoionization models available for the gas metallicity in IC10.
In this work we compare our observations with new evolutionary synthesis models of RefMM and find the diagnostic diagrams for these models to agree well with our observations (see Fig. 2).
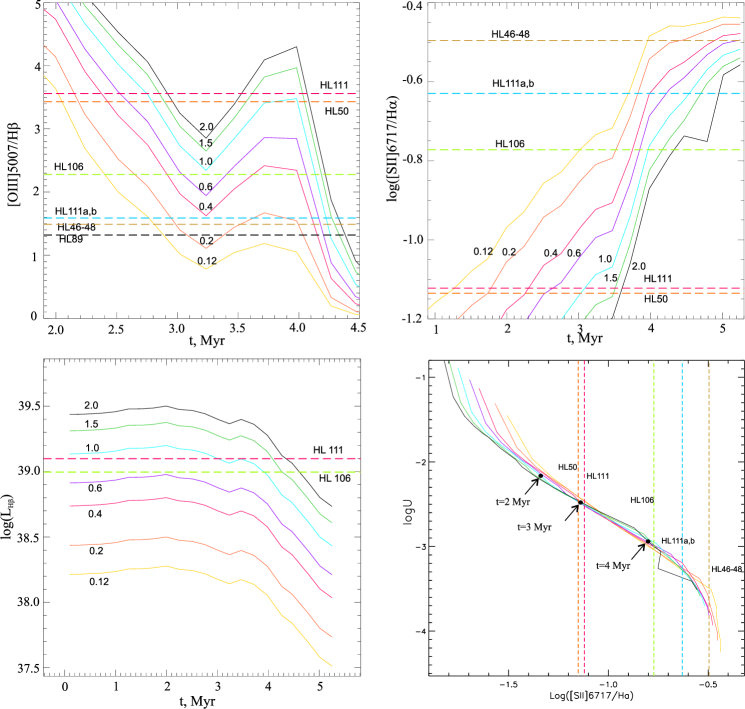
We use the evolutionary models of RefMM to show in Fig. 3 the dependencies of the observed relative line intensities and Hβ-luminosity on cluster age for different cluster masses, and also the dependence of ionization parameter on the line intensity ratio for different ages and masses. We use these dependencies to estimate the parameters of the clusters that are the most likely sources of ionization for the observed HII-regions.
| HII-region | Cluster | , cm-3 | L(H), erg/s | Age, Myr | Mass, | |
| HL111 | T54 | 70 | 1.3 | -2.5 | ||
| HL106 | T50, T53 | 200 | 1.0 | -3.0 | ||
| HL50 | T32 | 30 | - | or | or | -2.47 |
| HL111a,b, | T52 | 200 | - | -3.27 | ||
| HL100 | ||||||
| HL46-48 | T24, T27 | - | - | -3.6 | ||
| HL89 | T47 | 200 | - | - |
| HII-regions | |
|---|---|
| Observations with MPFS | |
| HL111c | |
| HL111d | |
| HL111e | |
| HL100 | |
| HL111a | |
| HL106 | |
| HL106a | |
| HL97 | |
| HL98 | |
| HL4 | |
| HL6 | |
| Observations with long-slit Spectrograph | |
| HL111a | |
| HL111b | |
| HL111c | |
| HL111d | |
| HL111e | |
| HL106 | |
| SS | |
| HL37 | |
| HL45 | |
| HL50 | |
| HL100 | |
| HL89 | |
| WR M10 | |
| HL67 | |
| HL41 | |
| HL36 | |
| HL22 | |
| HL46-48 | |
Table 1 gives the masses, ages, and ionization parameters of the clusters (named according to RefTih ) that are most probable sources of ionization for the corresponding HII-regions. The ages of ionizing clusters in IC 10 are shown to range from 2.5 to 5 Myr, and their masses, from to .
We estimate the amount of O5V stars needed to ionize the gas in the HL111 nebula based on the measured -luminosity and the photon UV-luminosity of O5V star photons/s for the metallicity of from RefSmith . We find that about a hundred of O5V stars are needed to ionize HL111 - the brightest HII-region in IC10.
We use the empirical method of RefPetPag to determine the oxygen abundance in the HII regions observed. The results are presented in Table 2.
4 Acknowledgments
This work was supported by the Russian Foundation of Basic Research (project code 10-02-00091). O. V. Egorov and A. V. Moiseev acknowledge the support from the Dynasty Foundation. The work was based on observations with the 6-m telescope of the Special Astrophysical Observatory, which is operated under the financial support from the Ministry of Education and Science of the Russian Federation (registration number 01-43).
References
- (1) Arkhipova V. P., Egorov O. V., Lozinskaya T. A., Moiseev A. V., Astron. Lett. 36, (2010), in press
- (2) Hodge P., Lee M. G., PASP 102, (1990) 26
- (3) Hunter D. A., Astrophys. J. 559, (2001) 225
- (4) Lozinskaya T. A. et al., Astron. Lett. 35, (2009) 811
- (5) Magrini L. and Goncalves D. R., MNRAS 298, (2009) 280
- (6) Martin-Manjon M. L. et al., MNRAS 403, (2010) 2012-2032
- (7) Massey P. and Holmes S., Astrophys. J. Lett.580, (2002) L35
- (8) Pettini M. and Pagel B. E. J., MNRAS 348, (2004) L59
- (9) Royer P. et al., Astron. Astrophys. Lett. 366, (2001) L1
- (10) Sharina M. E. et al., MNRAS 405, (2010) 839-856
- (11) Smith L. J. et al., MNRAS 337, (2009) 1309-1328
- (12) Tikhonov N. A. and Galazutdinova O. A., Astro-Ph 1002.2046, (2010)