Magnetic excitations in the low-temperature ferroelectric phase of multiferroic YMn2O5 using inelastic neutron scattering
Abstract
We studied magnetic excitations in a low-temperature ferroelectric phase of the multiferroic YMn2O5 using inelastic neutron scattering (INS). We identify low-energy magnon modes and establish a correspondence between the magnon peaks observed by INS and electromagnon peaks observed in optical absorption SushkovPRL2007 . Furthermore, we explain the microscopic mechanism, which results in the lowest-energy electromagnon peak, by comparing the inelastic neutron spectral weight with the polarization in the commensurate ferroelectric phase.
pacs:
78.70.Nx, 75.30.Ds, 75.85.+t, 78.20.-eThe coupling of spins with electric polarization in multiferroics gives rise to a wide variety of magnetoelectric effects actively studied over the past ten years TKimura03 ; Hur04 ; Spaldin05 ; CheongNatMat2007 ; KhomskiiPhysics2009 . In many multiferroics, electric polarization is induced by magnetic structures formed when conventional magnetic orders are frustrated by lattice geometry and competition between spin interactions. Magnetic frustration can yield unusual excitations, such as spinons, monopoles and localized non-dispersive modes Morris2009 ; Fennell2009 ; Balents2010 ; LeeNature2002 . These magnetic excitations can couple to an electric field, which results in the electromagnon peaks in optical absorption PimenovNaturePhys2006 ; SushkovPRL2007 .
Many spectacular magnetoelectric phenomena have been found in manganese oxides, such as mixing of magnons with acoustic phonons, clamping between ferroelectric and magnetic domain walls, and unusual magnetoelectric vortices in hexagonal YMnO3 PetitPRL2007 ; FiebigNature2002 ; ChoiNatMat2010 . In orthorhombic AMnO3 compounds with A=Tb, Dy, (Eu, Y), an incommensurate spiral spin order induces electric polarization through the relativistic ‘inverse Dzyaloshinskii-Moriya mechanism’ KenzelmannPRL2005 ; KatsuraPRL2005 ; SergienkoPRB2006 ; MostovoyPRL2006 . These compounds show magnetically-induced polarization flops, giant magnetocapacitance and electromagnon peaks in optical absorption TKimura03 ; GotoPRL2004 ; PimenovNaturePhys2006 ; Aguilar09 . Smaller cations on A-sites, e.g., Ho, favor a commensurate collinear magnetic order whose polarization, induced by the non-relativistic Heisenberg magnetoelectric coupling, is an order of magnitude larger than that of the spiral state SergienkoPRL2006 .
A similar competition between collinear and non-collinear ferroelectric states is found in orthorhombic AMn2O5 compounds. In this family, electric polarization is also larger in collinear states, while electromagnons and giant magnetocapacitance are observed in non-collinear ones Hur04 ; HurPRL2004 ; SushkovPRL2007 . In YMn2O5, Mn spins order at 44 K in a periodically modulated structure with an incommensurate wave vector . This state is paraelectric. Upon further cooling by a few degrees, first and then locks to a commensurate value and this commensurate (CM) phase, having the wave vector , is ferroelectric Kobayashi2004 ; INOM . At 19 K the wave vector of the magnetic structure becomes again incommensurate: . This low-temperature incommensurate (LTI) state is also ferroelectric but has a much smaller polarization Kobayashi2004 ; ChaponPRL2006 . This unusual sequence of transitions results from geometrical frustration in the Mn spin lattice BlakePRB2005 ; HarrisPRL2008 ; Sushkov08 .
Magnetic orders in the CM and LTI phases were for some time a matter of controversy. However, several groups recently reported similar spin structures Kobayashi2004 ; VecchiniPRB2008 ; Kim08 ; RadaelliPRB79 . In the CM phase spins are approximately collinear and lie nearly antiparallel along the axis, due to the relatively strong antiferromagnetic (AFM) exchange along this direction. The AFM chains are also discernable in the LTI state, which, however, is strongly non-collinear as the angles between spins in neighboring AFM chains are close to . The LTI spin structure, which can roughly be characterized as a spiral where spins rotate in the plane, is actually rather complex as it also contains considerable and spiral components Kobayashi2004 ; Kim08 ; RadaelliPRB79 . A phenomenological analysis of the observed spin orders was used to show that the spontaneous electric polarization in the CM phase largely results from non-relativistic exchange interactions, while the much smaller polarization in the LTI phase has a sizable contribution from relativistic mechanisms Kim08 ; RadaelliPRB79 . Furthermore, recent optical measurements revealed the presence of three electromagnon peaks in the optical absorption spectrum of the non-collinear LTI state, the nature of which was not fully understood SushkovPRL2007 .
In this Letter we report the results of inelastic neutron scattering (INS) for the LTI state of YMn2O5, providing the first information about magnetic excitations in AMn2O5 of multiferroic materials. We also present a theoretical analysis of the observed low-energy magnon bands, identifying them as electromagnon modes. Good agreement with results of optical experiments SushkovPRL2007 clarifies the microscopic mechanism that couples spin waves to electric field in AMn2O5 compounds.
In order to study dynamic properties of YMn2O5, a 6 g powder sample and two single crystals with a total mass of about 1 g were used. The powder sample was sintered at 1180∘C for 60 h with intermediate grindings. X-ray powder diffraction results at room temperature (not shown) indicated single-phase YMn2O5 with a orthorhombic unit cell ChaponPRL2006 . Single crystals were grown using B2O3-PbO-PbF2 flux in a Pt crucible. The mixture was held at 1280∘C for 15 hours then cooled to 950∘C at 1∘C per hour. Both crystals used were characterized by neutron diffraction as described in Ref. Kim08 . INS experiments on the powder sample were carried out in a liquid 4He cryostat using cold neutrons with the incident energy of 25.25 meV on the Disk-Chopper-Spectrometer (DCS) at the NIST Center for Neutron Research (NCNR). INS experiments on the single crystals were performed on the cold neutron triple-axis spectrometer, SPINS, and on the thermal neutron triple-axis spectrometer, BT7, at NCNR. The single crystals were co-aligned in the scattering plane within 1∘ and cooled in a 4 K closed-cycle refrigerator. For the INS measurements at SPINS, the energy of the scattered neutrons was set to =5 meV, and a liquid nitrogen cooled Be filter was placed before the analyzer to eliminate higher order neutron contamination, while for the measurement at BT7, =14.7 meV and a PG filter were used.
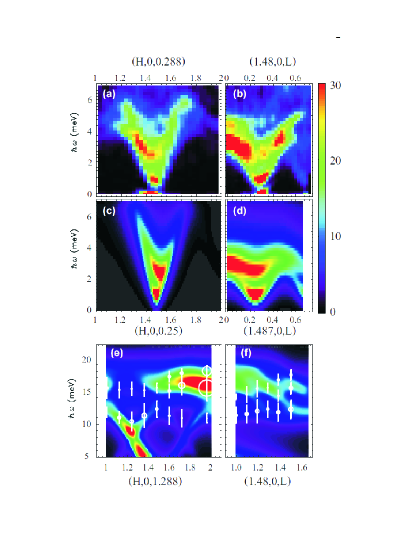
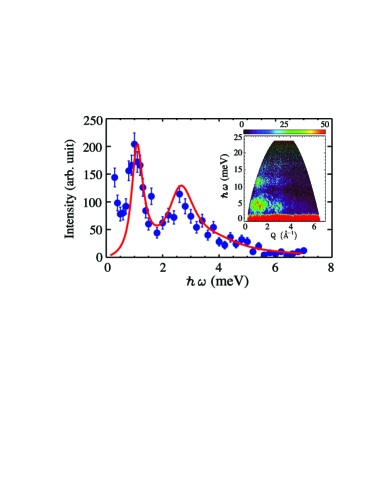
The inset of FIG. 1 shows a contour map of the INS intensity as a function of and , obtained from the powder sample at 1.5 K. In the LTI phase, there exist three broad bands of excitations: one is centered at 4 meV with a bandwidth of 5 meV, indicating that it contains more than one excitation mode, and the other two modes, which are weakly dispersive, are centered at 11 and 16 meV. FIG. 1 shows typical energy scans at in the LTI phase. Up to meV, there are at least three spin wave modes, resulting from a fit to centered at 0.98, 2.71, and 4.75 meV. We have performed similar scans at numerous wave vectors to map out the dispersions of the spin waves along two high symmetry directions, (,0,0.288) and (1.48,0,). The contour maps in FIG. 2 (a) and (b) summarize our results up to 7 meV. Further constant- scans were performed at high energies around 15 meV. The data were fit by Gaussians and the peak positions are plotted as open circles in FIG. 2 (e) and (f). As expected from the powder data shown in the inset of FIG. 1, for 8 meV there are a few highly dispersive excitation modes, while for 8 meV the excitations are weakly dispersive. In addition, there is a gap of 1 meV at the magnetic Bragg reflection due to magnetic anisotropy. The magnetic excitations are more dispersive along the -direction than along the -direction, which indicates that the magnetic interactions are stronger within the -plane than along the -axis.
Since the spin structure of the LTI phase is rather complex, we approximated the magnetic structure to a flat spiral in the plane. We have numerically found the minimal-energy spin configuration in the magnetic unit cell corresponding to crystallographic unit cells (i.e., replacing by ) using the Heisenberg spin Hamiltonian for a spiral state
| (1) |
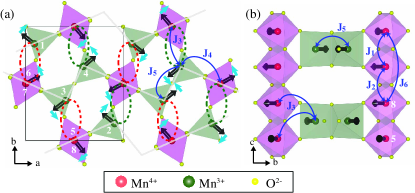
where the sum is over pairs of Mn spins and are the exchange coupling constants. We consider five nearest-neighbor interactions, to (defined as in Ref. ChaponPRL2006, ) as well as the next-nearest-neighbor coupling along the -axis, (see FIG. 3). We also include the easy plane anisotropies, on Mn3+ (Mn sites. The optimal values of the coupling constants obtained by fitting the INS data are listed in Table 1. The red lines in FIG. 1 and color maps of FIG. 2 (c)-(f) show the calculated INS spectrum. Despite the approximation made for the magnetic structure, our calculations reproduce the basic features of the observed magnetic excitations. The agreement between the calculations and the data is better for the -dependence than for the -dependence, probably due to the fact that and are closer to each other in than .
| J1 | J2 | J3 | J4 | J5 | J6 | |||
|---|---|---|---|---|---|---|---|---|
| (meV) | -0.2 | -1.5 | 0.15 | 3.75 | 2.75 | 0.72 | 0.13 | 0.11 |
The basic features of INS results with the wave vector produced by a spiral state can be understood by considering a circular spiral in the co-rotating-spin frame which has one coordinate axis parallel to the average spin vector and another axis perpendicular to the spiral plane Katsura07 . In this co-rotating spin-frame, the momentum transfer vector is conserved. The magnetic excitations at by the magnetic field normal to the spiral plane can be observed at in the lab frame, while the same excitations by an in-plane magnetic field can be observed at .
Using Eq. (1) and the co-rotating-spin frame, we found that there are in total six modes that give rise to low-energy magnon bands in the LTI phase of YMn2O5. Three of them – a phason and two rotations of the spiral plane – are generic for spiral magnets. The phason or sliding mode is a Goldstone mode of any incommensurate spiral state, having zero energy irrespective of the magnitude of higher harmonics in the spiral. It involves rotations of spins in the spiral plane and is excited either by an out-of-plane magnetic field with , or by an in-plane field with . The other two low-energy spiral modes are rotations of the spiral plane around the and axes, and have been found in other spiral magnets SenfPRL2007 . They can be excited either by the corresponding in-plane magnetic fields, and , with (and, hence, can be observed as AFM resonances in optical experiments) or by an out-of-plane magnetic field with . In the absence of an in-plane magnetic anisotropy, these two modes are degenerate. The in-plane magnetic anisotropy induces higher spiral harmonics, lifting the degeneracy.
These three modes have ‘optical’ counterparts, which is a specific property of AMn2O5 compounds due to the fact that spins in a crystallographic unit cell belong to two AFM chains along the axis. In the optical phason mode, spins in neighboring AFM chains rotate in opposite directions (see FIG. 3 (a)). The peculiar lattice geometry of AMn2O5 leads to an almost complete cancelation of exchange interactions between neighboring AFM chains BlakePRB2005 ; Sushkov08 , resulting in near degeneracy of the ‘optical’ and ‘acoustic’ magnon branches.
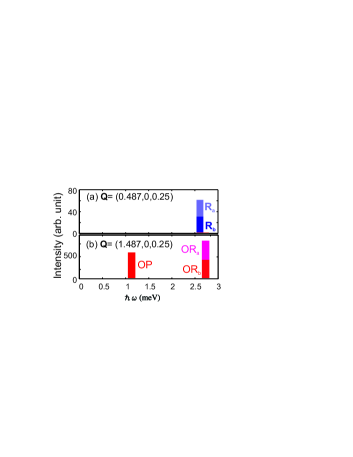
FIG. 4 (a) shows the calculated INS energies and intensities of these six modes at . At this position, the INS intensities corresponding to ‘acoustic’ modes (blue) are large, while the intensities corresponding to the optical modes are hardly visible. At the situation is the opposite (see FIG. 4 (b)), which is related to the shift between neighboring AFM chains. Comparing these results with the experimental data at , we have identified the meV peak as the optical phason which corresponds to the peak at cm-1 observed in optical absorption SushkovPRL2007 . The two optical rotation modes account for the broad peak around 2.5 meV in our INS data. This interpretation is supported by the observation of two close peaks at 16 cm-1 and 21 cm-1 in optical experiments SushkovPRL2007 . These three peaks observed in the optical experiment are electromagnons as they are excited by electric field of light, SushkovPRL2007 . It was previously speculated that the Heisenberg exchange mechanism that induces the electric polarization in the CM phase also couples the optical phason mode to Sushkov08 ; RadaelliPRL2008 . The corresponding invariant for the space group has the form
| (2) |
where the indices 1-8 label Mn ions in the unit cell (see FIG. 3), while labels unit cells. The electric field of light, , modulates interchain interactions along the -direction, e.g., , while , which induces the relative rotation of spins in neighboring AFM chains (see FIG. 3). To prove this scenario we find the coupling constant using the value of polarization in the CM phase, C m-2, and calculate the spectral weight, , of the optical phason. This gives cm-2, which is close to the experimental value of cm-2 Sushkov08 . For large deviations of the LTI spin structure from the flat spiral, Eq.(2) can also explain the excitation of the spiral rotation modes.
In summary, we identified six low-energy magnon modes and determined the exchange interactions in YMn2O5. Three of the six magnon modes are common to all spiral magnets, while the remaining three result from magnetic frustration, which is the source of the complex magnetic behavior and ferroelectricity found in AMn2O5 compounds. The latter three modes were identified with the electromagnons observed in optical conductivity measurements.
The works at UVA and NCNR were supported by the US NSF under Agreement No. DMR-0903977 and DMR-0454672, respectively. The work at Rutgers was supported by the DOE Grants No. DE-FG02-07ER46382. JHC is supported by National Research Foundation of Korea (Grant No. 2010-0018369).
* Email: shlee@virginia.edu
References
- (1) A.B. Sushkov et al., Phys. Rev. Lett. 98, 027202 (2007)
- (2) T. Kimura et al., Nature 426, 55 (2003).
- (3) N. Hur et al., Nature 429, 392 (2004).
- (4) N.A. Spaldin et al., Science 309, 391 (2005).
- (5) S.-W. Cheong et al., Nature Mater. 6, 13 (2007).
- (6) D. Khomskii, Physics 2, 20 (2009).
- (7) D.J.P. Morris, et al., Science. 326, 414 (2009).
- (8) J. Fennell, et al., Science. 326, 415 (2009).
- (9) L. Balents, Nature 464, 199 (2010).
- (10) S.-H. Lee et al. Nature 418, 856 (2002).
- (11) A. Pimenov et al., Nature Physics 2, 97 (2006).
- (12) S. Petit et al., Phys. Rev. Lett. 99, 266604 (2007).
- (13) M. Fiebig et al., Nature 419, 818 (2002).
- (14) T. Choi et al., Nature Mater. 9, 253 (2010).
- (15) M. Kenzelmann et al., Phys. Rev. Lett. 95, 087206 (2005).
- (16) H. Katsura et al., Phys. Rev. Lett. 95, 057205 (2005).
- (17) I. A. Sergienko et al., Phys. Rev. B 73, 094434 (2006).
- (18) M. Mostovoy, Phys. Rev. Lett. 96, 067601 (2006).
- (19) T. Goto et al., Phys. Rev. Lett. 92, 257201 (2004).
- (20) R. Valdes Aguilar et al., Phys. Rev. Lett. 102, 047203 (2009).
- (21) I.A. Sergienko et al., Phys. Rev. Lett. 97, 227204 (2006).
- (22) N. Hur et al., Phys. Rev. Lett. 93, 107207 (2004).
- (23) S. Kobayashi et al., J. Phys. Soc. Jpn. 73, 1593 (2004).
- (24) A. Inomata et al., J. Phys.: Condens. Mat. 8, 2673 (1996).
- (25) L.C. Chapon et al., Phys. Rev. Lett. 96, 097601 (2006).
- (26) G.R. Blake et al., Phys. Rev. B 71, 214402 (2005).
- (27) A.B. Harris et al., Phys. Rev. Lett. 100, 217202 (2008).
- (28) A.B. Sushkov et al., J. Phys.: Condens. Matter 20, 434210 (2008).
- (29) P.G. Radaelli et al., Phys. Rev. Lett 101, 067205 (2008).
- (30) C. Vecchini et al., Phys. Rev. B 77, 134434 (2008).
- (31) J.-H. Kim et al., Phys. Rev. B 78, 245115 (2008).
- (32) P.G. Radaelli et al., Phys. Rev. B 79, 020404 (2009).
- (33) H. Katsura et al., Phys. Rev. Lett. 98, 027203 (2007).
- (34) D. Senff et al., Phys. Rev. Lett 98, 137206 (2007).