Detailed interstellar polarimetric properties of the Pipe nebula at core scales
Abstract
We use -band CCD linear polarimetry collected for about 12 000 background field stars in 46 fields of view toward the Pipe nebula to investigate the properties of the polarization across this dark cloud. Based on archival 2MASS data we estimate that the surveyed areas present total visual extinctions in the range . While the observed polarizations show a well ordered large scale pattern, with polarization vectors almost perpendicularly aligned to the cloud’s long axis, at core scales one see details that are characteristics of each core. Although many observed stars present degree of polarization which are unusual for the common interstellar medium, our analysis suggests that the dust grains constituting the diffuse parts of the Pipe nebula seem to have the same properties as the normal Galactic interstellar medium. Estimates of the second–order structure function of the polarization angles suggest that most of the Pipe nebula is magnetically dominated and that turbulence is sub-Alvénic. The Pipe nebula is certainly an interesting region where to investigate the processes prevailing during the initial phases of low mass stellar formation.
Subject headings:
ISM: clouds — ISM: individual objects: Pipe nebula — Stars: formation — Techniques: polarimetry1. Introduction
The relatively low Galactic star formation efficiency (SFE, defined as the fraction of a molecular gas mass that is converted into stars) is one fundamental constraint on the global properties of star formation. In our Galaxy the SFE is observationally estimated to be of the order of a few percent when whole giant molecular complexes are considered. For instance, the detailed study of the Taurus molecular cloud complex conducted by Goldsmith et al. (2008) provided a SFE between 0.3 and 1.2%. Magnetic fields and supersonic turbulence are two mechanisms that are commonly invoked for regulation of such small SFE. Magnetic fields may regulate cloud fragmentation by several physical processes (e.g., moderating the infalling motions on the density peaks, controlling angular momentum evolution through magnetic breaking, launching jets from the near-protostellar environment, etc). On the other hand, it is known that turbulence may play a dual role, both creating overdensities to initiate gravitational contraction or collapse, and countering the effects of gravity in these overdense regions. The respective rules of magnetic fields and interstellar turbulence in regulating the core/star formation process are, however, highly controversial. For instance, some authors opine that magnetic fields are absolutely dominant in the star formation process (e.g., Tassis & Mouschovias, 2005; Galli et al., 2006), while others support that super-Alfvénic turbulence provides a good description of molecular cloud dynamics, and that the average magnetic field strength in those clouds may be much smaller than required to support them against the gravitational collapse (see Padoan et al., 2004, and references therein).
The Pipe nebula, a massive filamentary cloud complex ( M, Lombardi et al., 2006) located at the solar vicinity (145 pc, Alves & Franco, 2007) which presents an apparently quiescent nature, seems to be an interesting place to look for some answers on the physical processes involved in the collapse of dense cloud cores and how they evolve until stars are formed.
Optical images of the Pipe nebula (see for instance the wonderful high quality image obtained by Stéphane Guisard for the GigaGalaxy project111http://www.gigagalaxyzoom.org) or the dust extinction map obtained by Lombardi et al. (2006), show that this complex comprises many dark cores and sinuous dark lanes. Although Alves et al. (2007) have identified 159 dense cores with estimated masses ranging from 0.5 to 28 M all over the entire Pipe nebula, the only known star forming active site in this nebula seems to be restricted to its northwestern extreme (in galactic coordinates), the densest part of the complex associated with the dark cloud Barnard 59 (B 59), which corresponds to only a small fraction of the entire cloud mass. Actually, an embedded cluster of young stellar objects within B 59 has been revealed by infrared images obtained with the Spitzer Space Telescope (Brooke et al., 2007). The apparently low efficiency in forming stars observed for this cloud complex (only 0.06% according to Forbrich et al., 2009, 2010), suggests that the Pipe nebula is an example of a molecular cloud in a very early stage of star formation. Indeed, in our previous paper (Alves et al., 2008, hereafter Paper I) it has been suggested that the Pipe nebula may present three distinct evolutionary stages, being the B 59 region the most evolved of them while the opposite extreme of the cloud (the bowl) would be in the earlier stage. This suggestion seems to be reinforced by the recent Spitzer census of star formation activity performed by Forbrich et al. (2009), who detected only six candidate young stellar objects (YSOs) outside the B 59 region, four of them located in the “stem” of the Pipe, none having been detected in the bowl. Moreover, the youthfulness of the YSOs in B 59 is corroborated by the results obtained by Covey et al. (2010), who estimated a median age of about 2.6 Myrs to the candidate YSOs found in B 59. Interestingly, they suggest that this population may be older than the well studied ones in Chamaeleon, Taurus, and Ophiuchus, respectively.
In Paper I we described the global polarimetric properties of the Pipe nebula as obtained from mean values of polarization degree and dispersion in polarization angles calculated for stars having . In the present paper we introduce the details of our data sample collected for 46 CCD fields, which are exactly the same as the one used in the previous work, and analyse the polarimetric properties of the Pipe nebula at core scales. In order to increase the statistical sample for each investigated field, we were less strict in our selection criteria accepting stars with .
2. Observations
2.1. Data acquisition and reductions
| Turnshek et al. | Schmidt et al. | this work | ||
|---|---|---|---|---|
| HD | V | PV (%) | PV (%) | PR (%) |
| 12021 | 8.85 | — | 0.078 (0.018) | 0.106 (0.037) |
| 98161 | 6.27 | 0.017 (0.006) | — | 0.028 (0.041) |
| 154892 | 8.00 | 0.050 (0.030) | — | 0.027 (0.041) |
| 176425 | 6.23 | 0.020 (0.009) | — | 0.031 (0.017) |
| BD+28 4211 | 10.51 | — | 0.054 (0.027) | 0.066 (0.025) |
| Turnshek et al. | Heiles | this work | |||||
|---|---|---|---|---|---|---|---|
| HD | V | PV (%) | (°) | P (%) | (°) | PR (%) | (°) |
| 110984 | 8.95 | 5.70 (0.01) | 91.6 | 5.19 (0.11) | 90.6 | 5.21 (0.19) | 91.4 |
| 111579 | 9.50 | 6.46 (0.01) | 103.1 | 6.21 (0.17) | 103.0 | 6.11 (0.09) | 103.1 |
| 126593 | 8.50 | 5.02 (0.01) | 75.2 | 4.27 (0.10) | 77.0 | 4.65 (0.11) | 74.9 |
| 155197 | 9.20 | 4.38 (0.03) | 103.2 | 3.99 (0.08) | 103.9 | 3.98 (0.07) | 105.2 |
| 161306 | 8.30 | — | 3.69 (0.09) | 67.5 | 3.59 (0.23) | 67.9 | |
| 168625 | 8.40 | — | 4.42 (0.20) | 14.0 | 4.23 (0.07) | 14.9 | |
| 170938 | 7.90 | — | 3.69 (0.20) | 119.0 | 3.62 (0.11) | 118.8 | |
| 172252 | 9.50 | — | 4.65 (0.20) | 148.0 | 4.38 (0.14) | 147.7 | |
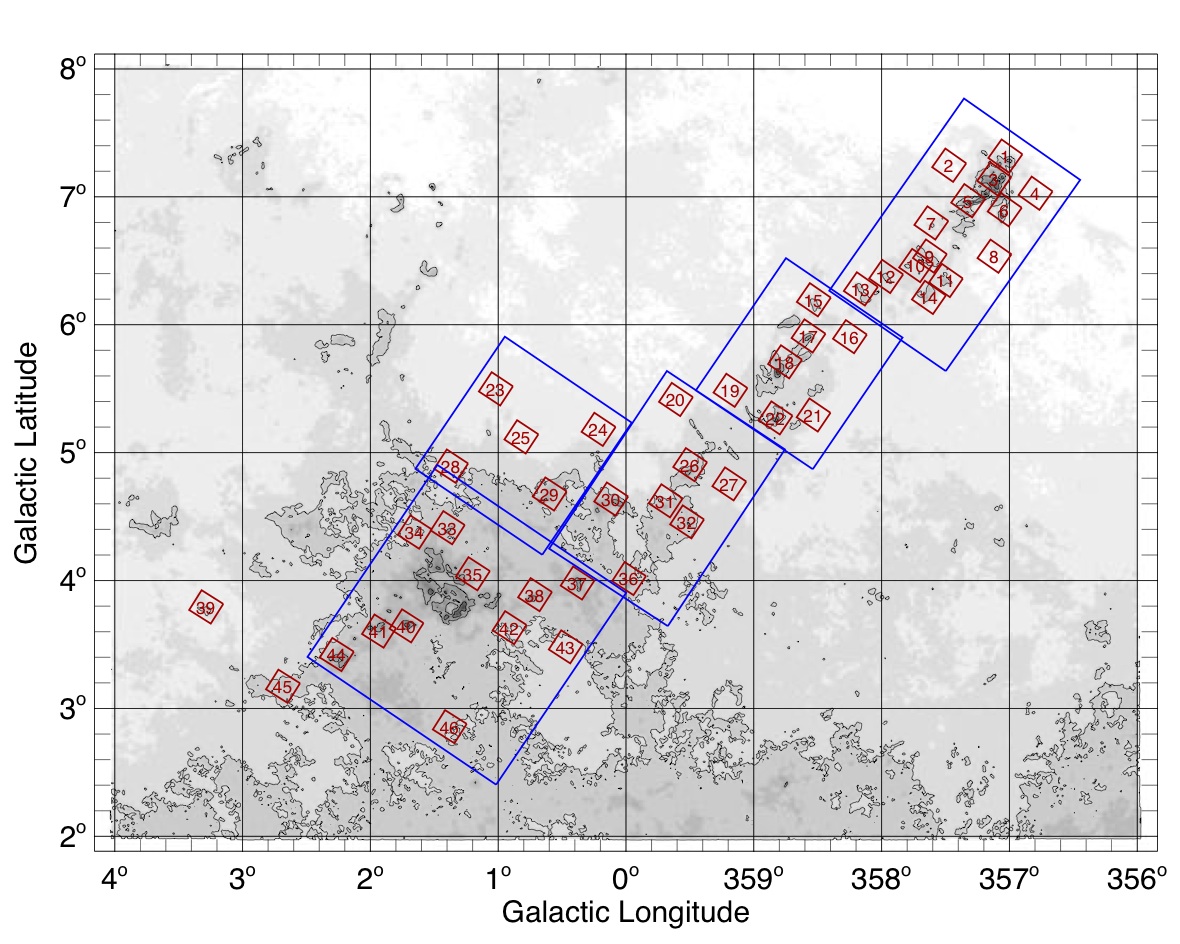
The polarimetric data were collected with the 1.6 m and the IAG 60 cm telescopes at Observatório do Pico dos Dias (LNA/MCT, Brazil) in missions conducted from 2005 to 2007. These data were obtained with the use of a specially adapted CCD camera to allow polarimetric measurements — for a suitable description of the polarimeter see Magalhães et al. (1996). -band linear polarimetry was obtained for 46 fields (with field of view of about each) distributed over more than 7° (17 pc in projection) covering the main body of the Pipe nebula. The observing lines-of-sight were visually selected from inspection of the IRAS 100 m emission image of the Pipe nebula prior to the publication by Lombardi et al. (2006) of the dust extinction map of this cloud complex. In our selection we chose directions toward high dust emission as well as some directions pointing to positions presenting lower emission but close to the main body of the complex as defined by the 100 m image. After that, Alves et al. (2007) published their list of dense cores and some of our selected fields turned out either to completely include one of these cores or part of its outskirts. In Fig. 1 the observed lines-of-sight are overplotted on the dust extinction map of the Pipe nebula obtained by Lombardi et al. (2006). The small squares roughly indicates the areas covered by the observed frames.
When in linear polarization mode, the polarimeter incorporates a rotatable, achromatic half-wave retarder followed by a calcite Savart plate. The half-wave retarder can be rotated in steps of 225, and one polarization modulation cycle is covered for every 90° rotation of this waveplate. This arrangement provides two images of each object on the CCD with perpendicular polarizations (the ordinary, , and the extraordinary, , beams). Rotating the half-wave plate by 45° yields in a rotation of the polarization direction of 90°. Thus, at the CCD area where was first detected, now is imaged and vice versa. Combining all four intensities reduces flatfield irregularities. In addition, the simultaneous imaging of the two beams allows observing under non-photometric conditions and, at the same time, the sky polarization is practically canceled. Eight CCD images were taken for each field with the polarizer rotated through 2 modulation cycles of 0°, 225, 45°, and 675 in rotation angle.
Among the 46 sky positions, twelve were observed at the IAG 60 cm telescope. At this telescope the integration time was set to 120 seconds and 5 frames were collected and co-added for each position of the half-wave plate (totalizing 600 seconds per wave plate position). The remaining 34 fields were observed at the 1.6 m telescope, where the integration time for most of the observed positions was also set to 120 seconds, being that only one frame was acquired for each position of the half-wave plate. In order to have almost the same field of view, the latter telescope was provided with a focal reducer.
The CCD images were corrected for read-out bias, zero level bias and relative detector pixel response. After these normal steps of CCD reductions, we identified the corresponding pairs of stars and performed photometry on them in each of the eight frames of a given field using the IRAF DAOPHOT package. From the obtained file containing magnitude data, we calculate the polarization by use of a set of specially developed IRAF tasks (PCCDPACK package; Pereyra, 2000). This set includes a special purpose FORTRAN routine that reads the data files and calculates the normalized linear polarization from a least-square solution, which yields the degree of linear polarization (P), the polarization position angle ( , measured from north to east) and the Stokes parameters Q and U, as well as the theoretical (i.e. the photon noise) and measured errors. The latter are obtained from the residuals of the observations at each waveplate position angle with respect to the expected curve.
Zero polarization standard stars were observed every run to check for any possible instrumental polarization, which proved to be small as can be verified by inspection of Table 1. The reference direction of the polarizer was determined by observing polarized standard stars (Turnshek et al., 1990), complemented with polarized stars from the catalogue compiled by Heiles (2000). For all observing seasons, the instrumental position angles showed a perfect correlation with the standard values (see Table 2), and the expected uncertainty of the zero point for the reference direction must be smaller than 1–2°.
2.2. Results
Our final sample contains 11 948 stars, being that 9 777 of them have , where means the largest between the theoretical and measured errors, that is, about 3 200 stars more than the ones used in the analysis conducted in Paper I which limited the sample to stars presenting . A search in the archival Two-Micron All-Sky Survey (2MASS), available on-line http://irsa.ipac.caltec.edu, identified 11 588 objects that could be associated to our observed stars, and the photometry was retrieved for them. For the remaining we usually failed to associate a 2MASS object either because none was found inside the searched box (up to about 8 times the typical rms error of our astrometric solution) or, in case of the most crowded fields, because the same 2MASS object could be assigned to more then one of ours.

Figure 2 gives the distribution of the estimated polarimetric errors, , as a function of the magnitude, for the observed stars. This figure shows that most of our stellar sample has magnitude within the interval and polarimetric error given by %. The obtained distribution suggests that the uncertainties are dominated by photon shot noise, as expected for a sample collected with fixed exposure time.
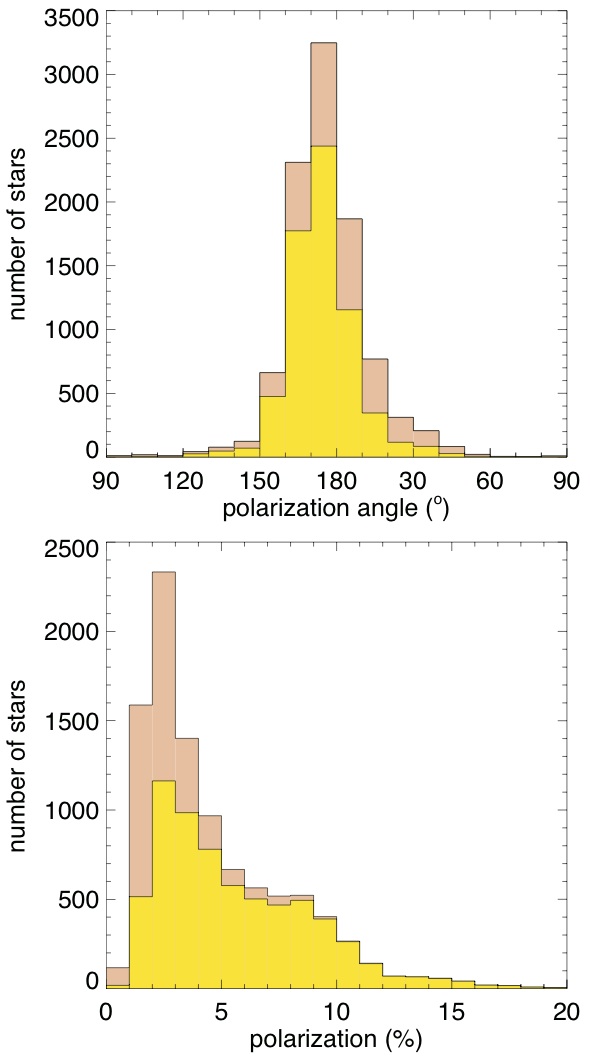
The distribution of obtained degree of polarization for stars with (Fig. 3 – bottom panel) shows a surprising result: several stars present degree of polarization larger than 15%. Indeed, 6 objects present degree of polarization slightly larger than 19%. As far as we know, these are the largest polarization produced by dichroic extinction ever observed — in the stellar polarization catalogue compiled by Heiles (2000) one find only four stars, out of more than 9 000, with degree of polarization higher than 10%, being that the highest of them equals to 12.47%.
The distribution of obtained polarization angles for stars with (Fig. 3 – top panel) shows a large concentration of values around (in equatorial coordinates), that is, 76% of this subsample has polarization angles between 160° and 10°, clearly indicating a high large scale homogeneity in dust grain alignment (and supposedly in the geometry of the magnetic field) all over the whole region. Since the main axis of the Pipe’s stem is almost in line with the west-east direction, it clearly indicates that the observed polarization vectors are mainly perpendicularly aligned to the longer axis of the cloud (see Paper I, ).
It is interesting to compare the distributions for stars having with the ones having , also shown in Fig. 3, and used in our previous work. Visually one can attest that the distribution of polarization angles for both samples are quite similar. Indeed, the mean value of both distributions differ by only 2° and the standard deviation of the sample having is about 25 wider than the one for . On the other hand, as expected for a sample with uncertainties dominated by photon shot noise, most of the stars included by the less tight signal-to-noise condition are the ones presenting smaller degree of polarization.
The high values of polarization obtained in our survey is the result of differential extinction produced by interstellar dust grains on the incoming/background stellar radiation. It is assumed that a large fraction of those grains are aligned. The nature of such alignment is still a matter of debate (see Lazarian, 2003, for a comprehensive review on this subject), however, it is widely believed that the dominant process responsible for the alignment involves interaction between the spin of the dust particles and the ambient magnetic field, as originally proposed by Davis & Greenstein (1951).
3. Data Analysis
3.1. Mean Polarization
Apart from the difference in the adopted signal-to-noise, the results described in Paper I and the ones presented in this work were obtained in the way described below and introduced in Table 3 which gives, for each observed field, coordinates (right ascension and declination), associated dark core, when available, from the list compiled by Alves et al. (2007), the number of stars for which we estimated polarization, and the number of stars with , in columns 2 and 3, 4, 5, and 6 respectively.
| Field | alpha (J2000) delta | CoreaaIdentification from Alves et al. (2007). | observed | stars with | bbObtained by a Gaussian fitting to the distribution of observed polarization angles (measured from the North Celestial Pole to East). | bbObtained by a Gaussian fitting to the distribution of observed polarization angles (measured from the North Celestial Pole to East). | starsccNumber of stars passing the selection criteria which were used to estimate the mean values, and , (see text). | |||||||
|---|---|---|---|---|---|---|---|---|---|---|---|---|---|---|
| h m s | stars | % | % | mag | mag | |||||||||
| 01 | 17 10 28 | 27 22 49 | 06 | 273 | 174 | 9.7 | 10.65 | 168 | 2.45 | 0.82 | 3.1 | 9.65 | 2.54 | 1.25 |
| 02 | 17 11 52 | 27 03 49 | — | 165 | 64 | 12.9 | 15.04 | 63 | 1.82 | 0.85 | 9.8 | 13.72 | 0.63 | 0.35 |
| 03 | 17 11 21 | 27 24 46 | 12 | 62 | 23 | 28.9 | 24.93 | 21 | 1.78 | 0.96 | 48.8 | 23.75 | 3.88 | 2.00 |
| 04 | 17 10 55 | 27 44 26 | — | 400 | 211 | 15.9 | 13.08 | 202 | 1.63 | 0.79 | 14.8 | 12.38 | 1.59 | 0.74 |
| 05 | 17 12 30 | 27 20 42 | 14 | 137 | 50 | 0.9 | 16.82 | 47 | 2.00 | 1.07 | 179.7 | 15.67 | 2.53 | 1.09 |
| 06 | 17 12 01 | 27 37 06 | 08 | 271 | 91 | 128.7 | 40.79 | 87 | 0.62 | 1.36 | 149.8 | 40.21 | 2.33 | 1.19 |
| 07 | 17 13 53 | 27 12 33 | — | 206 | 114 | 167.3 | 12.75 | 108 | 1.27 | 0.61 | 169.3 | 11.74 | 2.06 | 0.97 |
| 08 | 17 13 34 | 27 45 46 | — | 807 | 486 | 7.6 | 8.80 | 464 | 1.76 | 0.63 | 9.2 | 7.40 | 1.58 | 0.78 |
| 09 | 17 14 52 | 27 20 55 | 21 | 189 | 132 | 6.3 | 10.76 | 54 | 3.44 | 0.98 | 3.5 | 10.04 | 3.03 | 1.49 |
| 10 | 17 15 25 | 27 18 09 | — | 191 | 174 | 4.2 | 7.72 | 164 | 3.43 | 1.23 | 4.4 | 7.29 | 3.33 | 1.67 |
| 11 | 17 15 15 | 27 33 38 | 20 | 135 | 130 | 170.8 | 6.76 | 127 | 3.17 | 1.14 | 171.3 | 6.21 | 2.32 | 1.17 |
| 12 | 17 16 20 | 27 09 32 | 25 | 198 | 189 | 176.5 | 4.87 | 179 | 4.46 | 1.01 | 176.8 | 4.32 | 2.72 | 1.22 |
| 13 | 17 17 12 | 27 03 06 | 27 | 199 | 196 | 0.9 | 5.76 | 190 | 4.03 | 0.69 | 1.3 | 5.62 | 2.03 | 0.94 |
| 14 | 17 16 05 | 27 31 38 | 23 | 282 | 280 | 176.0 | 4.40 | 267 | 4.34 | 0.93 | 176.1 | 4.11 | 2.82 | 1.42 |
| 15 | 17 18 27 | 26 47 50 | 31 | 272 | 254 | 7.7 | 10.90 | 243 | 2.18 | 0.78 | 5.3 | 10.63 | 2.32 | 1.16 |
| 16 | 17 18 48 | 27 11 36 | — | 382 | 319 | 2.2 | 4.92 | 301 | 2.39 | 0.50 | 2.6 | 3.52 | 1.98 | 0.98 |
| 17 | 17 19 36 | 26 55 23 | 33 | 214 | 210 | 171.6 | 5.91 | 201 | 2.58 | 0.76 | 171.8 | 5.58 | 2.07 | 0.91 |
| 18 | 17 20 49 | 26 53 08 | 34/40 | 327 | 201 | 164.2 | 9.59 | 198 | 4.63 | 1.68 | 163.0 | 8.60 | 3.64 | 1.81 |
| 19 | 17 22 43 | 26 39 25 | — | 368 | 323 | 167.7 | 7.06 | 306 | 2.31 | 0.79 | 167.2 | 6.35 | 1.86 | 0.94 |
| 20 | 17 24 03 | 26 20 35 | — | 451 | 400 | 32.2 | 9.86 | 383 | 2.05 | 0.73 | 32.5 | 9.23 | 1.49 | 0.68 |
| 21 | 17 21 48 | 27 18 15 | — | 260 | 218 | 179.1 | 8.73 | 209 | 1.96 | 0.38 | 0.8 | 8.05 | 2.33 | 1.16 |
| 22 | 17 22 38 | 27 04 14 | 41/42 | 102 | 97 | 158.1 | 5.35 | 92 | 4.39 | 1.33 | 157.0 | 4.82 | 3.03 | 1.50 |
| 23 | 17 27 13 | 25 07 27 | — | 513 | 412 | 7.1 | 9.44 | 391 | 2.37 | 0.74 | 7.1 | 8.79 | 2.03 | 0.99 |
| 24 | 17 26 25 | 25 58 09 | — | 748 | 520 | 175.1 | 7.61 | 506 | 2.59 | 0.76 | 174.2 | 6.52 | 2.12 | 1.05 |
| 25 | 17 28 07 | 25 29 52 | — | 511 | 461 | 174.2 | 5.58 | 437 | 3.27 | 0.74 | 173.9 | 4.91 | 2.17 | 1.08 |
| 26 | 17 25 40 | 26 43 09 | 48 | 247 | 126 | 142.3 | 32.79 | 120 | 1.99 | 1.49 | 152.9 | 32.52 | 2.21 | 1.26 |
| 27 | 17 25 28 | 27 03 29 | — | 197 | 185 | 143.2 | 11.43 | 183 | 3.39 | 1.30 | 142.2 | 11.19 | 2.21 | 1.10 |
| 28 | 17 30 18 | 25 09 50 | — | 254 | 240 | 172.9 | 5.86 | 231 | 5.61 | 1.16 | 173.3 | 5.35 | 3.18 | 1.59 |
| 29 | 17 29 14 | 25 55 44 | 70 | 98 | 95 | 160.2 | 5.90 | 91 | 5.43 | 1.52 | 160.8 | 5.46 | 3.59 | 1.76 |
| 30 | 17 28 12 | 26 21 10 | 56 | 94 | 93 | 160.6 | 2.54 | 90 | 6.64 | 2.17 | 160.6 | 2.42 | 2.79 | 1.39 |
| 31 | 17 27 12 | 26 42 59 | 51 | 284 | 271 | 155.1 | 5.12 | 258 | 4.99 | 1.59 | 156.1 | 4.61 | 3.47 | 1.73 |
| 32 | 17 27 24 | 26 56 50 | 47 | 143 | 139 | 164.1 | 4.58 | 135 | 6.20 | 1.54 | 164.5 | 3.92 | 3.81 | 1.88 |
| 33 | 17 32 09 | 25 24 18 | 91 | 329 | 313 | 169.9 | 4.04 | 301 | 8.10 | 1.30 | 169.3 | 3.22 | 4.38 | 2.16 |
| 34 | 17 32 54 | 25 12 25 | — | 255 | 244 | 168.9 | 3.17 | 236 | 7.98 | 1.38 | 169.9 | 2.54 | 3.91 | 1.87 |
| 35 | 17 33 01 | 25 46 00 | 89 | 133 | 130 | 171.7 | 2.37 | 125 | 10.83 | 1.80 | 171.3 | 1.95 | 4.48 | 2.23 |
| 36 | 17 30 11 | 26 48 42 | — | 144 | 142 | 160.4 | 3.76 | 138 | 9.79 | 1.62 | 160.1 | 3.65 | 3.24 | 1.51 |
| 37 | 17 31 18 | 26 29 36 | 66 | 111 | 111 | 169.8 | 3.40 | 105 | 13.92 | 2.29 | 170.6 | 3.11 | 4.53 | 2.15 |
| 38 | 17 32 27 | 26 15 49 | 74 | 127 | 127 | 172.6 | 3.36 | 125 | 15.51 | 2.85 | 173.4 | 3.26 | 4.48 | 2.11 |
| 39 | 17 38 56 | 24 08 57 | 151 | 249 | 245 | 6.5 | 6.07 | 233 | 3.87 | 1.04 | 7.8 | 5.83 | 2.29 | 1.10 |
| 40 | 17 35 47 | 25 33 01 | 109 | 80 | 77 | 165.2 | 4.07 | 73 | 11.04 | 1.84 | 167.0 | 3.88 | 3.55 | 1.66 |
| 41 | 17 36 27 | 25 23 27 | — | 62 | 62 | 170.8 | 4.30 | 57 | 10.54 | 2.16 | 170.0 | 4.19 | 2.81 | 1.36 |
| 42 | 17 33 54 | 26 14 11 | — | 181 | 177 | 174.6 | 3.05 | 170 | 9.49 | 1.68 | 174.3 | 2.91 | 3.21 | 1.53 |
| 43 | 17 33 24 | 26 41 13 | — | 424 | 422 | 167.3 | 3.03 | 406 | 8.06 | 2.07 | 167.2 | 2.84 | 3.10 | 1.53 |
| 44 | 17 37 55 | 25 12 40 | 132 | 119 | 114 | 0.7 | 3.76 | 108 | 8.49 | 1.51 | 0.2 | 3.59 | 3.65 | 1.79 |
| 45 | 17 39 50 | 24 59 16 | 140 | 412 | 401 | 177.9 | 5.51 | 389 | 6.29 | 1.57 | 177.5 | 5.24 | 4.04 | 1.95 |
| 46 | 17 37 56 | 26 15 32 | — | 363 | 353 | 169.8 | 4.13 | 335 | 6.74 | 1.59 | 169.6 | 3.82 | 3.55 | 1.65 |
Mean polarization and polarization degree were estimated for each of the observed area adopting a procedure similar to the one used by Pereyra & Magalhães (2007), that is, to improve the precision of the mean values, we selected only those objects with observed polarization angle within the interval () where, and are the mean polarization angle and standard deviation of each field sample (columns 7 and 8, respectively, in Table 3). The mean Stokes parameters, and , for each field, were estimated from the individual values for each star (), weighted by the error () according to
The estimated mean polarization value and its associated error are then given by
where and are the estimated standard deviation for the mean Stokes parameters and , respectively. The mean polarization position angle is given by
The number of stars passing the filter, the obtained mean polarization, its estimated uncertainty, and the polarization angle for the mean polarization vector are given in columns 9, 10, 11, and 12 of Table 3, respectively. Column 13 shows the dispersion of polarization angles corrected in quadrature by the mean error of the polarization position angle, that is, , where the mean error, , was estimated from , where is the estimated uncertainty of the star’s polarization angle222The uncertainty of the polarization angle is estimated by error propagation in the expression of the position angle , which yields , in radians, or (see for instance, Serkowski, 1974) when expressed in degrees..
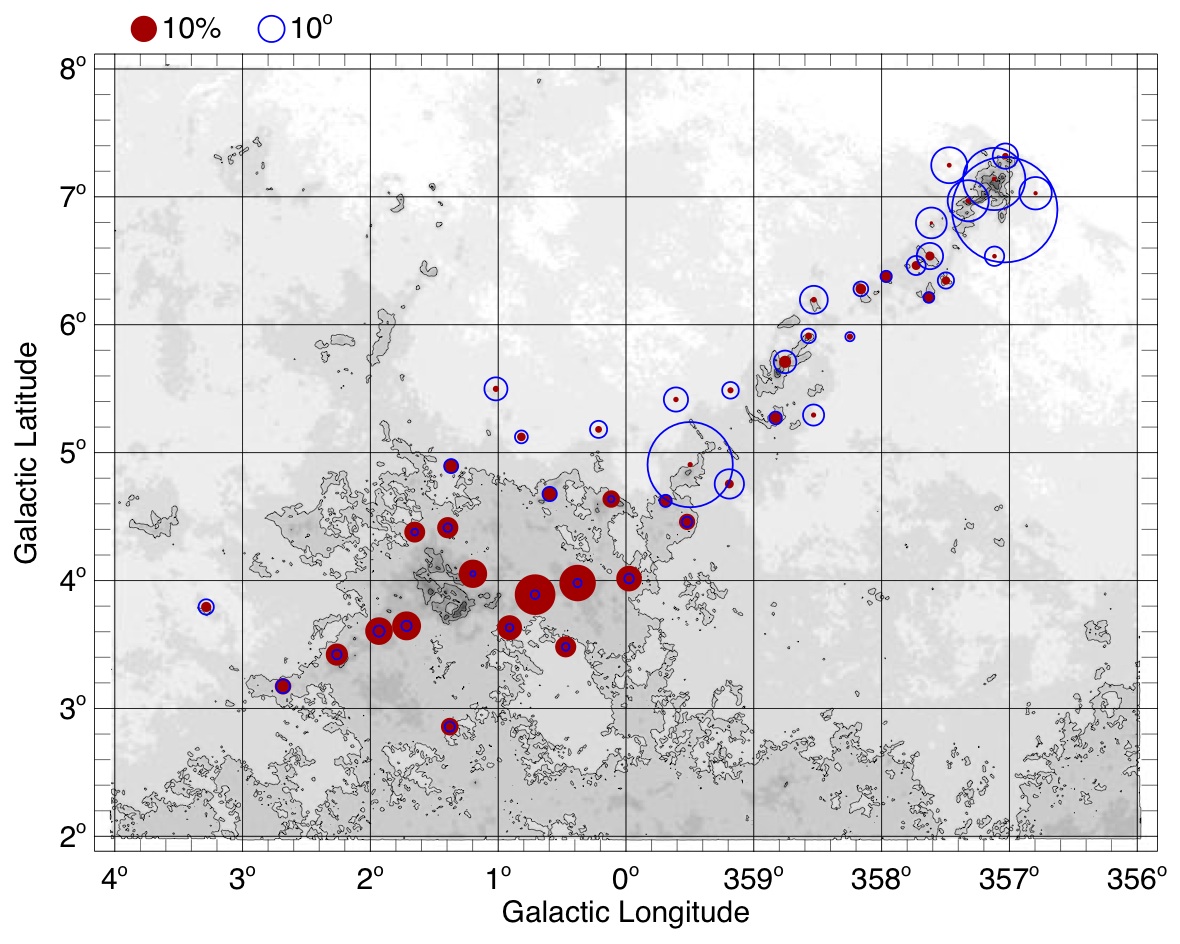
The global polarimetric properties of the Pipe nebula were already presented in Paper I, and show some interesting results. For instance, the obtained mean polarizations for the region of B 59 and along the stem are typical for star formation regions (e.g., Vrba et al., 1993; Whittet et al., 1994, 2001), while the values obtained for the bowl are unusually high. Another noteworthy result presented in Paper I is the apparent general tendency of decreasing dispersion in polarization angles along the filamentary structure of the Pipe nebula from B 59 toward the bowl, while the mean degree of polarization increases toward this end. This effect is better visualized by inspection of the image presented in Fig. 4, where we represented the obtained mean polarization degree and dispersion of polarization angles by filled and open circles, respectively, scaled to the values of these observational quantities. In fact, this figure is more instructive than the diagram introduced in Fig. 2 of Paper I, because in addiction to the above mentioned anti-correlation between polarization degree and dispersion of polarization angles seen along the main axis of the complex, one can also see how these two quantities distributes spatially over the cloud. In general, one see that fields toward lower infrared absorption have the tendency of presenting larger values of dispersion of polarization angles. A noticeable exception is Field 26, located close to the center of the area displayed on Fig. 4, which presents the second largest dispersion value in our sample ().
All fields, but three, having a rather broad distribution of polarization angles () are in the vicinity of B 59. The exceptions are: Field 15, laying in the stem almost middle way from B 59 to the bowl, the already mentioned Field 26, and Field 27, both located in the eastern side of the stem, close to the bowl.
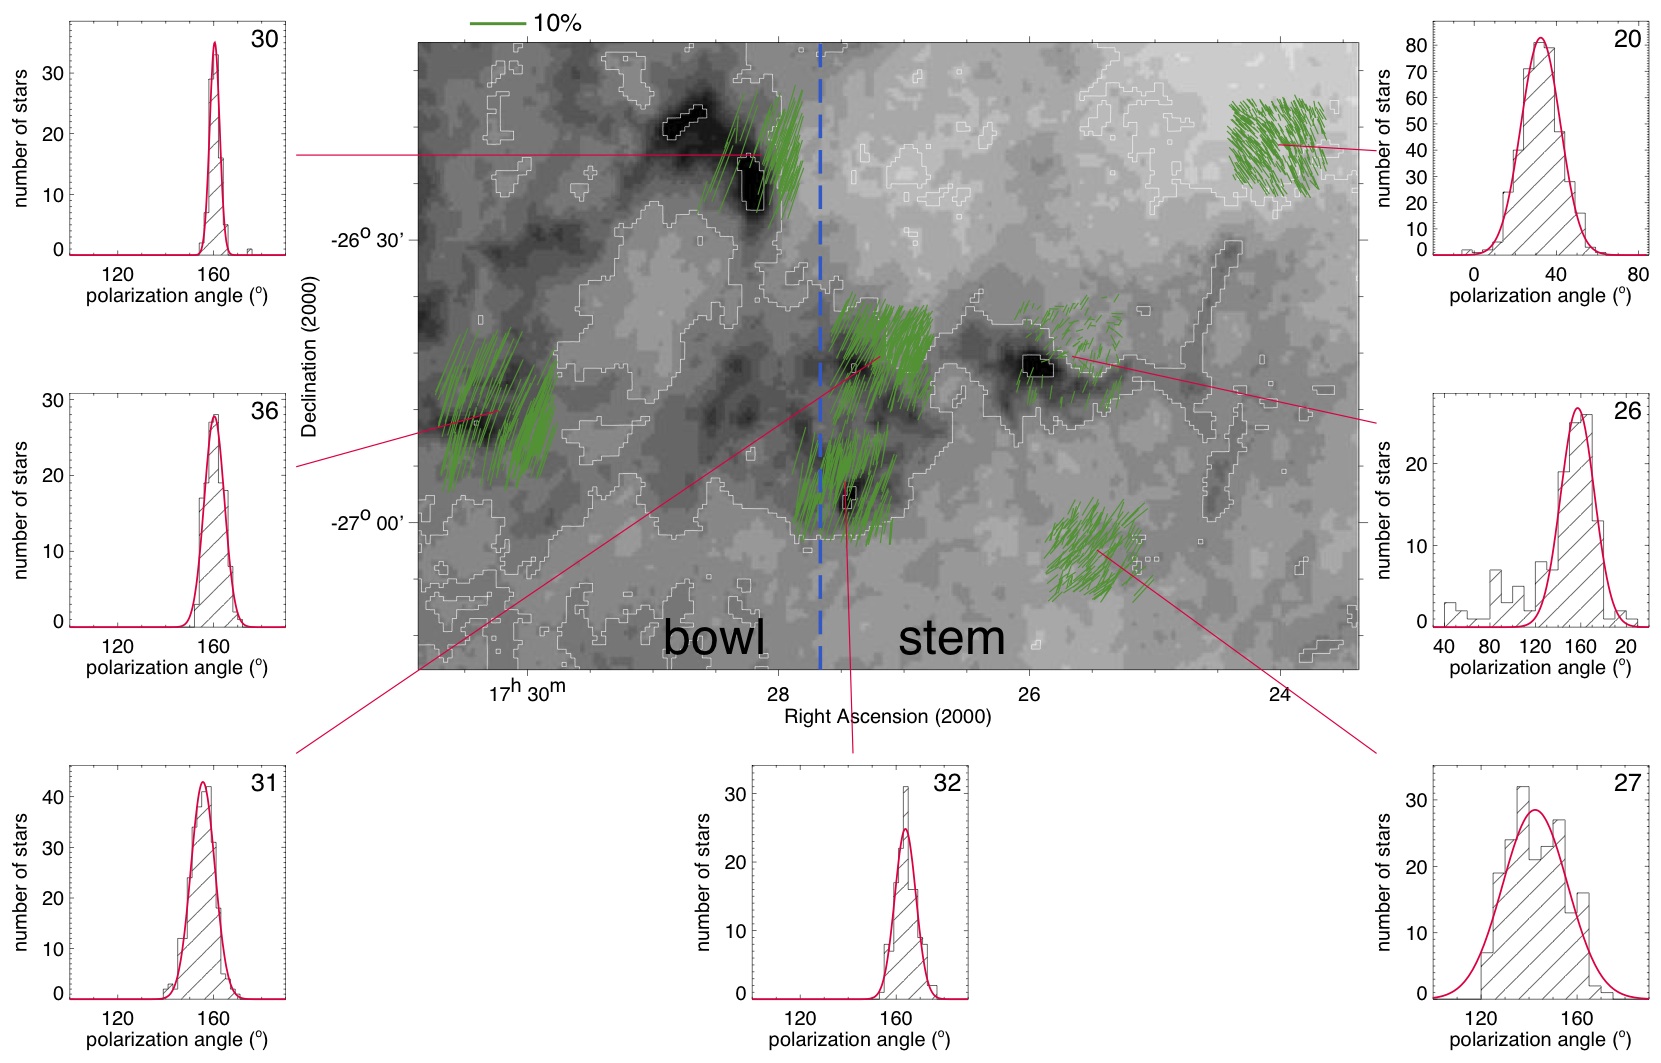
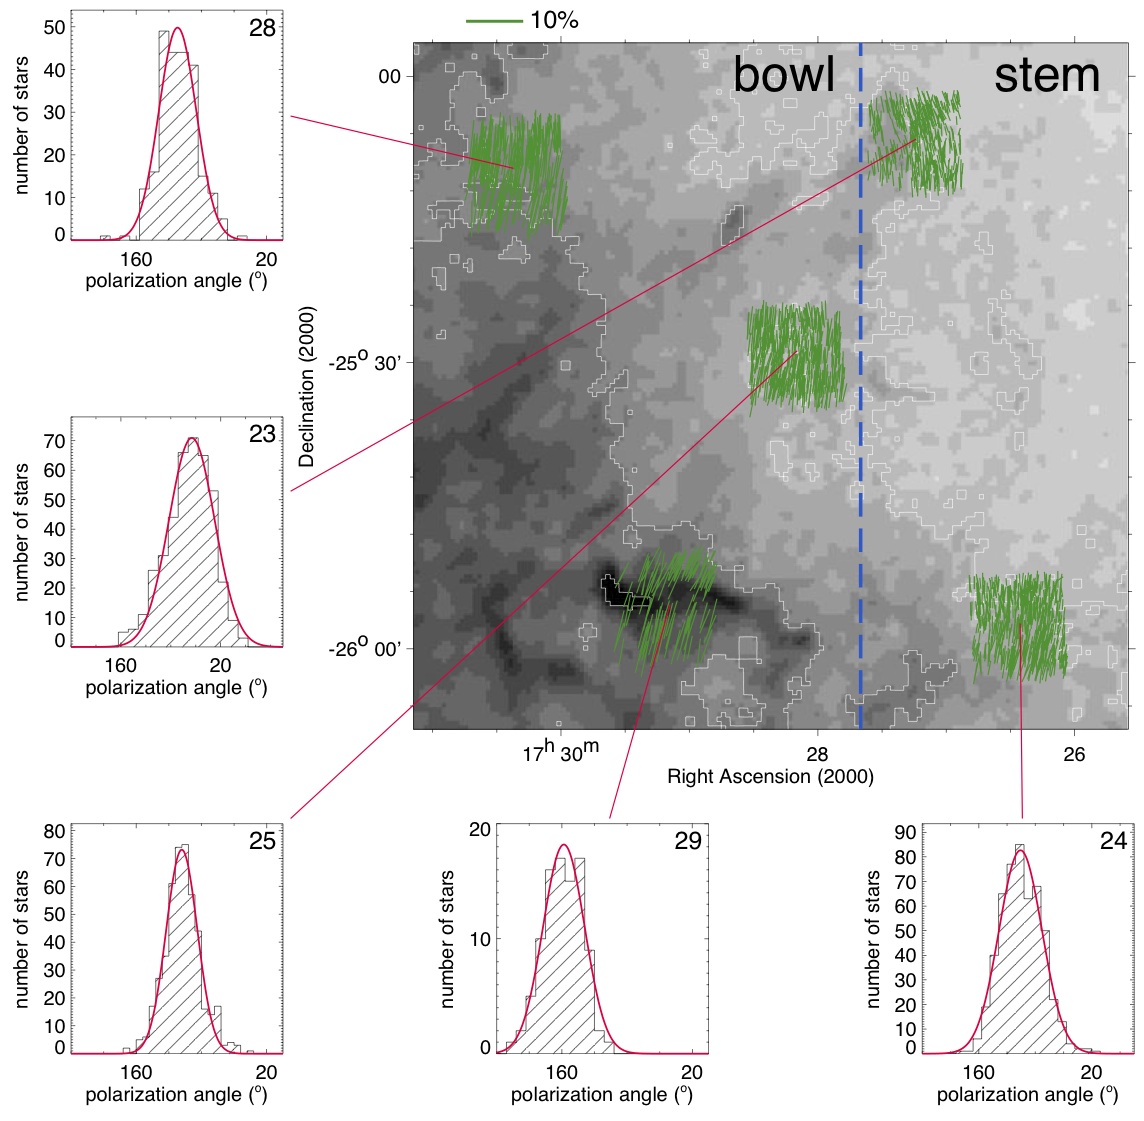
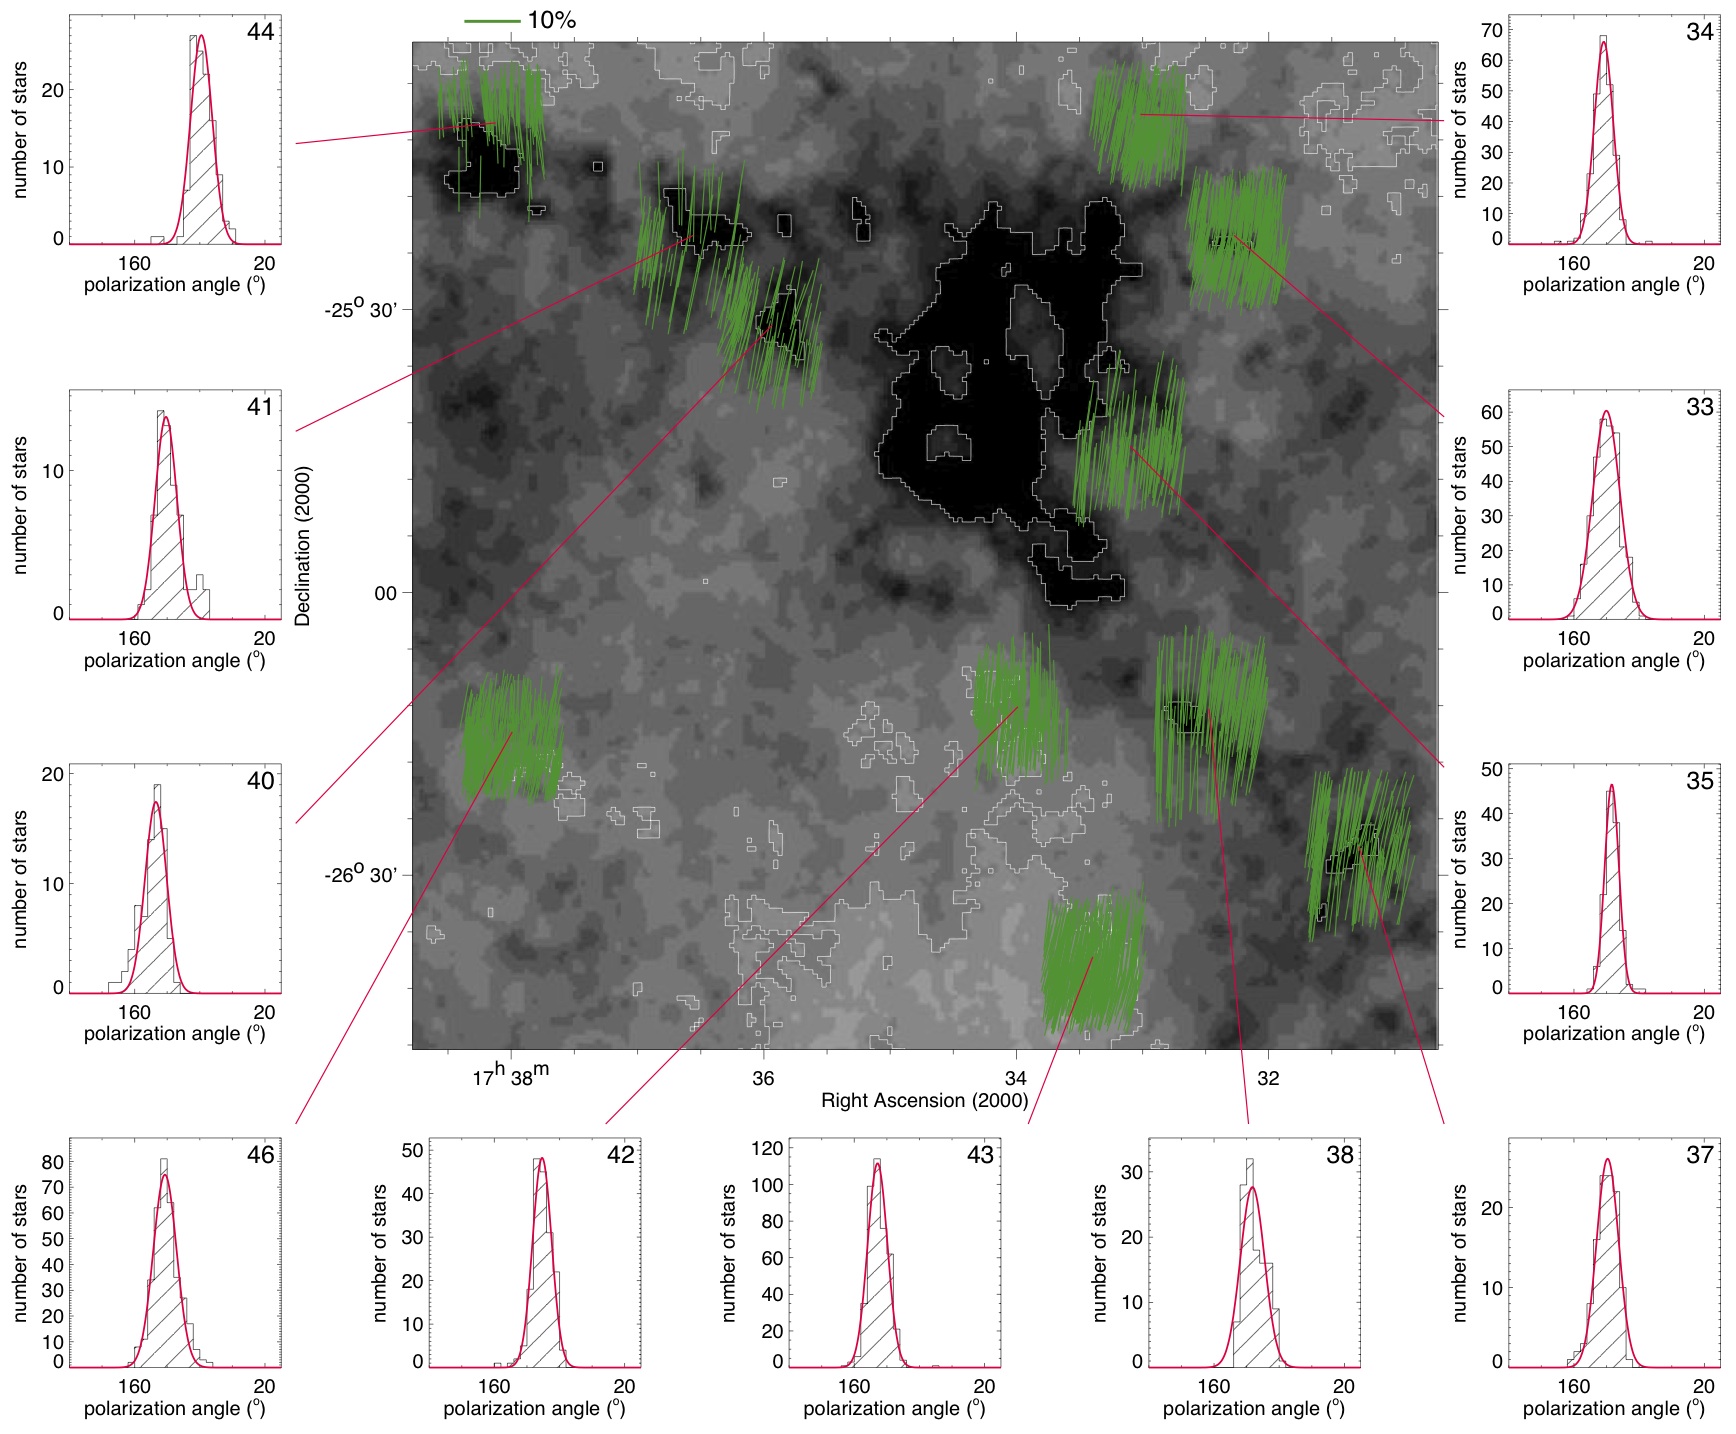
3.2. Polarization maps
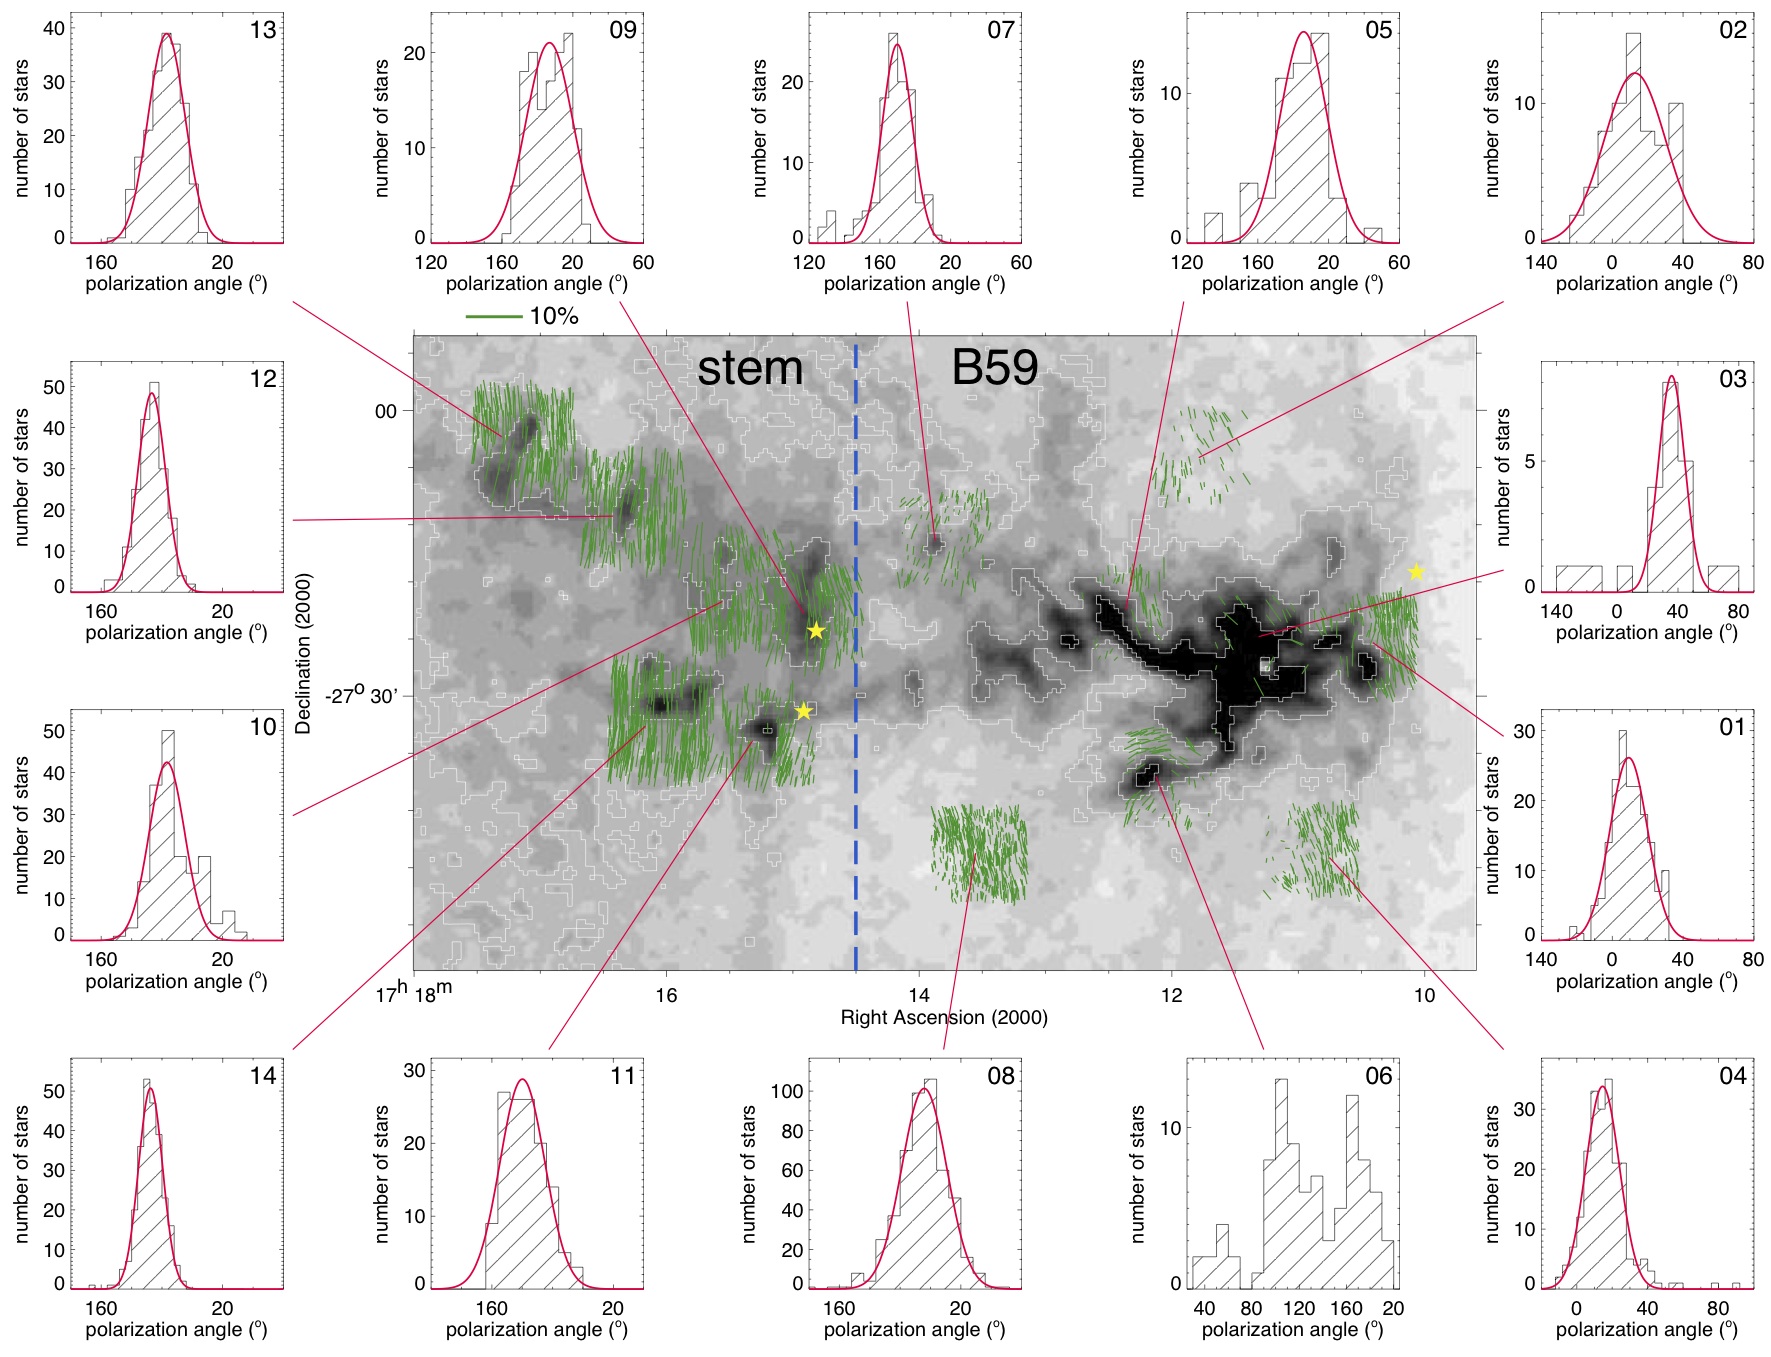
It is instructive to analyze the obtained polarization for each CCD field. In Figs. 5 to 9 the obtained polarization is overlapped onto the dust extinction maps of the 5 large areas demarcated in Fig. 1, which cover all observed CCD fields except Fields 39 and 45. The histograms give the distribution of obtained position angles for each field, identified in the upper right corner. The gaussians represent the best fit to the distribution and are showed for comparison purposes only – they help us to visualize how the distributions of some fields depart from the “normal” distribution. In a classical work, Chandrasekhar & Fermi (1953) obtained a reasonably accurate estimate for the field strength in the diffuse ISM by directly relating the dispersion in polarization position angle to the ratio of two energy densities: the energy density of the uniform component of the field and the energy density of turbulence. Since then, it is widely accepted that the mean value of the distribution of polarization position angle obtained from a polarization map gives the angle of the mean or uniform (large-scale structured) magnetic field for the region under investigation, while the dispersion in the distribution gives information about the statistically independent non-uniform (turbulent or random) component of the magnetic field (a detailed discussion concerning this subject can be found in Myers & Goodman, 1991, and references therein).
The effects of the high interstellar absorption in some of the observed fields are clearly seen on the distribution of the measured stars. For instance, our Field 03, with line-of-sight toward one of the most opaque regions of the entire nebula, the B 59 region (Román-Zúñiga et al., 2007, 2009), is the observed field with the smallest number of stars with (21 stars only). Its histogram of observed polarization position angles and the obtained mean position angle, (Table 3), indicate that most of those stars belong to the right-hand tail of the polarization position angle distribution given in Fig. 3 (top panel). Although the obtained large dispersion of position angles – which is due to 6 stars – the distribution of the remaining stars is rather narrow, as seen in the histogram for Field 03 shown in Fig. 5. The two polarization angles on the right-hand side of the main distribution ( and ) correspond to [BHB2007] 2 and [BHB2007] 1, respectively, supposed to be candidate young stars (Brooke et al., 2007; Forbrich et al., 2009). It is noteworthy that high resolution optical images of the region show a “light cone-shaped” which apparently emanates from these stars and illuminates the surrounding dust material. Interestingly, both observed polarization vectors are almost perpendicular to the symmetry axis of this cone.
From the histograms shown in Fig. 5 we note that most of the fields presenting large dispersion of polarization angles suggest a multicomponent structure, in special, Field 06 presents a very interesting geometry for the obtained distribution of the polarization vectors and deserves further comments (see § 5). Fields 01 to 04 show distributions of polarization angles with many stars having values between 0° and 40°, while the remaining fields given in Fig. 5, already show distributions with polarization angles between 160° and 20°, likely what was obtained for most of the other observed fields.
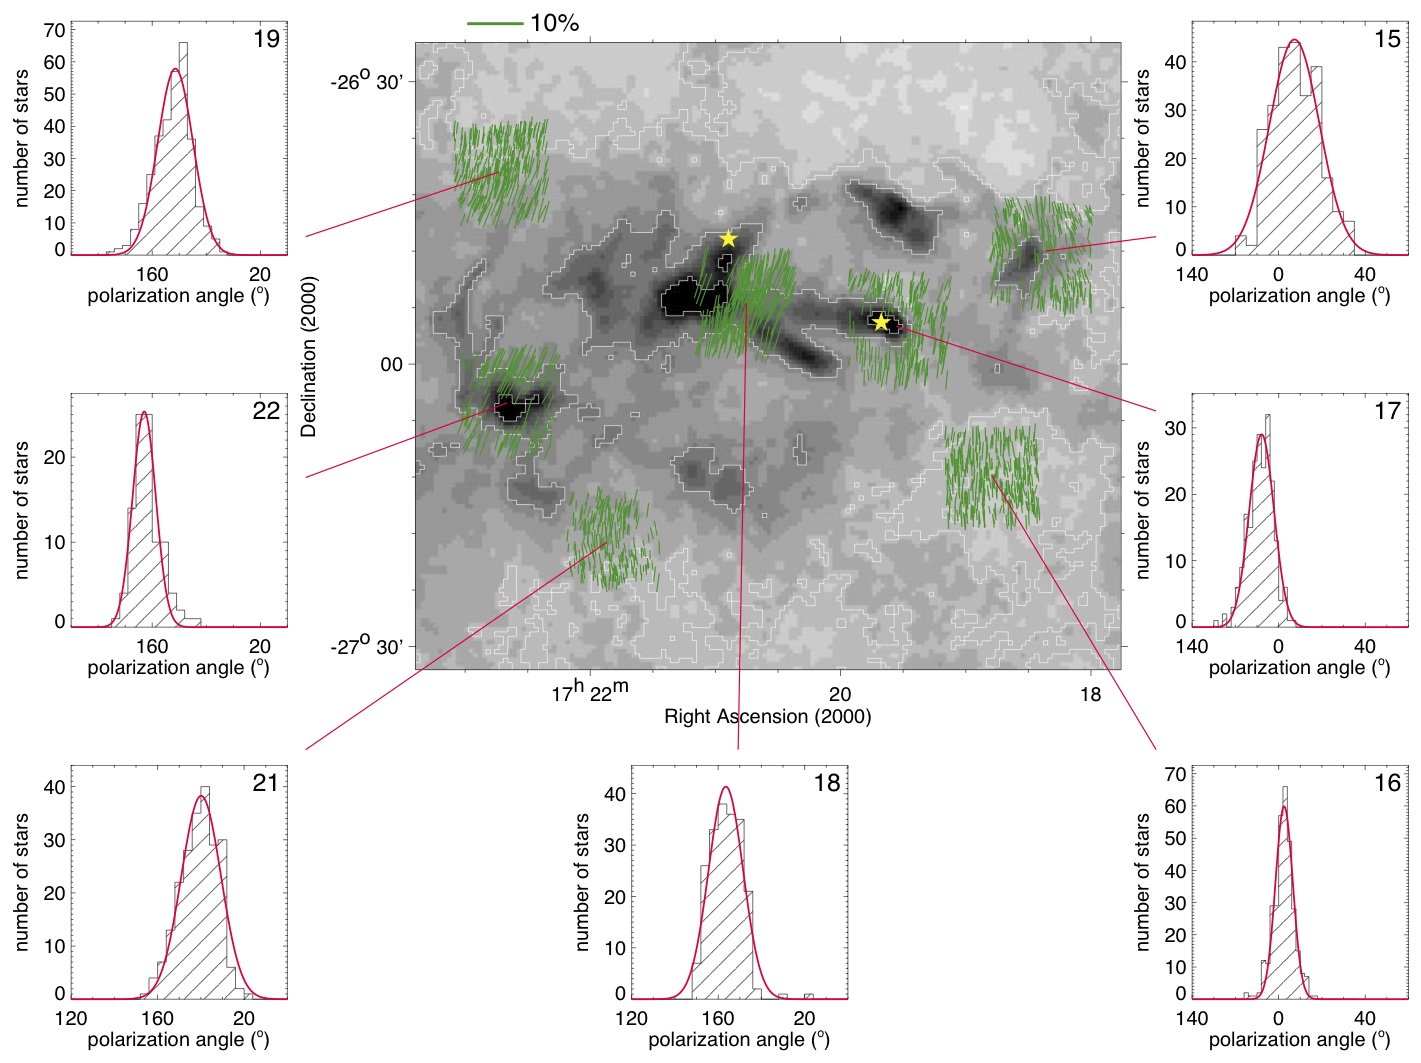
The area covered by Fig. 5 contains, apart from the young stellar cluster identified by Brooke et al. (2007) embedded in B 59, three of the six candidate YSOs found by Forbrich et al. (2009). One of them is the well known KK Oph, a pre-main-sequence binary with 1.6” separation and suggested to constitute a Herbig Ae star with a classical T Tauri companion (e.g., Herbig, 2005; Carmona et al., 2007, and references therein). Although de Winter & Thé (1990) attribute a distance of 310 pc to this star, it is commonly accepted a distance of 160 pc (e.g., Hillenbrand et al., 1992) suggesting that this object may have been formed by material formerly associated to the Pipe nebula. Carmona et al. (2007) estimate an age of about 7 Myr to this system, that is, from 5 to 6 Myr older than the estimated age of the YSOs in B 59. The two other objects are sources 11 and 16 in the Forbrich et al. (2009) candidate YSOs list, and have lines-of-sight toward Fields 09 and 11, respectively, close to the transition between the B 59 and the stem regions, as defined in Paper I. These sources were spectroscopically studied by Covey et al. (2010), who confirmed the youthful character of the latter, and found that it is a visual binary, while the former presents an ambiguous spectra, that is, it may either be a rather young object or a reddened giant/subgiant.
Figure 6 displays the middle portion of the stem. We observed seven fields in this area. The obtained histograms seem to present a kind of transition between the characteristics observed for the B 59 region and the ones for the bowl. That is, Field 15 (one of the fields with ) have a distribution that resembles the ones obtained for the fields in B 59, while very close to it one see Field 16 which shows a distribution with a dispersion typical of the ones presented by fields in the bowl, however, centered around 0°. On the left-hand side of this figure there is Field 22 showing polarization properties with all the characteristics observed in the bowl, that is, low dispersion of polarization angles and centered around 160°. Two of the Forbrich et al. (2009) YSO candidates are located in this area. One of them very close to the center of our Field 17 (source 26), the other one close to the border of Field 18 (source 24). None of these sources were studied by Covey et al. (2010), who on the other hand, investigated two other sources that turned out to be OH/IR stars, likely residing in the Galactic Bulge.
Figure 7 displays the “transition region” between the stem and the bowl, as denoted by the vertical dashed-line. In this area we find two of the three fields presenting broad distribution of polarization angles not belonging to the B 59 vicinity, Fields 26 and 27, the former shows a distribution of polarization vectors that resembles the one observed for Field 06, suggesting that there may be some similarities between the physical properties of both cores, while the distribution for the latter clearly shows a bimodal distribution of polarization vectors. All fields presenting particularly interesting polarization distribution are separately discussed in § 5. The four eastern fields of this area present polarimetric characteristics of the bowl, that is low dispersion of polarization angles, rather high polarization degree and a mean polarization angle centered around 160°. A detail that calls our attention is the polarization probed by Field 20 (upper right corner of the figure). While all other fields shown in this figure present a distribution of polarization angles centered around 160°, the distribution of polarization angles for Field 20 is centered around 30°. This is the second less absorbed field (), so that the polarization mapped by these stars may be mainly caused by a background medium.
The area displayed in Fig. 8 is located to the north of the one displayed in Fig. 7 and covers mostly the more diffuse medium of the Pipe nebula, except for Field 29 with line-of-sight toward a portion with higher extinction. Although this field presents a rather large dispersion of position angles, as compared to the other fields in the bowl, its rather high mean polarization and mean polarization angle centered around 160°, are characteristics of that part of the complex.
Figure 9 displays eleven fields observed in the bowl area. The main characteristics of the fields observed toward this region of the Pipe nebula are the high degree of polarization and the highly aligned polarization vectors, as testified by the low dispersion of polarization angles shown by the histograms displayed on this Figure.
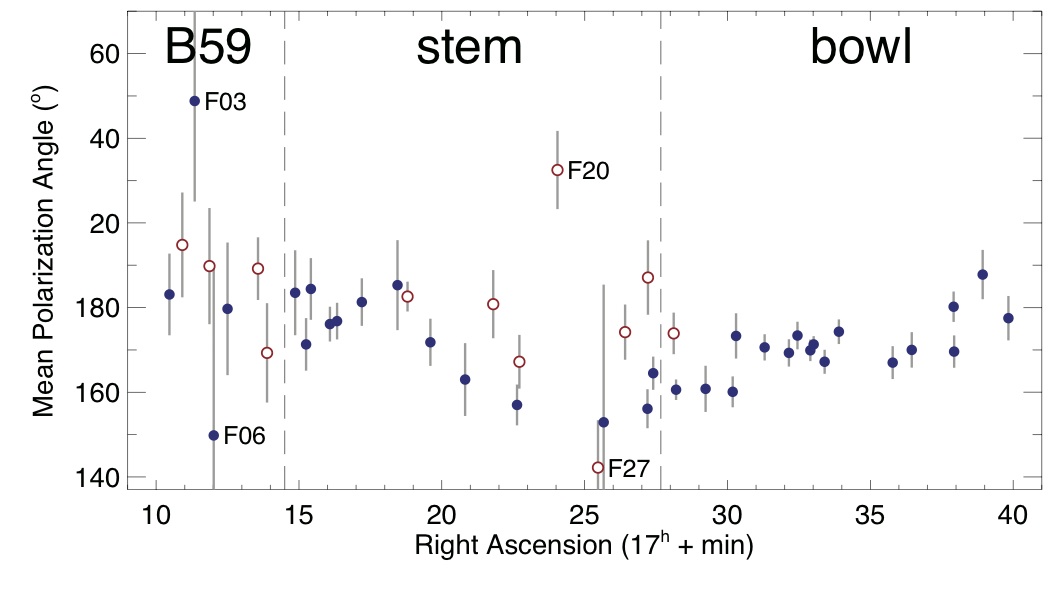
It is also interesting to analyse the distribution of mean polarization angle as a function of the right ascension of the observed fields. Such distribution is shown in Fig. 10, and as already mentioned, due to a fortuitous coincidence this celestial coordinate correlates quite well with the field’s position along the long axis of the Pipe nebula. Most of the obtained mean polarization angles are in the interval , indicating that the local uniform magnetic field is somewhat aligned perpendicularly to the main axis of the cloud complex.
Apart from four fields, identified in Fig. 10, the distribution of the remaining mean polarization position angles seems to follow a pattern. The values obtained for fields toward directions having lower infrared absorption, represented by open dots, present a rather constant value all over the stem of the Pipe, including the B 59 region, except for two of the four mentioned fields (Fields 20 and 27). On the other hand, the distribution shown by fields with rather large infrared absorption, represented by filled dots, is more interesting. Again, apart from the other two identified fields (Fields 03 and 06, both in the B 59 region), which as we have mentioned earlier show some kind of peculiar characteristic, one see that the mean polarization angles for these fields seems to be rather constant () from B 59 to almost the center of the stem, then decrease slowly until close to our arbitrary border of the bowl region, and rise up again by a small value and became almost constant () in the bowl.
This behaviour somehow suggests that the uniform component of the magnetic field is “uniform” in the surrounding diffuse medium but presents small systematic variations along the dense parts of the complex. A remarkable point to be noted is the fact that the right ascension of Fields 20 and 27 somehow coincides with the one where the mean position angle of the fields associated to cores seems to reach its smallest value. Unfortunately our observational data do not allow us to investigate further this coincidence.
3.3. Deriving AV from 2MASS data
It is instructive to compare the obtained mean polarization with the interstellar extinction acting on each observed line-of-sight. The mean extinction in each field could have been estimated by the use of the extinction map obtained by Lombardi et al. (2006). In fact, we started using their image with this purpose, however, as already mentioned, some of the observed fields contain areas of high interstellar absorption that were not probed by our stellar sample. Thus, simply averaging the infrared extinction over the observed field would provide a larger value for the reddening than the one actually probed by our obsereved stars. Because of that, we decided to use another approach, that is, the mean extinction in each field may be determined by assuming that the old bulge population present in each observed volume has an upper giant branch similar to that found in , color magnitude diagrams (CMD) of Baade’s window (see e.g., Frogel et al., 1999). We proceeded assuming that the upper giant branch in each of our observed fields is comparable to and has the same slope as the extinction-corrected template derived by Dutra et al. (2002), given by
| (1) |
This assumption is perfectly justified, because those authors applied this template to study the interstellar reddening in a volume that partially contains the Pipe nebula. We also assumed that the relation between extinction and reddening is given by
| (2) |
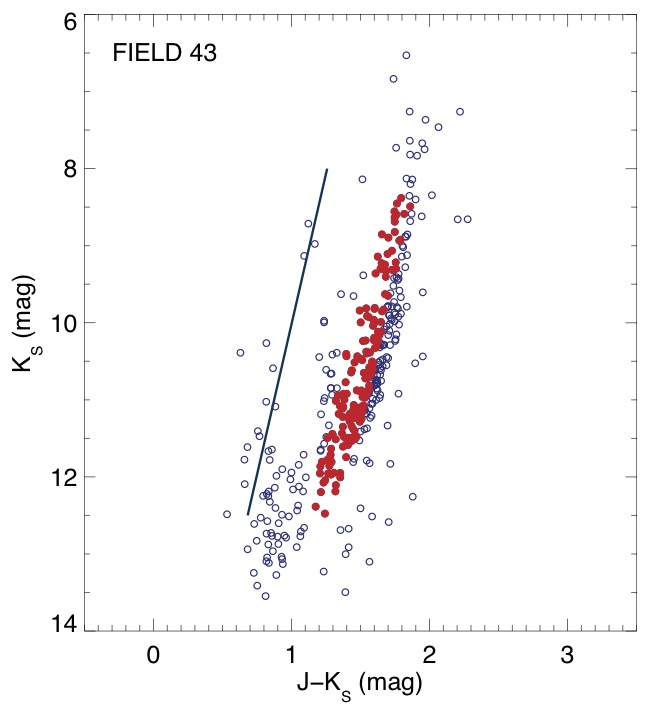
From the CMD values of each star in the field, we calculated the shift along the reddening vector given by Eq. (2) required to make it fall onto the reference upper giant branch, Eq. (1). Since the adopted template appropriately describes the upper giant branch locus for stars with , all star presenting a corrected magnitude outside this range were excluded from our mean absorption estimate, and similarly to what we have done when estimating the mean polarization, a 2- filter was applied to the obtained distribution of and the field’s extinction value was taken as the median of the distribution of stars passing the clipping selection. The estimated mean values were then converted to by the relation derived by Dutra et al. (2002), i.e. . To illustrate the method used to estimate the mean interstellar absorption, we show, in Fig. 11, the CMD obtained for our Field 43. It is clearly noticeable that most stars brighter than , in this field, are reddened by about . Stars used in our estimate of the mean interstellar absorption are represented, in Fig. 11, by filled circles. In general, an analysis of the (, ) color indices shows that most of the stars fainter than in our diagrams are likely to be main-sequence stars of earlier types (typically B–G).
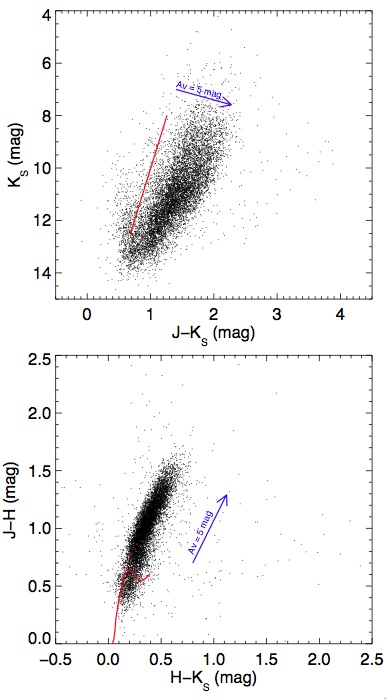
The top-panel of Fig. 12 shows the obtained CMD for all observed star, in our sample, with and identified in the 2MASS catalogue. For comparison, the diagram for the same stars is given in the bottom-panel. As one can see, most of the observed stars seems to occupy the area corresponding to normal reddened stars. The stars in this zone could also be dereddened onto intrinsic color lines by extrapolation from the observed stellar locus along the appropriate reddening vector.
The obtained values of and their estimated uncertainties are given respectively in columns 14 and 15 of Table 3. The later were estimated from the standard deviation of the obtained distribution of , before applying the 2- filter, being that the stellar photometric errors have not been taken into account.
Although the extinction can reach very high values toward some of the observed cores, one see in Table 3 that, as expected, our optical polarimetric survey is probing the less absorbed areas only (e.g., from to ). It is important to note that although Román-Zúñiga et al. (2007) found evidences that the extinction law prevailing in the densest regions of B 59 agrees more closely with a dust extinction with a total to selective absorption we adopted the typical values for the diffuse interstellar medium, since we are studying regions with extinctions well below .
As an independent control of the method used to evaluate the interstellar absorption towards the observed areas, one may compare the results obtained for our example field, Field 43, with the ones we would have obtained from the extinction map produced by Lombardi et al. (2006). As one may verify from visual inspection of Fig. 9, our stellar sample covers rather uniformly the area defined by Field 43 which means that, simply averaging the Lombardi et al. extinction over this area will probably yield values that are representative of the mean extinction probed by the observed stars. Such procedure give us , which agrees quite well with the value given in Table 3.
4. Polarizing efficiency toward the Pipe nebula
The degree of polarization produced for a given amount of extinction is referred to as the polarization efficiency of the intervening dust grains. This efficiency of polarization depends on both the nature of the grains and the efficiency with which they are aligned in the line-of-sight. The most efficient polarization medium conceivable is obtained by modeling the dust grains as infinite cylinders (very long in comparison to their radii) with diameters comparable to the wavelength, perfectly aligned with their long axes parallel to one another and perpendicular to the line of sight. For such a model, Mie calculations for particles with dielectric optical properties, place a theoretical upper limit on the polarization efficiency of the grains due to directional extinction at visual wavelengths of % mag-1 (see, for instance, Whittet, 2003). The observations, however, show that the upper limit predicted by this very idealized scenario is far from being reached. In general, studies of interstellar polarization demonstrate that the efficiency of the real Galactic interstellar dust as a polarizing medium is more than a factor of 4 less than predicted for the ideal polarizing medium. The observational upper limit on the ratio of polarization to extinction for the diffuse interstellar medium is given by % mag-1 (Serkowski et al., 1975).
Considering that our sample contains a rather large number of objects, in the bowl region, showing outstanding degrees of polarization, it is natural that we try to investigate if these observed areas present unusual polarimetric properties as compared to the common Galactic interstellar medium.
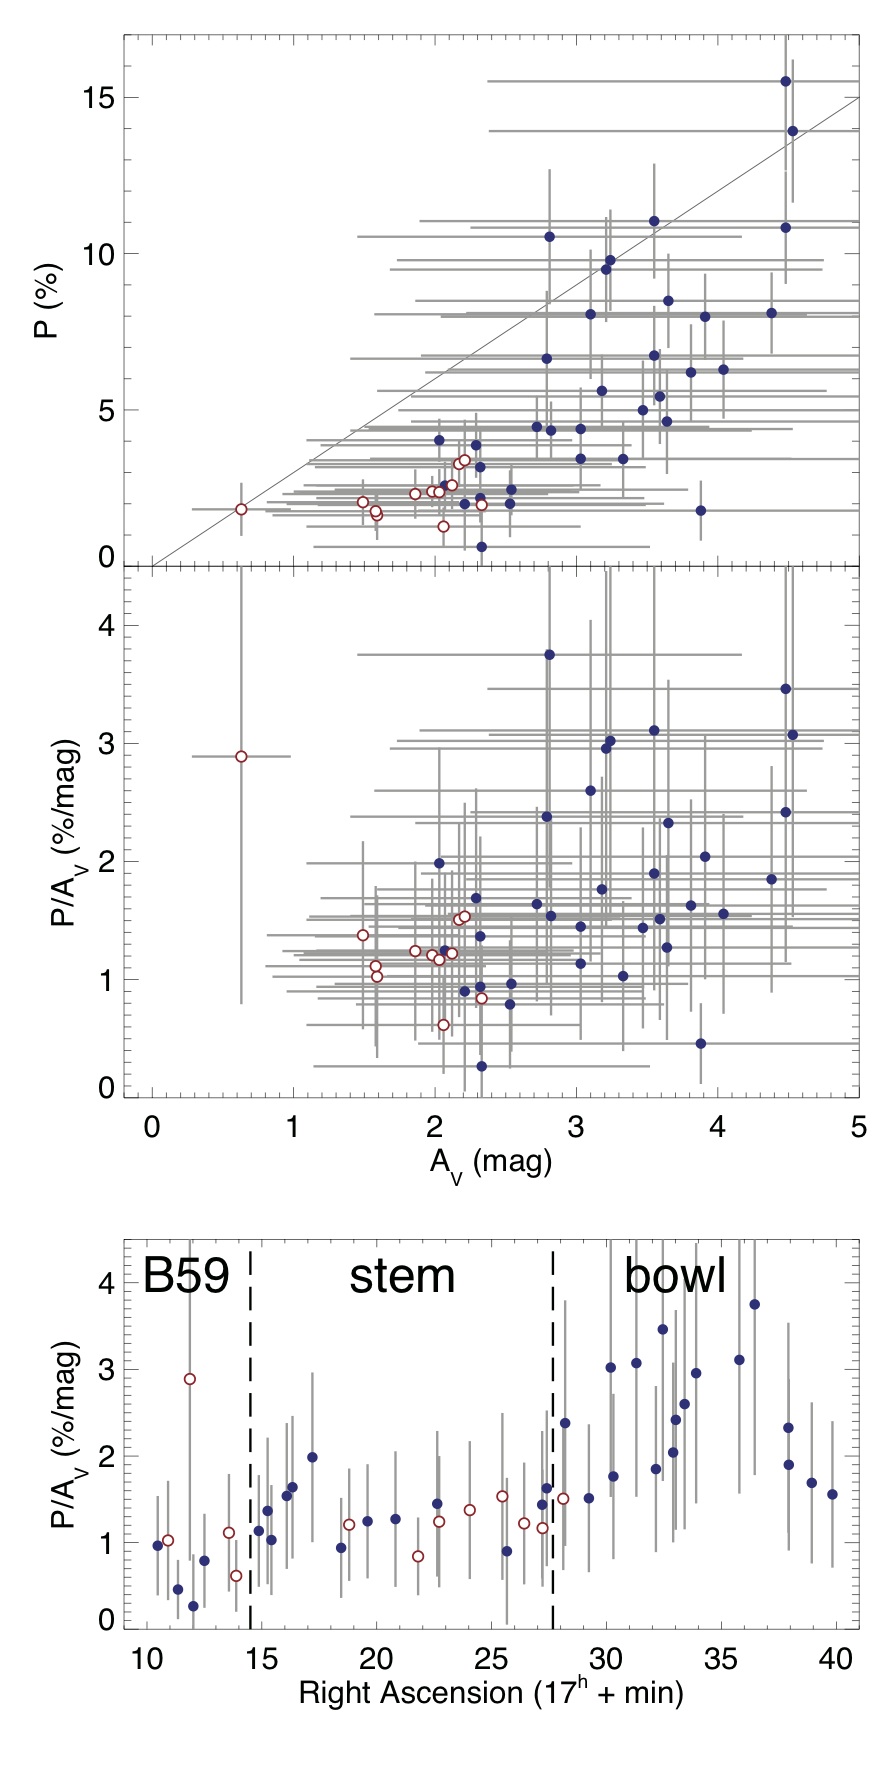
The diagrams shown in Fig. 13 were constructed in order to investigate the obtained ratio between our estimated mean degree of polarization and mean total interstellar absorption for the observed fields toward the Pipe nebula — error bars were omitted in these diagrams for the sake of clarity. The plot of mean polarization versus total visual absorption given in the Fig. 13 (top panel) shows that basically all data points lie on or below the line representing the usual relation % mag-1 — the two points appearing above this line represent data obtained for Fields 38 and 41, however, taking into account the estimated 1- uncertainties for the mean degree of polarization and total interstellar absorption, these two fields may also obey the above relationship. On the one hand, this result indicates that the interstellar material composing the Pipe nebula follows the usual behaviour of the common diffuse interstellar medium. On the other hand, as one can see from the values tabulated in Table 3 we have found levels of mean degree of polarization that are unusual for the same interstellar material.
Several previous investigations have suggested that the polarizing efficiency of the interstellar dust declines systematically with total extinction, as one probes progressively denser environments within a dark cloud (e.g., Goodman et al., 1992, 1995; Gerakines et al., 1995). The obtained diagram of polarizing efficiency, , as a function of the interstellar absorption (Fig. 13 – middle panel), does not show clearly this tendency, at least not for the covered interval of interstellar absorption. In fact, on the contrary, if we exclude Field 02, which shows the lowest interstellar absorption and a polarization efficiency of almost 3 % mag-1, the other fields show a tendency of increasing efficiency with the interstellar absorption.
More interestingly is the diagram shown in the bottom panel of Fig. 13, which shows the distribution of the estimated polarization efficiency of the observed fields as a function of their position along the long axis of the Pipe nebula. It is known that variations in polarization efficiency might result from changes in physical conditions that affect alignment efficiency, such as temperature, density and magnetic field strength, or in grain properties such as their shape and size distribution and the presence or absence of surface coatings. Most of the observed fields in the stem (including its tip — the B 59 region), present a polarization efficiency around % mag-1, then it rises up and down when one move along the bowl from west to east, reaching values of about % mag-1. Summarizing, although showing an interesting behaviour, the global properties of the probed dust material composing the Pipe nebula does not seem to present any special peculiarity, when compared to the common diffuse interstellar medium, that could explain the observed high degrees of polarization. However, one notice a clear difference between the behaviour shown by the polarimetric properties presented by fields located in the stem and in the bowl.
Although the division between the regions denominated B 59 and stem was chosen rather arbitrarily (in Paper I, it is characterized by a rising on the degree of polarization), one notice an interesting feature in the bottom panel of Fig. 13. The polarization efficiency seems to increase along the dust filaments probed by our sample when we move from the B 59 region to the stem. It happens only for the fields of the stem shown in Fig. 5, after that, the ratio returns to the typical value of 1 % mag-1 observed for B 59 and the remaining fields in the stem. This behaviour can be an indication that distinct physical regimes may be acting on different fragments of the stem. For instance, variations of the value of may arise where the local magnetic field is not orthogonal to or its direction varies along the line-of-sight, or where the processes responsible for grain alignment change for some reason (grain composition, size, shape, etc). The interested reader will find a good review on the efficiency of grain alignment in the work by Whittet et al. (2008, and references therein). It is worthwhile to mention that the point where the polarization efficiency returns to its typical value of 1 % mag-1 almost coincides with the place where one noticed the value of the mean polarization angles started decrease (see Fig. 10).
All these results reinforce once more how interesting is the Pipe nebula and suggest that this complex may be a testbed for different theories of dust grain alignment efficiency.
5. Fields showing interesting polarization distributions
Inspection of Figs. 5 to 9 shows that some of the observed fields present remarkable polarization geometries. For many of them one clearly note that the obtained polarization angles for the objects in the field suggest a multicomponent, or in some cases a hoop-like, distribution. As one have seen, in most cases the mean polarization vector is aligned perpendicularly to the long axis of the Pipe nebula, but there is the case of Field 20 (see Fig. 10) where the distribution of polarization angles does not follow the average behaviour for the region. Below we introduce three of the most interesting observed fields, and comment on the fields having high mean polarization ().
5.1. Field 06
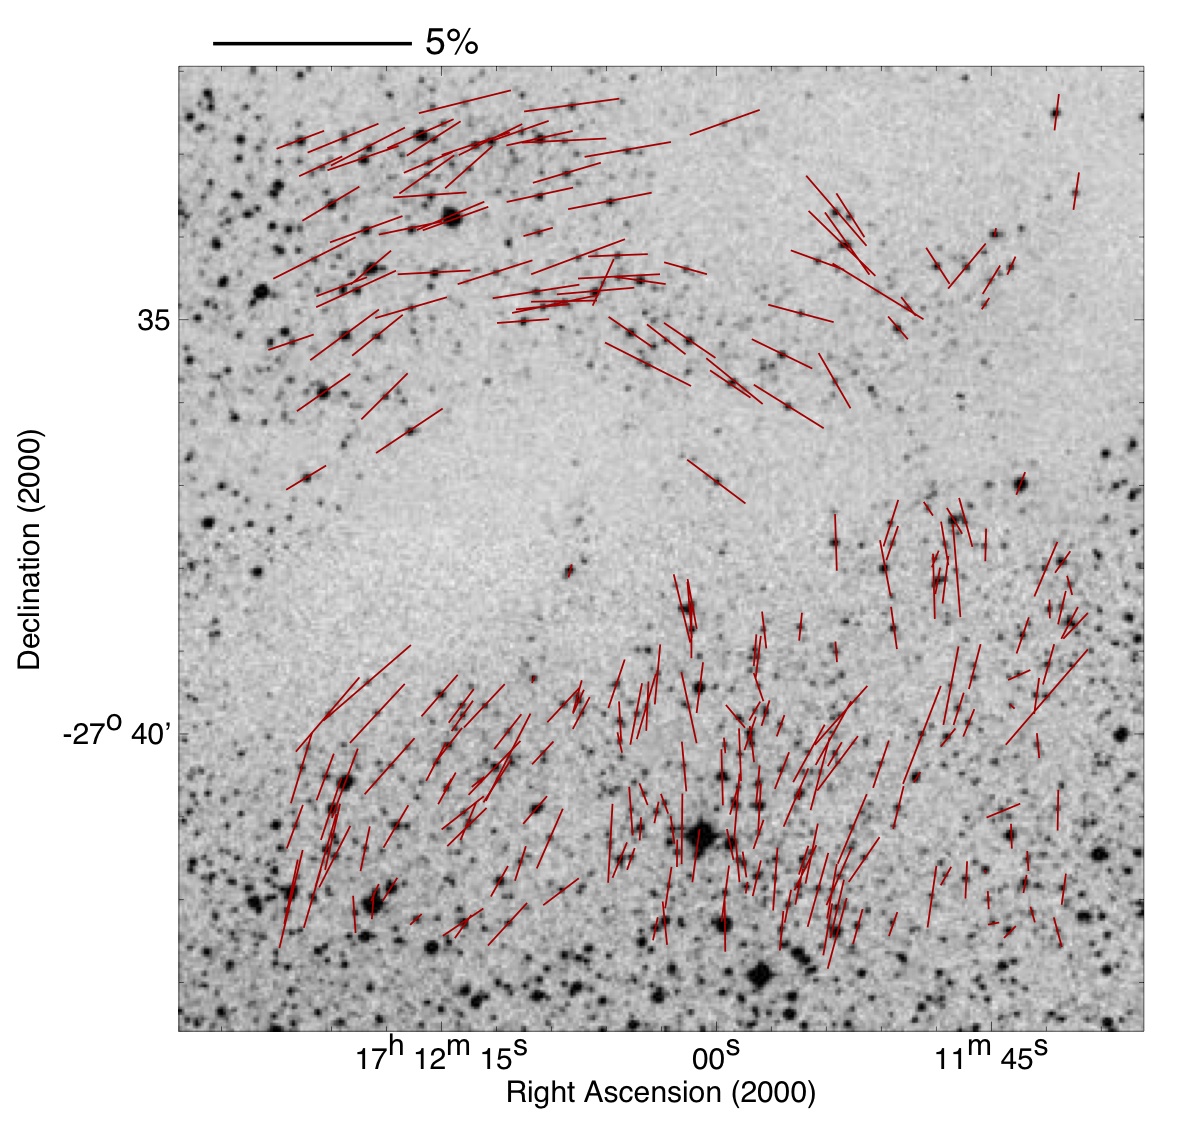
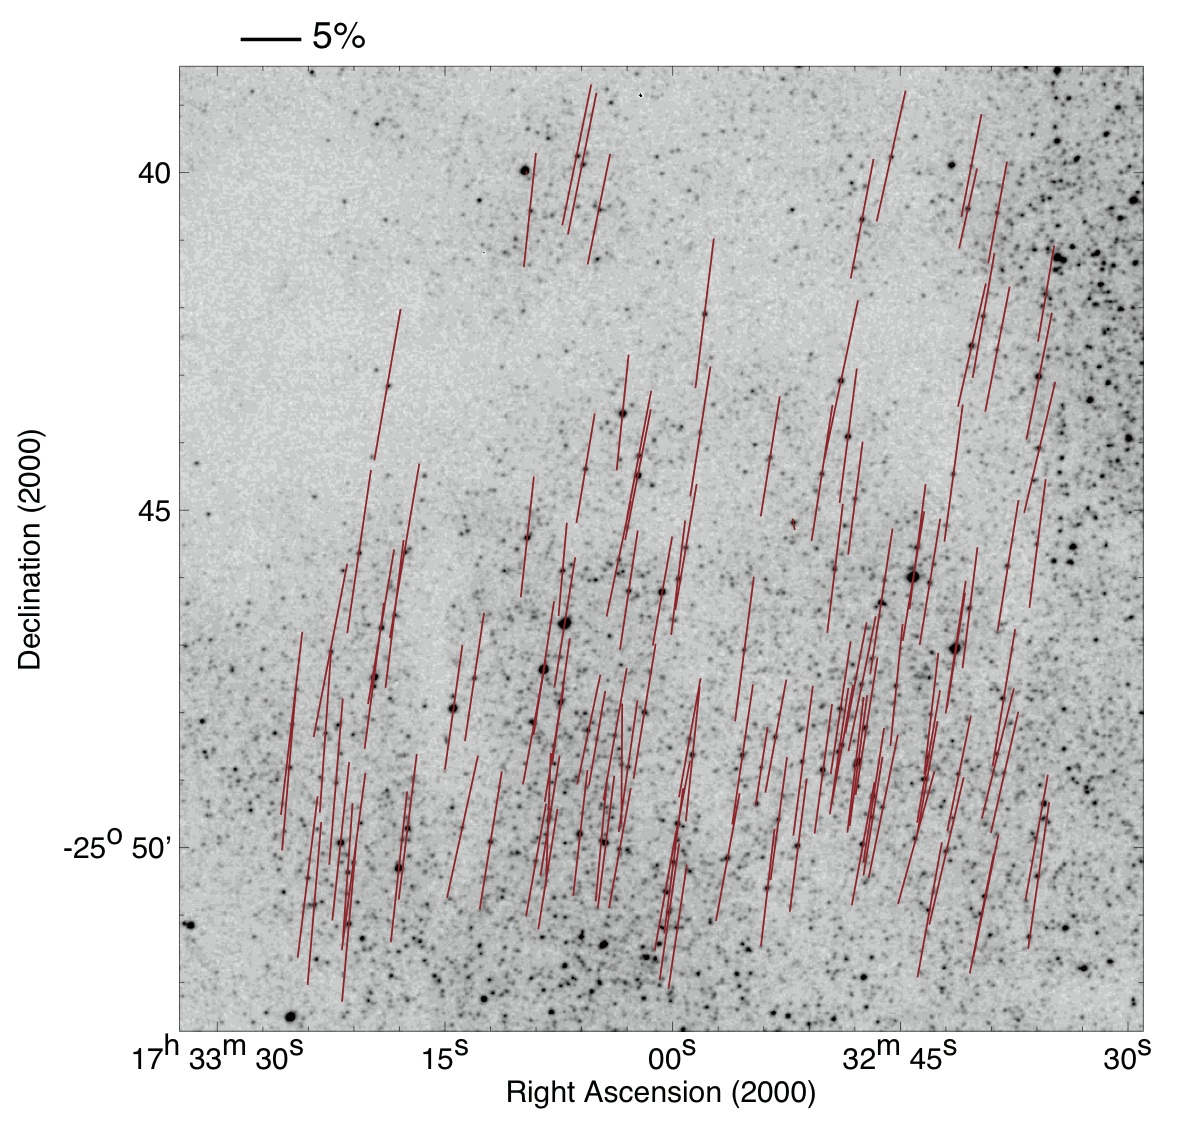
The polarization map for Field 06 is shown in Fig. 14, one of the most interesting distribution in our survey. This is one of the four fields we have identified in Fig. 10 as having a mean polarization angle which seems to disagree from the pattern observed for the cloud complex. In order to emphasize the geometry of the magnetic field in this region, all star for which polarization has been measured are represented in the map. The polarization vectors seem to suggest that the local magnetic field follows the border of the dust cloud evidenced by the higher interstellar absorption noticed to the left of the center. Has this core been modeled by the field or, on the contrary, was the field shaped by the core? In any case, this seems to be an interesting region which deserves further investigation.
5.2. Field 26
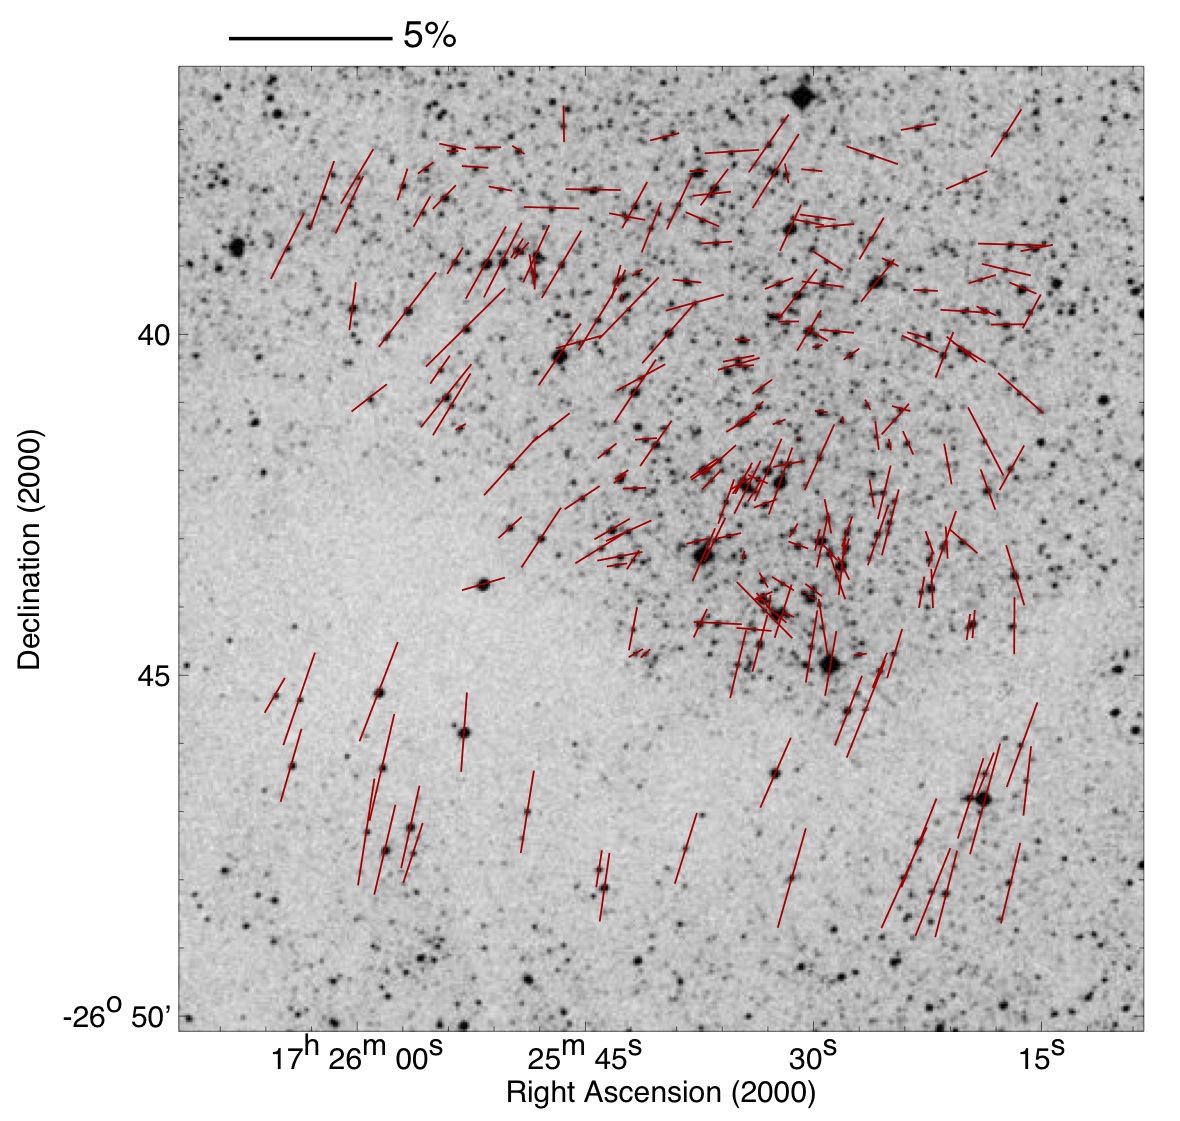
The polarization map obtained for Field 26, Fig. 15, seems to be the result of a mixture of two distributions, a main component centered around 160° (see also the histogram introduced in Fig. 7), combined with an hoop-like component. An interesting point is that, as one may observe in the polarization map, the surveyed area seems to show different characteristics toward directions located northern and southern of the densest parts of the cloud — visually characterized by the absence of stars. Apparently, at the south only the main component of the distribution () is present, while at the north we observe the presence of both distributions. An inspection of Fig. 7 shows that the northern part of this field probes a more diffuse part of the interstellar material, as what happens in the case of Field 27 (see below), while the southern stars have line-of-sight toward a volume presenting higher extinction. One of the cores studied by Frau et al. (2010), who used the IRAM 30-m telescope to carry out a continuum and molecular survey toward four of the starless cores from the list of Alves et al. (2007), is Core 48, which is associated to the higher interstellar absorption shown in Fig. 15. The radio data indicates that, although being very diffuse, this core has a strong dust emission, and their molecular analysis suggests that chemically it seems to be in a very early stage of evolution.
5.3. Field 27
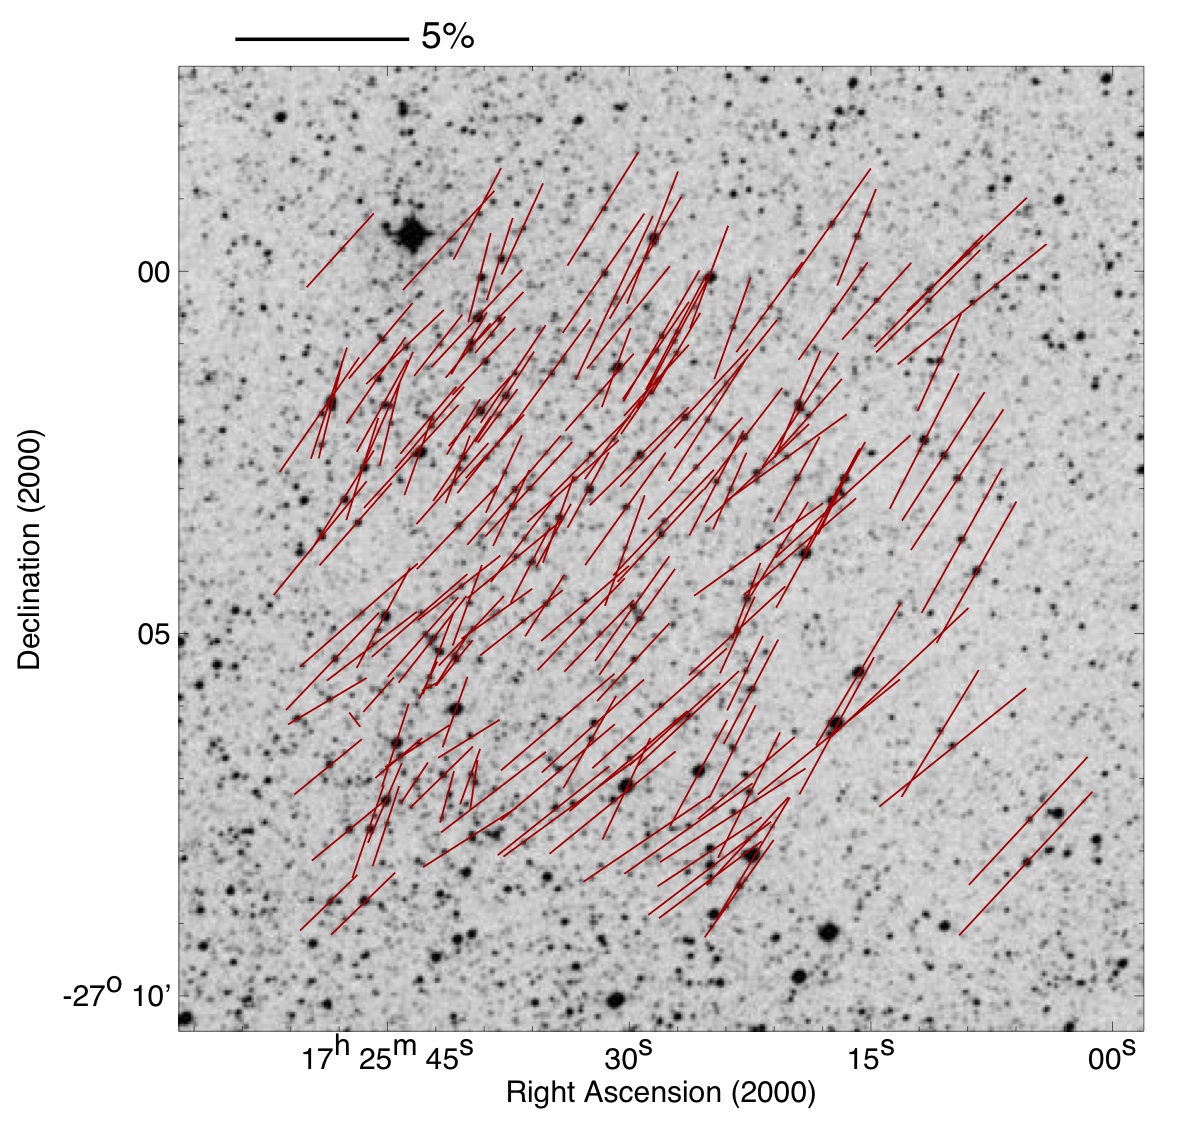
There is no dense core associated to the volume probed by this field, and it is other of the fields having mean polarization angle not fitting in the main pattern of mean position angles, as defined in Fig. 10. The distribution of polarization vectors shown in Fig. 16 (see also the histrogram of polarization angles shown in Fig. 7) clearly shows a bimodal distribution with mean angles values centered on 135° and 155°. Both components seem to be well distributed all over the surveyed field.
5.4. Distribution of polarization and position angles as function of the 2MASS magnitude for Fields 26 and 27
The top panels of Fig. 17 display the measured polarization angles as function of the 2MASS magnitude for Fields 26 and 27. An interesting result comes out from these diagrams. One clearly notice that the distribution shown by Field 27 (right panel) is rather defined by the stellar magnitude and occupies different regions of the diagram. Stars having , that is statistically populated by main sequence stars, as already mentioned in § 3.3, are mainly associated to the component having higher mean angle, while stars having , statistically populated by giant stars, are basically associated to the component having lower mean angle. This is indicated by the horizontal and vertical dashed lines positioned at and , respectively.
The distribution presented by Field 26 is rather different but shows some of the characteristics presented by Field 27. For the sake of comparison, we have represented the same horizontal and vertical dashed lines in both diagrams. While the polarization angles observed for Field 27 are restricted between and 170°, Field 26 presents basically all values of polarization angles. However, as observed for Field 27, most of the stars in Field 26 fainter than has polarization angle larger than 140-150°, suggesting that the same kind of interstellar structures may be present toward both line-of-sights, which are separated about 20′ from each other.
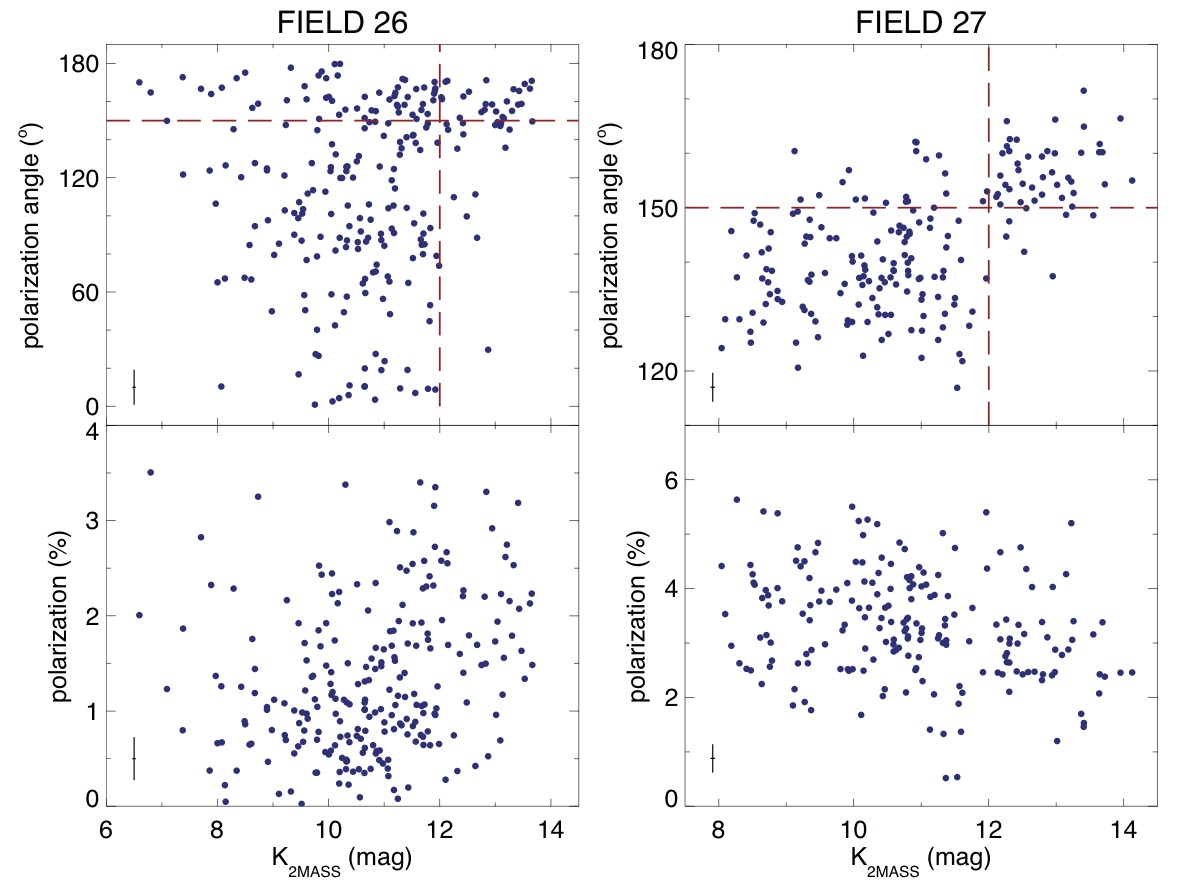
It is also interesting to compare the distribution of degree of polarization as a function of the stellar magnitude (bottom panels). First of all, one notices that although Fig. 7 seems to indicate that the line-of-sight toward Field 27 is less affected by interstellar absorption than Field 26, the measured polarization for the latter is generally smaller than the one obtained for stars in the former field — it must be noted, however, that the estimated average interstellar absorption in § 3.3 is essentially the same for both fields (see Table 3). The CMD for the observed stars in Field 27 suggests that the interstellar absorption toward this line-of-sight is rather more uniform than the one probed by stars in Field 26, as one should expect from the dust extinction map obtained by Lombardi et al. (2006) and shown in detail by our Fig. 7. Thus, the estimated average interstellar absorption for Field 27 is more representative of what we have all over the surveyed volume, while the one estimated for Field 26 is a mean between regions showing rather high absorptions, e.g. toward the southern area of the CCD field, with regions not so absorbed probed by the stars located in the northern area of the CCD field.
5.5. Comments on the Fields with high mean polarization degree
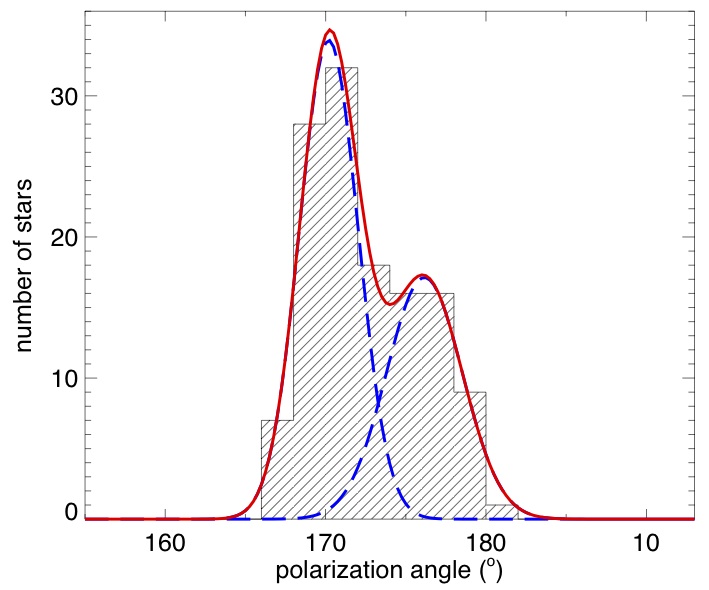
Five of the observed fields present mean degree of polarization , they all lay in the bowl and are Fields 35, 37, 38, 40, and 41. In Fig. 9 these fields are almost aligned along the diagonal crossing the image from the upper left-hand to the lower right-hand corner. The main characteristics of these fields, apart from the high value of observed polarization degree, is the very low dispersion of polarization angles, which suggests that the turbulent energy prevailing on the observed cores must be quite low (see § 6). In particular, it is noticeable the quite low dispersion presented by Field 35 (see also Fig. 18), the lowest in our survey, with a rather “normal” distribution.
Although also presenting a very low dispersion, Field 38, the one with the highest mean polarization in our survey, shows a fairly asymmetry in the observed distribution of polarization angles. As shown in Fig. 19, it may be caused by two dust cloud components along the observed line-of-sight, each one subject to slightly different orientations of ambient magnetic fields. These clouds may be associated to the two main velocity components that seem to characterize the kinematics of the ‘bowl” (e.g., Muench et al., 2007), even though they have not detected two C18O components toward their observed line-of-sight through this field.
The distribution of polarization angles as a function of the 2MASS magnitudes does not present any remarkable feature, unless for the fact that the 6 brightest stars in the field () have polarization angles between 169° and 1725, while the remaining stars present a rather normal distribution between and 180°.
Field 40 contains other of the cores observed by Frau et al. (2010), Core 109. The radio data show that this object presents a strong dust continuum emission, is the densest among the four investigated cores, and one of the most massive. The interstellar extinction experienced by the observed stars is very nonuniform, ranging from to . Interestingly the observed 13CO molecular emission shows a double velocity component (Alves et al., in preparation), which is not seen in C18O (Muench et al., 2007, ratified by the work in preparation by Alves et al.), and could explain the asymmetry of the distribution of polarization angles which, as observed for Field 38, is also noticed for this field but this time due to a small excess in the left wing of the distribution (see distribution introduced in Fig. 9). Analyzing the distribution of the polarization angles as function of the 2MASS magnitudes one obtained that this excess is due to stars brighter than , which are in average more affected by the interstellar absorption and present higher mean degree of polarization. Although located in the bowl, supposed to be the less evolved region of the Pipe nebula, the molecular investigation conducted by Frau et al. (2010) indicated that the core may be one of the chemically most evolved in their molecular survey.
6. The Structure Function of the polarization angles in the Pipe nebula
6.1. Basic definitions
The second–order structure function (hereafter ) of the polarization angles, , is defined as the average of the squared difference between the polarization angles measured for all pair of points separated by a distance (e.g. see equation 5 of Falceta-Gonçalves et al. 2008). Thus, the give information on the behavior of the dispersion of the polarization angles as a function of the length scale in molecular clouds. Recently, it has been used as a powerful statistical tool to infer information of the relationship between the large-scale and the turbulent components of the magnetic field in molecular clouds (Falceta-Gonçalves et al., 2008; Hildebrand et al., 2009; Houde et al., 2009). Given the large statistical sample of the polarization data in the Pipe nebula, it is interesting to compute the along the Pipe nebula to scales up to few parsecs. For a qualitatively discussion we will first use the square root of , also called the angular dispersion function or (Poidevin et al., 2010). The use of the instead of the allows a more straightforward comparison of the behavior of position angle dispersion as a function of the length scale. Then, we use the to compare our statistical sample with the previous works (Falceta-Gonçalves et al., 2008; Houde et al., 2009).
6.2. Qualitative analysis
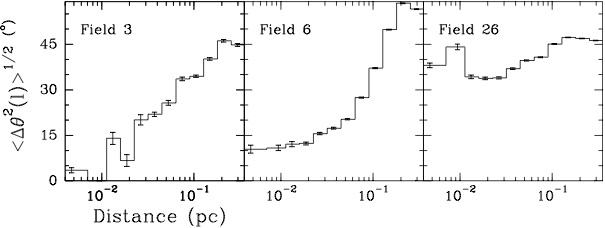
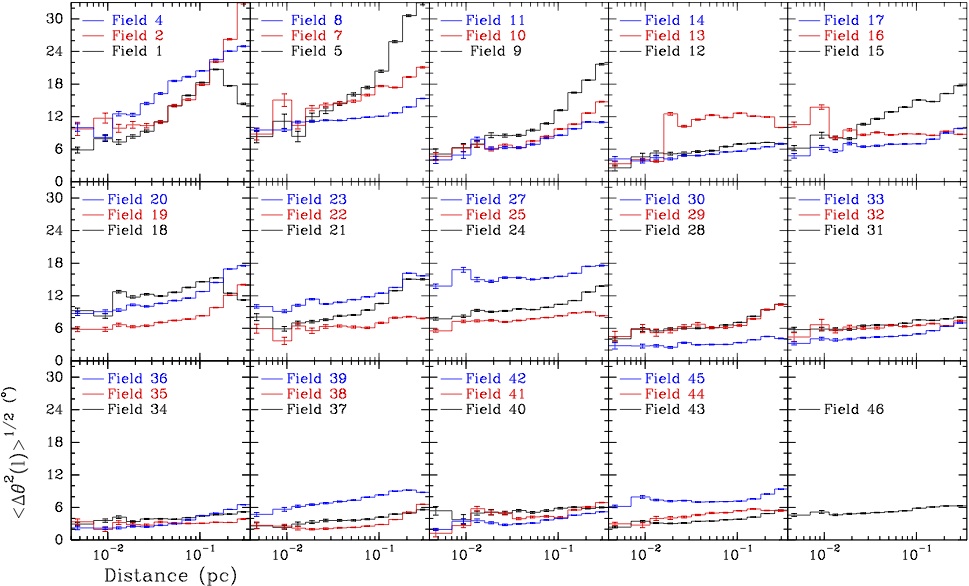
We have first computed the for all the individual fields using a logarithmic scale between (5.6 mpc) and (0.35 pc). This range was selected in order to have a good statistical sample. Figure 20 shows the for all the Fields but 3, 6, 26. These three fields, which are the ones that exhibit the highest polarization angle dispersion (see Table 3), are shown separately in Fig. 21. There is a clear trend in the distribution of the along the Pipe nebula (see Fig. 20). On one hand, fields in B 59 (1–8) not only show a higher polarization angle dispersion at all the observed scales but the slope is the highest. A steep slope is an indication that the large-scale magnetic field orientation in the plane of the sky changes significantly. Fields 3 and 6 have dispersion values at scales larger than pc close to the expected maximum dispersion that would be obtained in case of a purely random polarization angle distribution, , (Poidevin et al., 2010). As pointed in § 5.1 for Field 6 this is due to a strongly distorted field surrounding a core. On the other hand, all the Fields in the bowl (28–46) not only have a remarkably small dispersion of the position angles (Alves et al., 2008) but this trend is also observed in the at all the observed scales. Indeed and in contrast with B 59, the almost flat slope of the in the bowl Fields indicate that the projected magnetic field in the plane of the sky is very uniform. The behavior of the stem Fields is intermediate between that of B 59 and the bowl. However, the global properties of field 26 differ from the general trend found in the stem: it shows an unusual high dispersion, at all scales. Compared with other Fields with also a high dispersion (e.g. 3 and 6) the slope of Field 26 is relatively flat. Field 27, the one with a bimodal distribution (see § 5.3), shows a similar behavior to Field 26 but a smaller level: at all scales. Because of the peculiarities of these two Fields, we treat them as a distinctive region in the Pipe nebula for the analysis. Here on, we call this region as the “stem–bowl border”. We also include Field 20 in this region because its average mean direction is quite different from the ones of the rest of the stem (see Fig. 10) and it is relatively near to Fields 26 and 27.
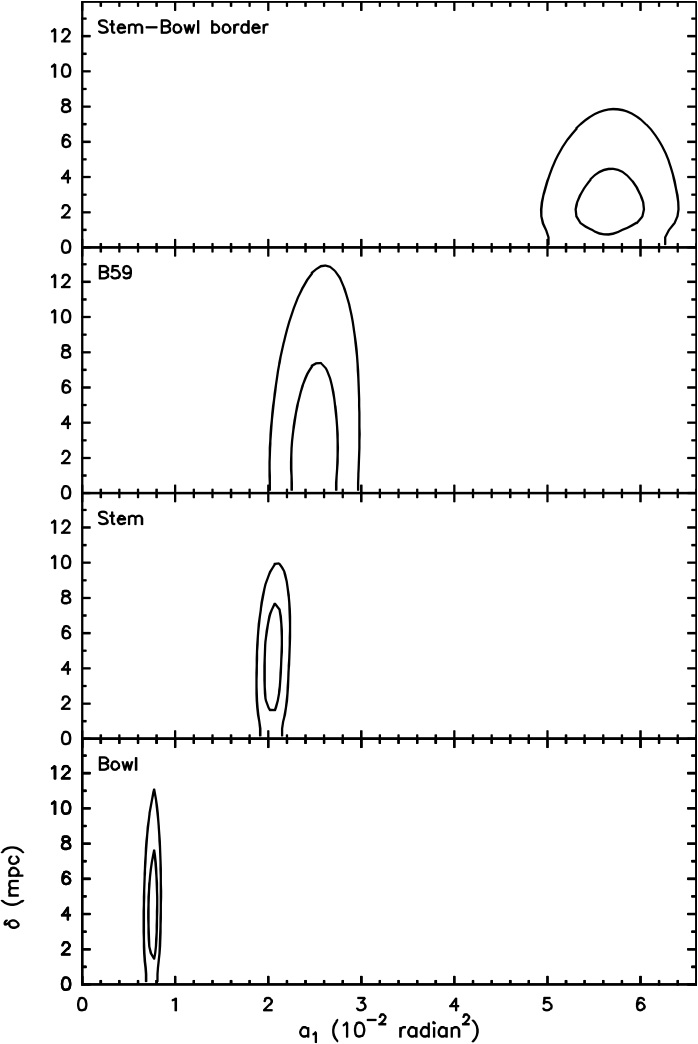
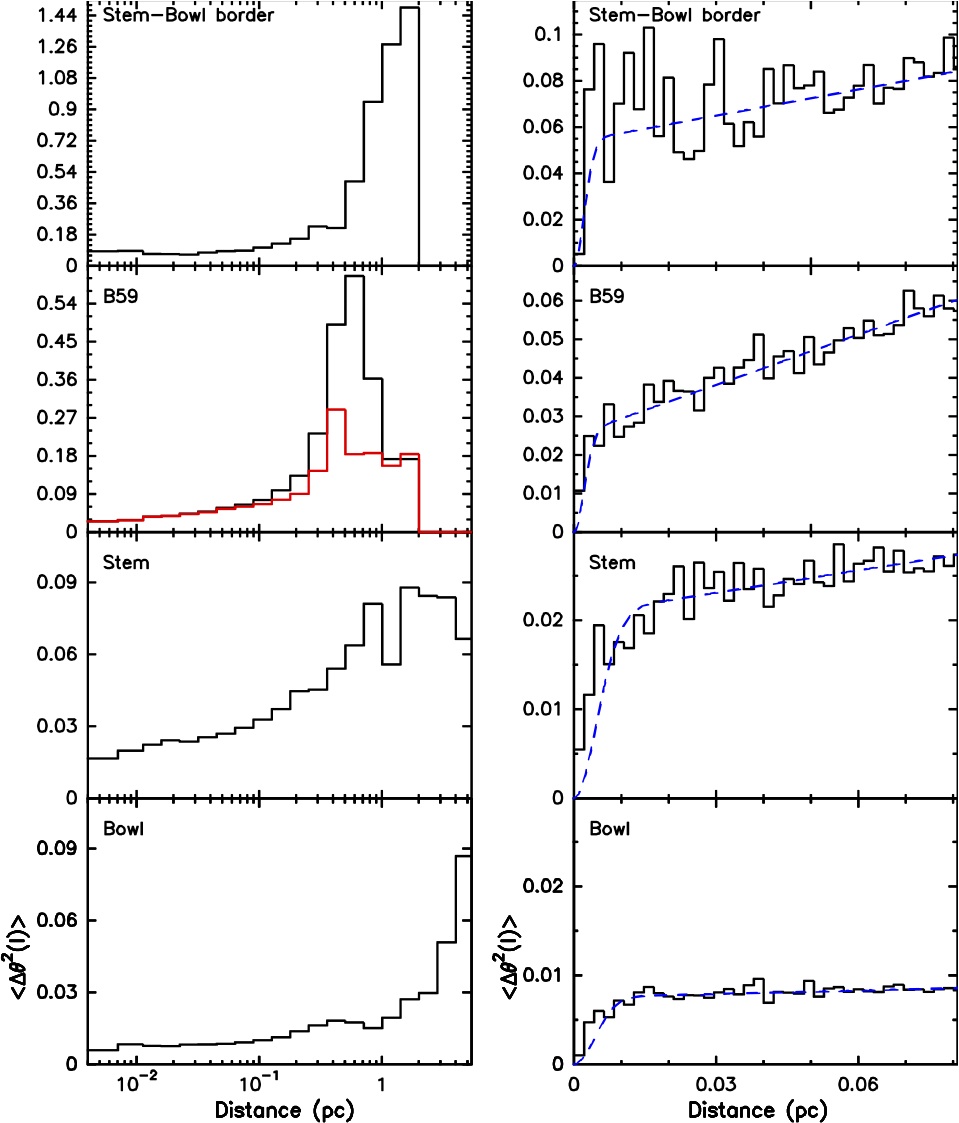
Figure 22 shows the for the four distinctive regions within the Pipe nebula: B 59, the stem (except Fields 20, 26 and 27), the bowl and the stem–bowl border. By combining the different fields of each region, the can be computed at larger scales, up to few parsecs (see left panels of Fig. 22). The general trend described in the previous paragraph for the also applies for the . For example, it is remarkable that the bowl shows very low values up to scales of few parsecs, with position angle dispersion lower than . Yet, B 59 and the “stem–bowl border” show an abrupt increase of the at scales larger than 0.3–0.5 pc. For B 59 this is due to the high PA dispersion Fields 3 and 6. Indeed, if these two fields are excluded, the resulting is smoother at these scales.
6.3. Comparison with Houde et al. (2009)
| Region | ()aaEstimated for (see text). | Fields | |||
|---|---|---|---|---|---|
| () | (radian2) | (mpc) | |||
| B 59 | 0.44 | 0.025 | 2.1 | 0.4 | 1–8 |
| stem | 0.08 | 0.021 | 4.8 | 0.2 | 9–19,21–25 |
| stem–bowl | 0.38 | 0.054 | 0.8 | 20,26,27 | |
| bowl | 0.01 | 0.008 | 4.4 | 0.1 | 28–46 |
The larger statistics obtained by dividing the Pipe in four region also allows to better sample the smaller scales. The right panels of Fig. 22 show that at scales of few hundredths of a parsec the increases linearly with length scale. Yet, at scales of pc, the drops fast when approaching to the zero length scale. This is a clear indication that we are starting to resolve the correlation length scale for the turbulent magnetic field component, which is the scale at which the turbulent energy is dissipated. In order to approximately estimate the turbulent length scale we follow the recipe given in the detailed analysis carried out by Houde et al. (2009), where they assumed a Gaussian form for the autocorrelation function for the turbulence. We use equation 44 from Houde et al. (2009) taking into account that the effective angular resolution of the optical polarization data can be considered zero. Therefore, in that equation the angular resolution term is . Thus, equation 44 from Houde et al. (2009) can be rewritten as:
| (3) |
The first term, , gives the large-scale magnetic contribution to the (note that we have adopted a linear dependence instead of the original dependence of the aforementioned Eq. 44). The second term corresponds to the turbulent contribution to the . is the turbulent length scale and is a function of the large–scale magnetic field strength, , the turbulent component of the magnetic field, , and of , the number of turbulent correlation lengths along the line of sight333Note that this term is equivalent to number of the magnetic field correlation length along the line of sight introduced by Myers & Goodman (1991):
| (4) |
can also be understood as the number of independent turbulent cells along the line of sight (Houde et al., 2009). We have used equation 3 to fit the data in the four Pipe regions for the scale range shown in the right panels of Fig. 22. These are the scales in which the large-scale magnetic field contribution to the is basically linear. For each of the four Pipe regions a analysis was carried out to find the best set of solutions for the free parameters , and . The best-fit solutions obtained are given in Table 4 and the 99% and 67% confidence intervals for and are shown in Fig. 23. The dashed blue line in the right panels of Fig. 22 show the best solution for each region. We find that the turbulent correlation length, , is in all cases of few milliparsecs. Given that the assumption of the Gaussian form for the turbulence autocorrelation function is not correct, the found values should be taken as an approximation. In any case, the right panels of Fig. 22 show that the turbulent correlation length should be pc. Indeed, at the 99% confidence level the analysis provides an upper limit for of mpc (see Fig. 23). This upper limit is slightly lower that the found for OMC-1, 16 mpc, from submm polarization observations (Houde et al., 2009).
From Eq. 4 we can estimate the turbulent to magnetic energy ratio, , if the number of independent turbulent cells, , is known. For optical polarization data, the number of independent turbulent cells is (Houde et al., 2009), where is the cloud thickness. , where and are the column and volume densities of the molecular gas traced by the optical polarization data. can be obtained from the typical visual extinction of the observed fields. The average visual extinction for the bowl is 3.6 mag, whereas for the rest of the regions is 2.1 mag. Using the standard conversion to column density (Wagenblast & Hartquist, 1989), these values yields to and cm-2 for the bowl and for the rest of the regions, respectively. For the observed fields, Paper I estimated that the volume density of the gas associated with the optical polarization is cm-3. Therefore, the cloud thickness of 0.5 pc for the bowl and of 0.3 pc for the rest of the regions. With these values and using for the range at the 67% confidence interval (see Fig. 23) we obtain that ranges between 25 and 100 for the bowl and 15 to 60 for the rest of the regions. Nevertheless, a high value of will also reduce significantly the observed polarization level. But all the bowl fields and many of the stem fields have polarization levels of 4–15% and 3–4%, respectively. Therefore, it is unlikely the case of a high , at least, for these two regions. Indeed, Myers & Goodman (1991) estimated that for optical polarization observations is expected to not be larger than . Houde et al. (2009) found for OMC-1 from submm dust polarization observations that trace significantly larger column densities. Therefore, we tentatively adopt a relatively high value of . For this case, the magnetic field appears to be energetically dominant with respect to turbulence in the Pipe nebula except for the “stem–bowl border”, where magnetic and turbulence energy appear to be in equipartition (see Table 4).
6.4. Comparison with Falceta-Gonçalves et al. (2008)
Falceta-Gonçalves et al. (2008) carried out simulation of turbulent and magnetized molecular clouds computing the effect on the dust polarization vectors in the plane-of-the-sky for cases with super-Alfvénic and sub-Alfvénic turbulence (i.e., clouds energetically dominated by turbulence and magnetic fields, respectively). They computed the derived from dust polarized emission as well as from optical polarization using background stars for the different sub and super-Alfvénic cases, and for different angles of the magnetic field with respect to the line of sight (see Figs. 6 and 11 of this paper). The SF for super-Alfvénic turbulence is clearly higher than the one for sub-Alfvénic turbulence: The ranges from 0.4 at the smallest scales up to to the highest scales (see central panel of Fig. 6 from Falceta-Gonçalves et al. 2008). For the case of sub-Alfvénic turbulence such a high values of the are reached only in the cases where the magnetic field direction is close to the line of sight. For the other cases of sub-Alfvénic turbulence, . Comparing the obtained in the four Pipe nebula regions (Fig. 22) with the results of Falceta-Gonçalves et al. (2008) it is clear that B 59, the stem, and the bowl are compatible with the presence of sub-Alfvénic turbulence. The behavior of the for the stem–bowl border ( from 0.1 at the smallest scale to at the larger scales) may indicate the case of sub-Alfvénic turbulence with a magnetic field near the line of sight rather than super-Alfvénic turbulence. Indeed, the only individual field in the Pipe nebula that at all scales have a compatible with the super-Alfvénic turbulence is Field 26.
6.5. Summary of the analysis
The comparison of the derived from our optical polarization data with the ones derived in the works by Houde et al. (2009) and Falceta-Gonçalves et al. (2008), indicated that the Pipe nebula is a magnetically dominated molecular cloud complex and that the turbulence appears to be sub-Alfvénic. Only the region we call the stem–bowl border, in particular Field 26, appears to have a behavior that is compatible with super-Alfvénic turbulence. A similar situation seems to apply to the well investigated low mass star forming region in the Taurus complex where there is evidence for a molecular gas substrate with sub-Alfvénic turbulence and magnetically subcritical (Heyer et al., 2008; Nakamura & Li, 2008). Hily-Blant & Falgarone (2007) also found that in Taurus, the magnetic fields are dynamical important, although they found that they are trans-Alfvénic. In addition, analyzing the polarization angles at different scales using optical and submm observations in several molecular cloud yield Li et al. (2009) to suggest that these clouds are also sub-Alfvénic.
7. Summary
The Pipe nebula has proved to be an interesting interstellar complex where to investigate the physical processes that forestall the stellar formation phases. The polarimetric survey analyzed in this work covers a small fraction only of the entire Pipe nebula complex, and there is no doubt that new data is highly desired in order to verify some of the speculations settled in this investigation. In Paper I, we suggested that the Pipe nebula, a conglomerate of filamentary clouds and dense cores, is possibly experiencing different stages of evolution. From the point of view of the global polarimetric data alone, we proposed three evolutionary phases from B 59, the most evolved region, to the bowl, the youngest one, however, the real scenario seems to be much more complicated than that. As demonstrated by Frau et al. (2010), from the point of view of the chemical properties derived for four studied starless cores, there does not seem to be a clear correlation between the chemical evolutionary stage of the cores and their position in the cloud.
In addiction, the polarimetric analysis conducted here suggests that,
-
1.
Although the unusually high degree of polarization, observed for numerous stars in our sample, the probed interstellar dust does not seem to present any peculiarity as compared to the common diffuse interstellar medium. In fact, the fields where the high polarization were observed show a polarization efficiency of the order of % mag-1, which is the typical maximum value universally observed for the diffuse interstellar medium.
-
2.
Basically all observed fields in B 59 and the Pipe’s stem present an estimated polarization efficiency of the order of % mag-1, and all so far known candidate YSOs presumed associated to the Pipe nebula were found in those regions.
-
3.
While the value of the mean polarization angle obtained for fields toward volumes not associated to the densest parts of the main body of the Pipe nebula seems to remain almost constant, the same does not happens for fields presenting large interstellar absorption, suggesting that the uniform component of the magnetic field permeating the densest filaments of the Pipe nebula shows systematic variations along the main axis of the dark cloud complex.
-
4.
Analysis of the second–order structure function of the polarization angles suggests that in the Pipe nebula the large scale magnetic field dominates energetically with respect to the turbulence, i.e. the turbulence is sub-Alfvénic. Only in a localized region between the bowl and the stem turbulence appear to be dynamically more important.
References
- Alves & Franco (2007) Alves, F. O. & Franco, G. A. P. 2007, A&A, 470, 597
- Alves et al. (2008) Alves, F. O., Franco, G. A. P., & Girart, J. M. 2008, A&A, 486, L13
- Alves et al. (2007) Alves, J., Lombardi, M., & Lada, C. J. 2007, A&A, 462, L17
- Brooke et al. (2007) Brooke, T. Y., Huard, T. L., Bourke, T. L., et al. 2007, ApJ, 655, 364
- Carmona et al. (2007) Carmona, A., van den Ancker, M. E., & Henning, T. 2007, A&A, 464, 687
- Chandrasekhar & Fermi (1953) Chandrasekhar, S. & Fermi, E. 1953, ApJ, 118, 113
- Covey et al. (2010) Covey, K. R., Lada, C. J., Román-Zúñiga, C., et al. 2010, ArXiv:1007.2192
- Davis & Greenstein (1951) Davis, L. J. & Greenstein, J. L. 1951, ApJ, 114, 206
- de Winter & Thé (1990) de Winter, D. & Thé, P. S. 1990, Ap&SS, 166, 99
- Dutra et al. (2002) Dutra, C. M., Santiago, B. X., & Bica, E. 2002, A&A, 381, 219
- Falceta-Gonçalves et al. (2008) Falceta-Gonçalves, D., Lazarian, A., & Kowal, G. 2008, ApJ, 679, 537
- Forbrich et al. (2009) Forbrich, J., Lada, C. J., Muench, A. A., Alves, J., & Lombardi, M. 2009, ApJ, 704, 292
- Forbrich et al. (2010) Forbrich, J., Posselt, B., Covey, K. R., & Lada, C. J. 2010, ArXiv e-prints
- Frau et al. (2010) Frau, P., Girart, J. M., Beltrán, M. T., et al. 2010, submitted to ApJ
- Frogel et al. (1999) Frogel, J. A., Tiede, G. P., & Kuchinski, L. E. 1999, AJ, 117, 2296
- Galli et al. (2006) Galli, D., Lizano, S., Shu, F. H., & Allen, A. 2006, ApJ, 647, 374
- Gerakines et al. (1995) Gerakines, P. A., Whittet, D. C. B., & Lazarian, A. 1995, ApJ, 455, L171
- Goldsmith et al. (2008) Goldsmith, P. F., Heyer, M., Narayanan, G., et al. 2008, ApJ, 680, 428
- Goodman et al. (1992) Goodman, A. A., Jones, T. J., Lada, E. A., & Myers, P. C. 1992, ApJ, 399, 108
- Goodman et al. (1995) Goodman, A. A., Jones, T. J., Lada, E. A., & Myers, P. C. 1995, ApJ, 448, 748
- Heiles (2000) Heiles, C. 2000, AJ, 119, 923
- Herbig (2005) Herbig, G. H. 2005, AJ, 130, 815
- Heyer et al. (2008) Heyer, M., Gong, H., Ostriker, E., & Brunt, C. 2008, ApJ, 680, 420
- Hildebrand et al. (2009) Hildebrand, R. H., Kirby, L., Dotson, J. L., Houde, M., & Vaillancourt, J. E. 2009, ApJ, 696, 567
- Hillenbrand et al. (1992) Hillenbrand, L. A., Strom, S. E., Vrba, F. J., & Keene, J. 1992, ApJ, 397, 613
- Hily-Blant & Falgarone (2007) Hily-Blant, P. & Falgarone, E. 2007, A&A, 469, 173
- Houde et al. (2009) Houde, M., Vaillancourt, J. E., Hildebrand, R. H., Chitsazzadeh, S., & Kirby, L. 2009, ApJ, 706, 1504
- Lazarian (2003) Lazarian, A. 2003, Journal of Quantitative Spectroscopy and Radiative Transfer, 79-80, 881
- Li et al. (2009) Li, H., Dowell, C. D., Goodman, A., Hildebrand, R., & Novak, G. 2009, ApJ, 704, 891
- Lombardi et al. (2006) Lombardi, M., Alves, J., & Lada, C. J. 2006, A&A, 454, 781
- Magalhães et al. (1996) Magalhães, A. M., Rodrigues, C. V., Margoniner, V. E., Pereyra, A., & Heathcote, S. 1996, in ASP Conf. Ser. 97: Polarimetry of the Interstellar Medium, 118
- Muench et al. (2007) Muench, A. A., Lada, C. J., Rathborne, J. M., Alves, J. F., & Lombardi, M. 2007, ApJ, 671, 1820
- Myers & Goodman (1991) Myers, P. C. & Goodman, A. A. 1991, ApJ, 373, 509
- Nakamura & Li (2008) Nakamura, F. & Li, Z. 2008, ApJ, 687, 354
- Padoan et al. (2004) Padoan, P., Jimenez, R., Juvela, M., & Nordlund, Å. 2004, ApJ, 604, L49
- Pereyra (2000) Pereyra, A. 2000, Ph.D. Thesis, Univ. São Paulo (Brazil)
- Pereyra & Magalhães (2007) Pereyra, A. & Magalhães, A. M. 2007, ApJ, 662, 1014
- Poidevin et al. (2010) Poidevin, F., Bastien, P., & Matthews, B. C. 2010, ApJ, 716, 893
- Román-Zúñiga et al. (2009) Román-Zúñiga, C. G., Lada, C. J., & Alves, J. F. 2009, ApJ, 704, 183
- Román-Zúñiga et al. (2007) Román-Zúñiga, C. G., Lada, C. J., Muench, A., & Alves, J. F. 2007, ApJ, 664, 357
- Schmidt et al. (1992) Schmidt, G. D., Elston, R., & Lupie, O. L. 1992, AJ, 104, 1563
- Serkowski (1974) Serkowski, K. 1974, in Methods Exper. Phys. Vol. 12A, ed. N. Carleton (Academic, New York), 361
- Serkowski et al. (1975) Serkowski, K., Mathewson, D. L., & Ford, V. L. 1975, ApJ, 196, 261
- Tassis & Mouschovias (2005) Tassis, K. & Mouschovias, T. C. 2005, ApJ, 618, 769
- Troland & Crutcher (2008) Troland, T. H. & Crutcher, R. M. 2008, ApJ, 680, 457
- Turnshek et al. (1990) Turnshek, D. A., Bohlin, R. C., Williamson, R. L., et al. 1990, AJ, 99, 1243
- Vrba et al. (1993) Vrba, F. J., Coyne, G. V., & Tapia, S. 1993, AJ, 105, 1010
- Wagenblast & Hartquist (1989) Wagenblast, R. & Hartquist, T. W. 1989, MNRAS, 237, 1019
- Whittet (2003) Whittet, D. C. B. 2003, Dust in the galactic environment, 2nd ed (IoP Publishing, Bristol)
- Whittet et al. (1994) Whittet, D. C. B., Gerakines, P. A., Carkner, A. L., et al. 1994, MNRAS, 268, 1
- Whittet et al. (2001) Whittet, D. C. B., Gerakines, P. A., Hough, J. H., & Shenoy, S. S. 2001, ApJ, 547, 872
- Whittet et al. (2008) Whittet, D. C. B., Hough, J. H., Lazarian, A., & Hoang, T. 2008, ApJ, 674, 304