present address: ]Department of Physics, Graduate School of Science, Kyoto University, Kyoto 606-8502, Japan
Electron interactions and charge ordering in La2-xSrxCuO4
Abstract
We present results of inelastic light scattering experiments on single-crystalline La2-xSrxCuO4 in the doping range andTl2Ba2CuO6+δ at and . The main emphasis is placed on the response of electronic excitations in the antiferromagnetic phase, in the pseudogap range, in the superconducting state, and in the essentially normal metallic state at , where no superconductivity could be observed. In most of the cases we compare B1g and B2g spectra which project out electronic properties close to and , respectively. In the channel of electron-hole excitations we find universal behavior in B2g symmetry as long as the material exhibits superconductivity at low temperature. In contrast, there is a strong doping dependence in B1g symmetry: (i) In the doping range we observe rapid changes of shape and temperature dependence of the spectra. (ii) In La2-xSrxCuO4 new structures appear for which are superposed on the electron-hole continuum. The temperature dependence as well as model calculations support an interpretation in terms of charge-ordering fluctuations. For the response from fluctuations disappears at B1g and appears at B2g symmetry in full agreement with the orientation change of stripes found by neutron scattering. While, with a grain of salt, the particle-hole continuum is universal for all cuprates the response from fluctuating charge order in the range is so far found only in La2-xSrxCuO4. We conclude that La2-xSrxCuO4 is close to static charge order and, for this reason, may have a suppressed .
I Introduction
The cuprates are fascinating materials not only for their superconducting transition temperatures in the 100 K range Bednorz1986_ZPB64_189 but also for the wealth of new physics they exhibit. The electron-phonon coupling mechanism which was believed to be almost universal (except for a few heavy fermion compounds and 3He) had to be supplemented if not abandoned. This became experimentally evident when the gap was found to have -wave Tsuei2000_RMP72_969 rather than -wave symmetry as in conventional superconductors with reasonably high transition temperatures. Another hallmark was the observation of electron dynamics with a strong anisotropy in the CuO2 plane Damascelli2003_RMP75_473 . A reverberation of the unconventional carrier dynamics was observed as early as 1989 in NMR experiments when studying the Knight shift Alloul1989_PRL63_1700 . The unexpected decrease of the spin-lattice relaxation towards lower temperature indicated a (pseudo)gap in the electron spectrum preceding the superconducting gap Norman2005_AP54_715 . The origin of the pseudogap and of superconductivity among several other instabilities is still elusive in spite of enormous progress in the experimental understanding.
Electronic Raman scattering (ERS) turned out to be instrumental to analyze properties of the cuprates Devereaux2007_RMP79_175 . While gap anisotropies in the superconducting state were found early Hackl1988_PRB38_7133 ; Cooper1988_PRB38_11934 , the notion of gap nodes was indirect and qualitative at first Hackl1988_PRB38_7133 ; Monien1989_PRL63_911 . In the normal state, carrier anisotropies in the -plane were experimentally obvious Staufer1990_SSC75_975 ; Slakey1991_PRB43_3764 but a quantitative understanding was possible only after 1994 when the relationship between scattering symmetries and different regions in momentum space was explained Devereaux1994_PRL72_396 . It is in fact these selection rules which make ERS truly complementary to optical (IR) spectroscopy in which a similar type of two-particle response is measured with, however, some resolution in momentum space (due to the fluctuation nature of light scattering in charged systems). Prestel2010 .
The selection rules were crucial to pin down the interpretation of novel excitations superposed on the particle-hole continuum in underdoped La2-xSrxCuO4 Venturini2002_P66_060502 ; Tassini2005_PRL95_117002 . The low-energy peaks cropping up at low temperature even in the presence of long range antiferromagnetic order whenever the doping was non zero Tassini2008_PRB78_020511 could be assigned to charge-ordering fluctuations Caprara2005_PRL95_117004 . In La2-xSrxCuO4 the “Aslamazov-Larkin” peaks appear in B1g and B2g symmetry above and below , respectively, compatible with the rotation of the dynamic superstructure or stripes observed by neutron scattering Fujita2002_PRB65_064505 . This allows us to track ordering phenomena with short correlation lengths in the cuprates with Raman scattering. Stripes seem to be omnipresent Kivelson2003_RMP75_1201 and may be of importance for both the pseudogap and superconductivity. The well defined symmetry dependence of the response in La2-xSrxCuO4 highlights the orientational order (nematicity).
In this publication we explore the generic properties and the interrelation of ordering phenomena in the cuprates by studying a very wide doping and temperature range. We present new data on La2-xSrxCuO4 (LSCO) and Tl2Ba2CuO6+δ (Tl2201) and put them into context with existing work. In Section II we review some basic aspects of Raman scattering and show how annealing and aging affect the material properties and the Raman spectra. Results on LSCO and Tl2201 are presented in section III. In section IV we discuss those properties of the cuprates which we consider generic or even universal. We focus on spin and charge dynamics, fluctuation phenomena and finally the phase diagram with its crossover lines.
II Experiment and Samples
II.1 Principles of electronic Raman scattering and selection rules
In a Raman experiment a photon flux density impinges on a sample and a number of photons per unit time is scattered inelastically into an energy interval and a solid angle . corresponds to a set of incoming and outgoing photon polarizations, , . From linear combinations of the measured spectra, pure symmetries can be derived. can be written as
| (1) |
where is the cross section inside the material for certain polarizations, absorbs experimental factors such as losses at the sample surface or scattering volume and is the (monochromatic) transmission coefficient of the complete set-up including the spectrometer and the CCD detector. The spectra we show are generally response functions for a symmetry , , in units of counts per second and mW absorbed laser power [cts/(mW s)]. Among other factors includes matrix element effects since the response function is almost always determined in the non-resonant effective mass approximation Devereaux2007_RMP79_175 . The connection between the internal cross section for a given symmetry and the response functions is given by the fluctuation-dissipation theorem and can be expressed as
| (2) |
with the excitation energy (Raman shift), the Bose-Einstein occupation number and the “classical” electron radius, hence Eq. (2) describes the cross section per electron. For the analyses presented below we do not need absolute cross sections (which could be calculated with some effort). Independent of that, all spectra have the same scale and can be compared quantitatively to all of our previous results. In particular, the measured count rates are normalized to a resolution of cm-1 at 458 nm and divided by with the spectral sensitivity of the setup (see next paragraph).
Electronic Raman spectra (from particle-hole excitations) of symmetry project out specific regions in the Brillouin zone (BZ) Devereaux1994_PRL72_396 . In most of the cases here we show results in B1g and B2g symmetry where carriers with momenta along the principal axes and in the centers of the quadrants of the BZ, respectively, are emphasized. The squares of the vertices are shown in the insets of Figs. 3 (a) and (b).
II.2 Raman experiment
The samples were mounted on the cold finger of a He-flow cryostat in a vacuum of typically mbar. All spectra were measured with an Ar+ laser emitting in the range 458-514 nm. The spectra of LSCO were generally measured with an exciting wavelength of 458 nm. The data on Tl2201 were collected with the line at 514 nm in order to reduce phonon resonances. All light polarizations were controlled from outside the sample in such a way that the polarization state inside the sample had the desired orientation. For the laser light () incident at an angle of typically 66∘ to the surface normal this can be achieved by compensating for the phase shifts introduced at the sample surface. The accuracy of the polarization state in the sample was always better than 99 %. Since the scattered light () is collected along the surface normal its polarization state can be selected trivially. The scattered light was analyzed in most of the cases with a subtractively coupled Jarrell-Ash 25-100 scanning spectrometer. The image of the laser focus on the entrance slit was smaller than the slit width at all energy shifts, as verified with a CCD (charge coupled device) camera (see also Reznik1993_PRB48_7624 ), to avoid losses due to the chromatic aberration of the collection optics.
In the energy range studied, changes in the optical constants are too small to influence the spectral shape significantly. The efficiency of the entire setup was determined with a standard lamp. Using white light for the calibration determines both the pure monochromatic transmission and the energy dependent variation of the spectral resolution at constant slit width. The transmission can also be measured directly with monochromatic light while the resolution can be calculated to an accuracy of a few percent if the geometry of the spectrometer is known. Therefore the efficiency can be determined in two completely independent ways.
With the optical constants determined accurately, the main polarizations in the -plane (see Table 1) can be measured with high accuracy and can be checked for internal consistency as shown in Fig. 1 before the four symmetries , A2g, B1g, and B2g are determined. A1g, for instance, is obtained as
| (3) |
where the light is always propagating along (or anti-parallel to) the -axis and the polarizations are in the -plane with , , etc.
| polarization | symmetries |
|---|---|
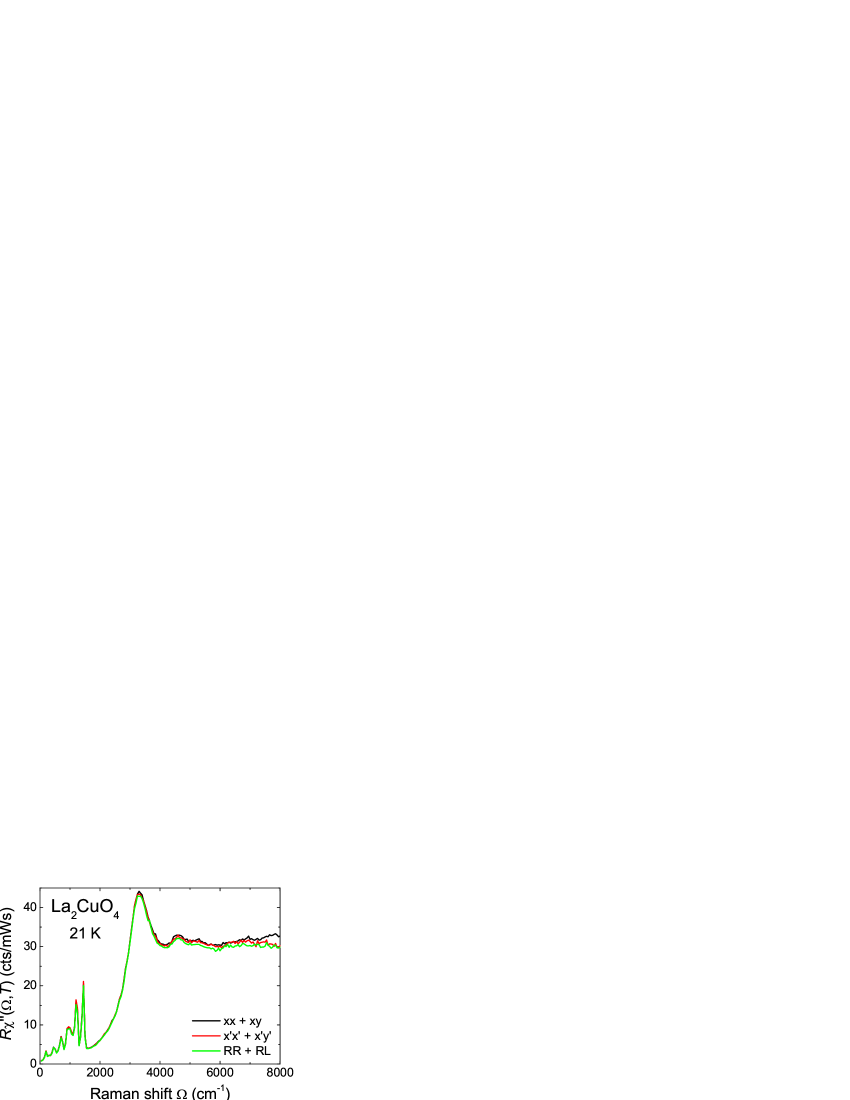
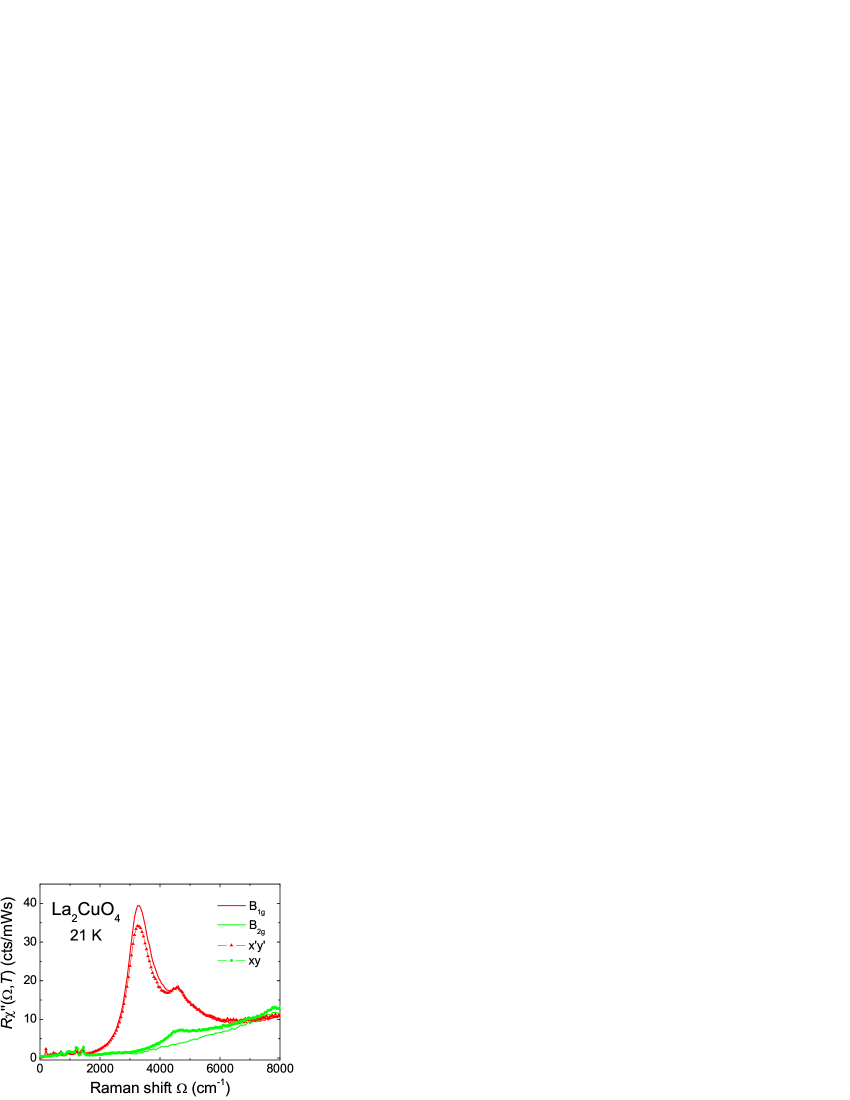
We do not always present the response at pure symmetries, for the sake of saving measurement time, but the responses in and symmetry. The analysis of many cuprates at various doping levels shows, however, that the error introduced by this simplification is small: (i) At energies cm-1 the contributions from A2g excitations are generally an order of magnitude smaller than those at the other symmetries (Fig. 7). (ii) For a freak of nature, in practically all B1g and B2g spectra the effect of A2g and the division by compensate each other to within % up to 8000 cm-1 Raman shift (see Fig. 2). (iii) Disorder in the sample can enhance the high energy cross section enormously (see below), and the inaccuracies due to the A2g contributions become significant only for extremely clean and ordered samples such as YBa2Cu3O6+x prepared in BaZrO3 crucibles Erb1995_PC245_245 or latest generation Bi2Sr2CaCu2O8+δ Ando1995_PRL75_4662 ; Ando1996_PRL77_2065 ; Ando1997_PRB56_8530 ; Eisaki2004_PRB69_064512 (also see below).
II.3 Samples
The samples for which we show results here are compiled in Table 2. All La2-xSrxCuO4 (), and samples were prepared in image furnaces via the travelling solvent floating zone (TSFZ) technique. The Tl2Ba2CuO6+δ crystals were prepared in crucibles Peets2010_JCG312_344 . Generally, the samples were post-annealed (see table 2). In some cases we also measured as grown samples for monitoring the changes via Raman spectroscopy. The Néel temperatures of antiferromagnetic (AF) samples and some of the superconducting transition temperatures were measured with the DC-SQUID. In most of the cases was determined via the non-linear susceptibility.
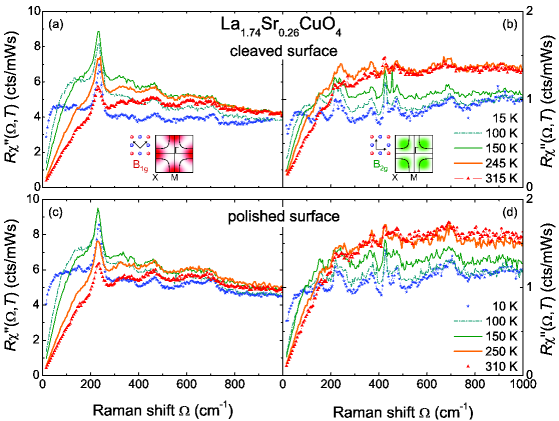
The spectra on LSCO were usually measured on polished surfaces. The samples were polished in the crystal laboratory of the Technical University Munich. For best results, diamond paste with a grain size of 0.3 m was used which we found yield better results than chemical etching. For LSCO-26 we compared the results from polished and cleaved surfaces up to an energy transfer of 1000 cm-1 and did not find significant differences (see Fig. 3).
| sample | sample ID | doping | (K) | (K) | comment | |
| LCO-00 | 0.00 | 0/270 | - | as grown | ||
| LCO-00-Ar | 0.00 | 0/325 | - | Ar annealed | ||
| LSCO-04 | 0.04 | 0/- | - | O2 annealed | ||
| LSCO-05 | 0.05 | 5/- | 3 | O2 annealed | ||
| LSCO-08 | 0.08 | 18 | 4 | O2 annealed | ||
| LSCO-15 | 0.15 | 38 | 3 | O2 annealed | ||
| LSCO-17 | 0.17 | 39 | 1 | O2 annealed | ||
| LSCO-20 | 0.20 | 24 | 3 | O2 annealed | ||
| LSCO-25 | 0.25 | 12 | 3 | O2 annealed | ||
| LSCO-30 | 0.30 | 0 | - | as grown | ||
| LSCO-30-O2 | 0.30 | 0 | - | 100 bar O2 | ||
| Tl2Ba2CuO6+δ | Tl2201-20 | 0.20 | 78 | 5 | O2 annealed | |
| Tl2Ba2CuO6+δ | Tl2201-24 | 0.24 | 46 | 5 | O2 annealed | |
| Bi2212-16 | 0.16 | 94 | 2 | air annealed | ||
| LSCO-02 | 0.02 | 0/- | - | as grown | ||
| LSCO-10 | 0.10 | 25 | 4 | O2 annealed | ||
| LSCO-15 | 0.15 | 38 | 4 | O2 annealed | ||
| LSCO-26 | 0.26 | 0 | - | O2 annealed |
II.4 Annealing and aging
For all crystals the growth conditions depend crucially on the atmosphere, in particular on the oxygen partial pressure (see also Erb2010 ). Usually, the environment optimal for crystal growth does not return samples at the desired doping level or with the expected intrinsic properties, necessitating post-annealing.
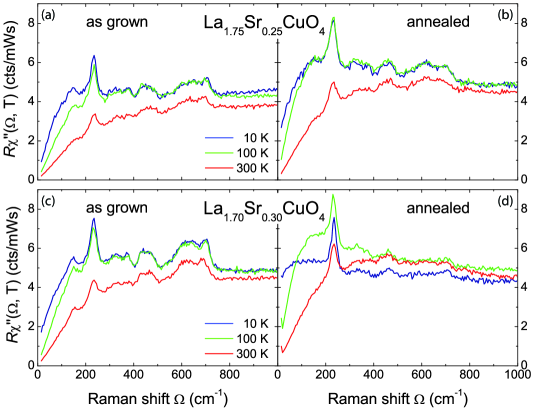
For instance, LCO-00 had to be annealed in Ar for the Néel temperature to reach 325 K and an annealing in 1 bar of O2 improves the crystal quality for most Sr-containing samples Fujita__ . For and on the overdoped side (see Table 2), substantial differences in both the spectral shape and the temperature dependence of the electronic spectra in B1g symmetry were observed between as grown [Fig. 5(a),(c)] and post-annealed samples [Fig. 5(b),(d)]. In LSCO the only allowed mode in B1g symmetry is the out-of-phase vibration of the La atoms at 240 cm-1. All the other bands at 150 cm-1, 400-500 cm-1, and 600-700 cm-1 are activated by lattice defects. High pressure oxygen loading suppresses these bands substantially. Apparently, they are activated by oxygen defects meaning that phonons with the proper symmetry are projected on the deficiency site Turrell1972__ and become Raman active. In addition to the reduction of the defect bands by high-pressure oxygen loading the electronic continuum develops more structure: (i) The initial slope of the spectra at 10 K is much steeper for the annealed samples with and indicating a reduced elastic relaxation Devereaux2007_RMP79_175 . (ii) Between 400 and 1000 cm-1 the continuum changes its shape from convex before to concave after annealing. (iii) While the temperature dependence of the spectra of LSCO-25 changes only little after annealing at 1 bar O2, there is a significant change for LSCO-30 which was post-annealed at 100 bar O2. Apparently, the oxygen deficiency at higher Sr concentrations is harder to eliminate. For LSCO-30 the temperature dependence of the spectra becomes non-monotonic. The spectrum at 100 K exhibits a maximum similar to that of the sample with which will be discussed in Ref. Prestel2010 . Note that there is hardly any change of the continuum below 100 K in both as-grown samples. We conclude that in the annealed crystals dynamic relaxation starts to dominate while in the as grown sample momentum scattering on defects dominates the relaxation at low temperature.
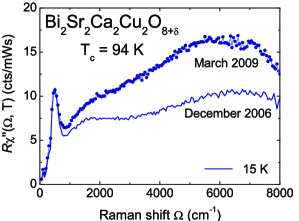
Finally, we found very strong changes of the high-energy continuum of Bi2212-16 as a function of sample age as shown in Fig. 6. At 8000 cm-1 the continuum is almost twice as intense for the aged sample as for the freshly prepared one. We note that no change in , in , nor in the low energy part of the spectra could be observed. It is known that Bi2212 is not completely stable and we speculate that out-of-plane defects trap charge and produce an enhanced level of luminescence. No aging effects were observed for LSCO and .
This summary of effects of sample quality highlights that the Raman spectra are rather sensitive to disorder but can help to pinpoint the nature of the changes in some cases. The defects appear to be away from the CuO2 plane in Bi2212 while in overdoped LSCO the defects existing prior to annealing are located in the CuO2 plane.
III Results
We describe now the results on LSCO and Tl2201. One purpose of the experiments on Tl2201 was to check whether or not the rather abrupt spectral changes in B1g symmetry in overdoped Bi2212 Venturini2002_PRL89_107003 ; Blanc:2009 are generic. This issue cannot be settled straightforwardly with LSCO since the sample homogeneity in the range is reduced for thermodynamic reasons, and a transition from a hole- to an electron-like Fermi surface takes place Yoshida2006_PRB74_224510 . However, in LSCO the entire doping range can be accessed in a single compound class and, bearing the sample quality issues in mind, the evolution of all excitations can be studied in detail.
III.1 La2-xSrxCuO4
In this subsection all results on LSCO we have obtained over the years are compiled. Those which are new can be identified in Table 2. We start with spectra at high energy transfers where spin and electron-hole excitations contribute. Then the particle-hole dynamics in the range up to 1000 cm-1 are presented and analyzed. Finally, we compile the data on the fluctuation response obtained on the underdoped side which complete and supplement the study at and 0.10 Tassini2005_PRL95_117002 .
III.1.1 Response at high energies
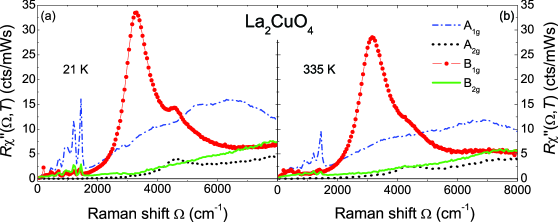
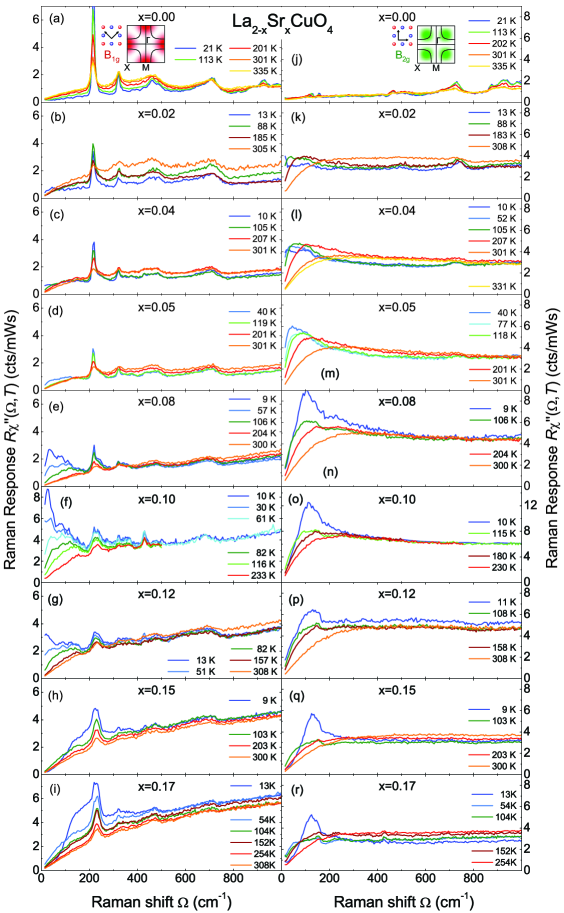
In Fig. 7 we plot the Raman response for two temperatures at all four symmetries of the tetragonal point group which is by and large applicable for the high-energy part of the spectra. Similar results have been published for Gd2CuO4 at room temperature Sulewski1991_PRL67_3864 and, for a smaller set of polarizations, for various other cuprates Reznik1993_PRB48_7624 ; Sugai1988_PRB38_6436 ; Blumberg1994_PRB49_13295 ; Blumberg1996_PRB53_11930 ; Sugai2003_PRB68_184504 ; Gozar2005__755 . Due to the orthorhombic distortion below about 500 K, a small anisotropy is also found at high energies - in addition to a strong one in the energy range where phonons occur Gozar2005__755 . Up to 4000 cm-1, the data agree well with those on Gd2CuO4 Sulewski1991_PRL67_3864 . Similarly, qualitative agreement is also found with results on other cuprates Reznik1993_PRB48_7624 ; Blumberg1994_PRB49_13295 ; Blumberg1996_PRB53_11930 ; Gozar2005__755 . The structures at low temperature between 1000 and 2000 cm-1 are due to two-phonon processes Sugai1989_PRB39_4306 which are observed only in the undoped compound and become weaker at high temperature [Fig. 7(b)]. At low temperatures new structures appear in A1g and B1g symmetry at 5200 and 4500 cm-1, respectively, and the A2g peak at 4600 cm-1 becomes sharper. This B1g peak is most pronounced at low temperatures and doping levels and becomes broader for higher temperatures. The results are shown for comparison and will be discussed in more detail elsewhere.
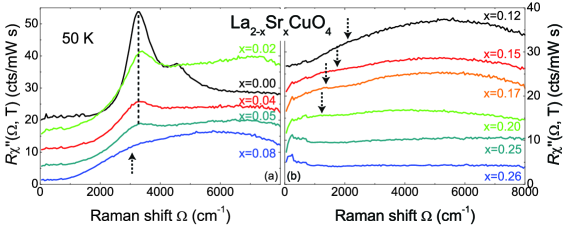
At higher doping levels the response from spin excitations decreases rapidly Reznik1993_PRB48_7624 ; Blumberg1994_PRB49_13295 ; Blumberg1996_PRB53_11930 ; Sugai2003_PRB68_184504 ; Gozar2005__755 and can be observed for in B1g symmetry only. Therefore we show in Fig. 8 only B1g spectra at low temperature in the doping range . As a general trend, the entire spectra up to 8000 cm-1 decrease continuously in intensity towards higher doping. At the highest doping levels the response above 2000 cm-1 is essentially flat in B1g symmetry. The two-magnon peak becomes very weak above 5% doping but may still be resolved in the range 1000 to 1500 cm-1 at 25%. The well-defined peak in B1g symmetry below 1000 cm-1 at is clearly resulting from electron-hole excitations as will be discussed briefly in subsection III.1.2 and in detail in the contribution by Prestel et al. Prestel2010 .
III.1.2 Electron-hole excitations in the limit
In this section we show only analyzed data. The technique employed to derive “Raman resistivities”, i. e. the inverse slopes of the spectra, , from the response is described in detail by Opel et al. Opel2000_PRB61_9752 . In Fig. 9 all results we obtained for LSCO so far are compiled. There are four major observations: (i) For the rates for B1g and B2g symmetry are similar in both magnitude and temperature dependence indicating more or less isotropic metallic behavior. and closely track the resistivity when converted via the Drude approximation , with the plasma frequency in units of eV and the resistivity in cm. (ii) Upon reducing the doping from 0.25 to 0.20 and become different. (iii) For we find substantial differences in the magnitudes of and at room temperature. The temperature dependences are metallic in either case with increasing towards underdoping. Only matches the resistivity. (iv) For , none of the Raman resistivites exhibits similarities with the temperature dependence of the resistivity. is much larger than for all temperatures and weakly non-metallic.
As we will see in section III.2, the crossover in the range is also present in Tl2201. Due to the uniquely wide doping range accessible in LSCO the other relevant doping levels at approximately 5 and 25% are also observable. Are there additional features?
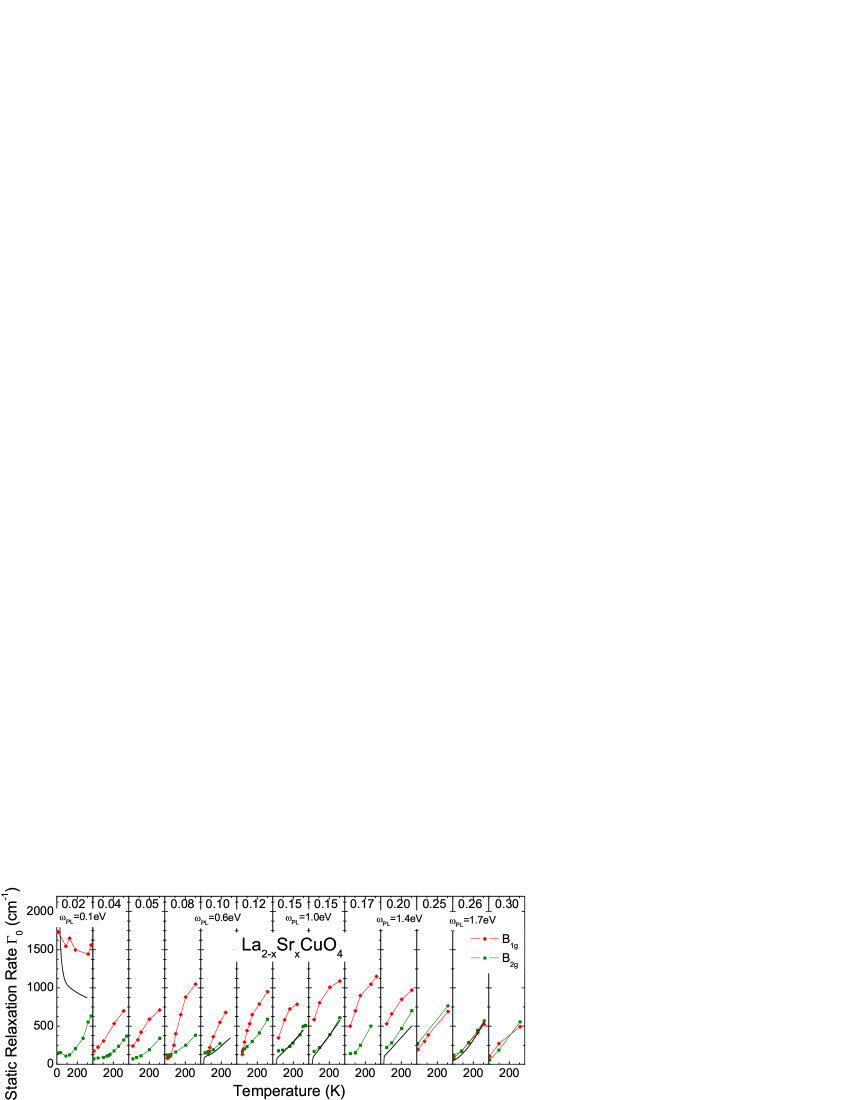
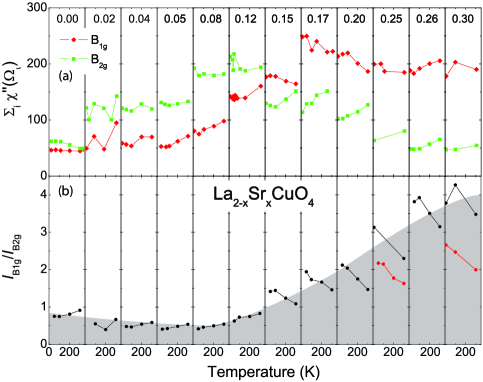
To answer this question we look at a different quantity, the integrated intensities of the spectra in B1g and B2g symmetry, and , respectively, and the ratio of the intensities, , integrated in the range from 800 up to 1000 cm-1, where the spectra are only weakly temperature dependent Opel2000_PRB61_9752 . The results are compiled in Fig. 10. exhibits little doping dependence for , increases for , and becomes again doping independent for higher doping levels. In contrast, shows a maximum at approximately 12% doping and decreases on either side. The temperature dependences in the two symmetries are different as well: While the temperature dependence of does not change significantly with doping, increases slightly with temperature for low doping, while on the overdoped side it decreases with increasing temperature. In a tight binding scheme is expected to hold, with and the nearest and next-nearest neighbor hopping parameters, respectively Einzel1996_JRS27_307 . This is the case at high doping levels (see Ref. Prestel2010 ) and should not change substantially for lower doping as pointed out in Refs. Katsufuji1993_PRB48_16131 ; Naeini1999_PRB59_9642 . In contrast to the expectation, not only does the ratio decrease by almost an order of magnitude, but the temperature derivative changes from negative to slightly positive in the range . Hence, there is another crossover close to optimal doping, which appeared also in the relaxation rates of Bi2212 Venturini2002_PRL89_107003 . The question arises as to how these properties fit into a universal picture and what may explain the discrepancies.
III.1.3 Density-wave fluctuations
LSCO opens a window towards an answer. We hypothesize that compounds with a maximal transition temperature close to 100 K show “canonical” carrier dynamics while in those with reduced the generic properties may be masked. Only for Bi2212 () have the carrier dynamics in the normal state been studied in detail Venturini2002_PRL89_107003 . The body of data in Y123 () is much smaller and the B1g electronic response cannot directly be accessed since the spectra of the CuO2 planes are superposed by the strongly coupling buckling mode Opel1999_JLTP117_347 ; Opel:1999 and the response from the CuO chains. Nevertheless, we find a clear dichotomy between the B1g and B2g carrier dynamics below in that and is approximately temperature independent Staufer1990_SSC75_975 ; Slakey1991_PRB43_3764 ; Venturini2002_PRL89_107003 ; Opel2000_PRB61_9752 ; Zhou1996_SSC99_669 . In section III.2 we present new results on Tl2201 with that fit into this framework. In which sense is LSCO different?
Most strikingly, in contrast to the high- compounds, becomes constant or weakly insulating only below 5% doping [see Fig. 9]. While the temperature dependence of is metallic for all , the big difference in the magnitude of at room temperature continues to exist for [see Fig. 9]. We show that we can trace back the metallicity of to an extra contribution specific to LSCO as suggested by Dumm et al. Dumm:2002 and Venturini et al. Venturini2002_P66_060502 . In Fig. 11 we compare data in the range . For comparison, samples LSCO-02 and LSCO-10 from previous measurements Tassini2005_PRL95_117002 are included. Up to 12% doping we observe extra peaks in the energy range below 200 cm-1 developing at low temperature, first in B1g symmetry [Fig. 11 (e),(f)], then, at and below 5%, in B2g symmetry [Fig. 11 (h)-(j)]. Note the non-monotonic doping dependence of the low-energy peaks, which most likely is the result of slightly different crystallographic order in the samples. The new features clearly change symmetry close to 5% doping. The transition is continuous in that remainders of the additional response can be observed in B1g symmetry also for . The peak energy of the low-energy structures decreases proportional to temperature at all doping levels while the peak height increases.
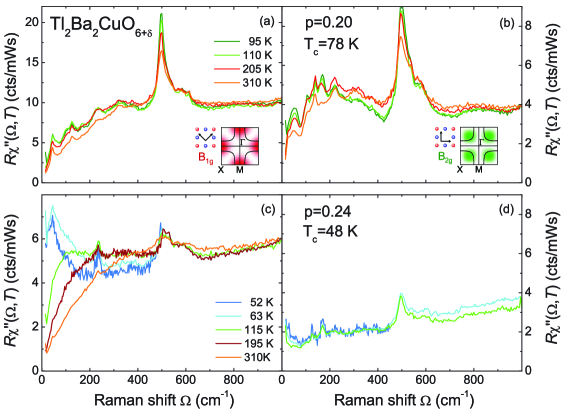
III.2 Tl2Ba2Cu2O6+δ
Tl2201 can be used for experiments on the overdoped side in the range . Here, we look at two samples above and below the crossover point found in Bi2212 at approximately 21% Venturini2002_PRL89_107003 . As shown in Fig. 12, the B1g spectra exhibit qualitatively different temperature dependences. At the response changes only weakly with temperature. In contrast, the initial slope increases rapidly at low temperatures for . In addition, a Fermi liquid maximum with an energy close to emerges out of the flat continuum typical for most of the cuprates. We note that the spectral shapes are very similar to those in Bi2212 and also LSCO at comparable doping levels (see also Ref. Prestel2010 ).
IV Discussion
IV.1 Spin excitations
The measurement of light scattering cross sections at high energy transfers requires a careful analysis since corrections for the response of the setup are large (up to factors of 20 for 8000 cm-1 shift) and the spectra may be contaminated by spurious photons in the laboratory and fluorescence of adsorbates. Luminescence in the sample may also play a crucial role (see Fig. 6) and cannot easily be controlled. However, important information from spin and charge excitations can be obtained which is not directly accessibly by other methods. While most of the charge excitations are observable by optical spectroscopy, the observation of spin excitations above 1200-1600 cm-1 remains challenging.
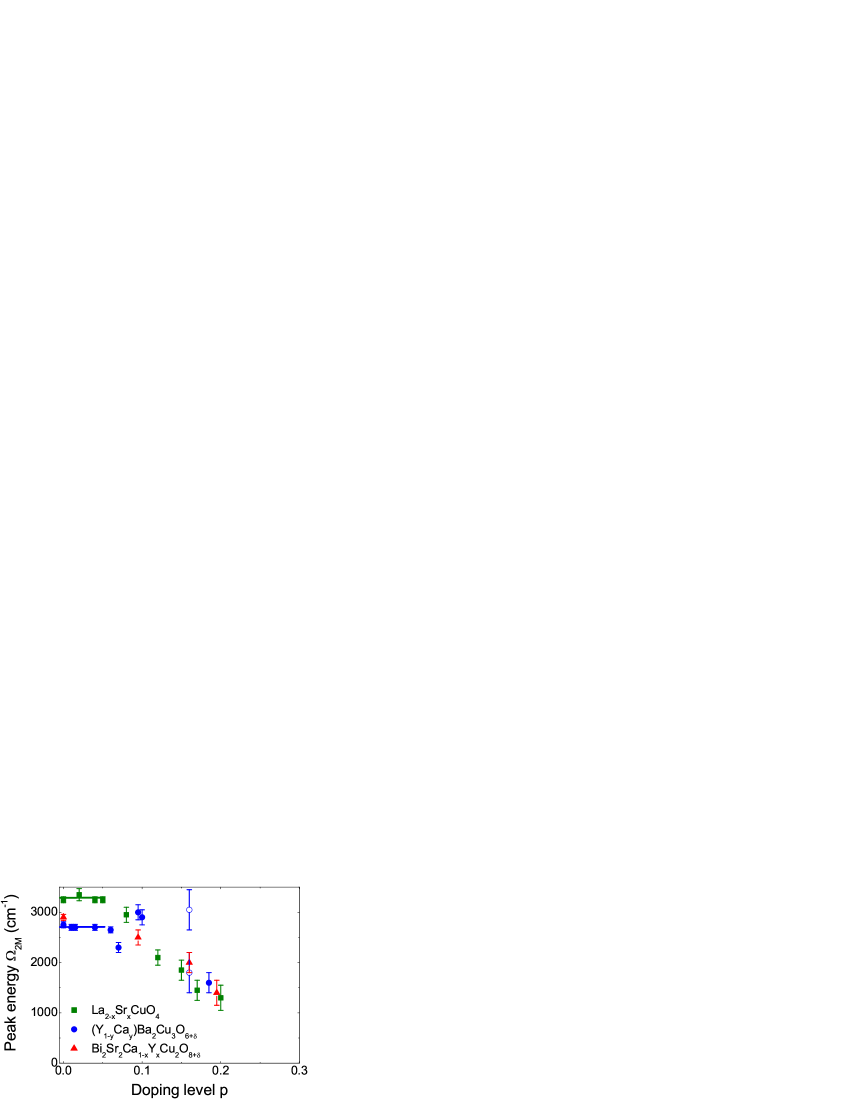
Our experiments at large energy transfers focussed mainly on charge excitations and will be discussed in Ref. Prestel2010 . Here we make a few remarks on two-magnon excitations. Only at zero doping are there several well defined structures in the spectra at all symmetries [Fig. 7]. The strong peak in B1g symmetry at 3300 cm-1 originates from nearest-neighbor spin flips. The excitations at A1g, A2g, and B2g symmetry come from spin-spin interactions with coupling beyond nearest-neighbor sites, from cyclic exchange Delannoy2005_PRB72_115114 ; Vernay2007_PRB75_020403 , and from coupling to the chirality operator Sulewski1991_PRL67_3864 ; Gozar2005__755 . The most recent review can be found in Ref. Gozar2005__755 . With increasing sample quality two-magnon excitations were found in the Raman spectra up to the overdoped range (see Fig. 13). In principle, two-magnon scattering should be observable as long as clusters with correlation lengths of 3 or 4 lattice constants exist but, apparently, defects broaden the peaks sufficiently to make them to disappear into the continuum. Fleury et al. report two-magnon scattering for Y123 up to optimal doping Lyons1988_PRL60_732 while in high-quality Bi2212 samples, observation is possible up to Rubhausen1999_PRL82_5349 . In LSCO we find indications up to 25%. The maxima we observe are weak and discernable only at low temperature, but surprisingly narrow with a FWHM of only 500 cm-1 or less at energies above 1200 cm-1. Although the results at the highest dopings should be considered with care, they have a clear correspondence to incommensurate spin fluctuations observed in neutron experiments Wakimoto2004_PRL92_217004 . The energies of the two-magnon maxima are compiled in Fig. 13. As already observed by Tassini and coworkers Tassini2008_PRB78_020511 , is essentially constant below the onset of superconductivity at then jumps by some 200 cm-1 and decreases continuously with further doping. This could indicate that some excitation starts to couple to the spin waves above and renormalizes their energy. It is tempting to conclude that the orientation change of the stripes Fujita2002_PRB65_064505 which occurs at the same doping and superconductivity itself are related to this renormalization.
The results presented here [Fig. 8] are in disagreement with those obtained by Sugai and coworkers Sugai2003_PRB68_184504 . The main discrepancy is their spectral shape above 2000-4000 cm-1. In contrast to our results and those by Sulewski and coworkers Sulewski1991_PRL67_3864 and Reznik et al. Reznik1993_PRB48_7624 the spectra shown in Fig. 9 (b) of Ref. Sugai2003_PRB68_184504 decrease more rapidly. This leads to doping dependent peaks since the spectra lose intensity with doping [Fig. 8]. Sugai et al. interpret the peaks at 2000-4000 cm-1 at doping levels above in terms of magnons. We do not believe that this peak is related to spin excitations in the range , but rather conclude that those maxima are artifacts of the sensitivity correction. According to our results, the lowest two-magnon energy observable at is 1200 cm-1 (corresponding to cm-1) rather than 500 cm-1 ( cm-1) as in Ref. Sugai2003_PRB68_184504 . We show in the second contribution Prestel2010 that the temperature dependent maximum in the B1g spectra in the range 200 to 600 cm-1 can be explained directly in terms of particle-hole excitations. In materials with sufficient purity these maxima crop up for doping levels . This can be masked by inhomogeneities in LSCO in the doping range for various reasons.
IV.2 Charge dynamics
LSCO and Tl2201 are laboratories for studying the charge dynamics on the overdoped side. In the case of LSCO, oxygen deficiencies can completely wipe out the intrinsic behavior Nakamae2003_PRB68_100502 . As shown in Fig. 5, the Raman spectra of overdoped samples are changed sufficiently by defects to make them look like those at lower doping levels. However, we do not believe it is the doping level but rather the impurity concentration which is at the origin of the changes since the spectra at all doping levels are influenced in the same way and the defect-induced phonon modes almost completely disappear after annealing (Fig. 5). In ordered samples, the electronic response becomes more strongly temperature dependent and the relaxation rates decrease, as can be seen directly from the spectra (Fig. 5) and also from the Raman resistivities (Fig. 9). In addition, the ratio (Fig. 10) is higher in ordered samples. Intuitively one would argue that long range order enhances the density of states related to the van Hove singularity and, consequently, the B1g Raman intensity projecting out this part of the Brillouin zone.
For lower dopings, , the spectra become flatter in an energy range as large as 1000 cm-1 in a way similar to that found by Venturini et al. Venturini2002_PRL89_107003 for Bi2212. In a comparable doping range, flat spectra are also found in Y123 Opel2000_PRB61_9752 . This happens at doping levels in which quasiparticle peaks are still observed by photoemission for the entire Fermi surface Damascelli2003_RMP75_473 . A similar transition is now also found in Tl2201. The response at in the B1g channel has a quasiparticle maximum and a strong temperature dependence [Fig. 12 (c)] comparable to that of the resistivity. At , however, both the peak and the variation with are gone [Fig. 12 (a)]. We conclude that the “unconventional metal-insulator transition” (nomenclature of Ref. Venturini2002_PRL89_107003 ) is a common feature of a large number of hole-doped cuprates and probably generic. According to the results in Bi2212 the transition is relatively abrupt. Andergassen et al. explain the crossover in terms of charge-ordering fluctuations Andergassen2001_PRL87_056401 which lead to short-range nematic order at approximately 19% doping while the mean field transition at 21% is suppressed by fluctuations.
On the way towards the parent antiferromagnet there are two more crossover points, one close to optimal doping, , and the second one at the onset point of superconductivity, . At , changes sign from positive to negative in Bi2212 Venturini2002_PRL89_107003 . This implies that the relaxation rate increases towards lower temperature. Hence, weakly insulating behavior prevails on the anti-nodal parts of the Fermi surface while the nodal parts remain metallic to much lower temperatures. This dichotomy of the scattering rates on different parts of the Fermi surface around optimal doping is also found in ARPES experiments Chang2008_PRB78_205103 . In conventional transport, insulating characteristics are only found well below up to optimal doping when superconductivity is suppressed by large magnetic fields Ando1995_PRL75_4662 ; Ando1996_PRL77_2065 ; Ando1997_PRB56_8530 ; Boebinger1996_PRL77_5417 . remains unchanged in the whole doping range down to (and actually even for but for other reasons). Also the optical data vary slowly as a function of doping Basov2005_RoMP77_721 . The main change at low doping is the appearance of the pseudogap Puchkov1996_JPCM8_10049 below . The modulation is stronger in IR than in B2g Raman, since IR develops more sensitivity around the nodes than the nodal Raman spectra. Both methods demonstrate that the coherence of the nodal quasiparticles remains intact down to at least . In LSCO, remains positive down to at least 5% doping and only the ratio exhibits a qualitative change at (cf. Figs. 9 and 10). The reason for the differences between LSCO on one hand and Bi2212 and Y123 on the other hand can be identified in the B1g spectra in the doping range , where an extra response develops (Fig. 11) which is either completely missing in the other compounds or not sufficiently narrow to be recognized as a separate peak. Since this feature piles up towards low temperature, the initial slope increases strongly and makes the characteristics to appear metallic. How do we know that these spectral structures are not coming from simple particle-hole excitations?
The answer is twofold. First, there is experimental evidence for the existence of incipient charge and spin order Kivelson2003_RMP75_1201 ; Cheong1991_PRL67_1791 ; Tranquada1995_N375_561 ; Bianconi1996_PRL76_3412 ; Tranquada2005__ and there is a microscopic model for the response of fluctuations of incipient charge order which describes the spectral shape, symmetry and temperature dependences quantitatively Caprara2005_PRL95_117004 . In addition, in agreement with neutron scattering results Fujita2002_PRB65_064505 , we find the response from fluctuations to flip symmetry at from B1g () to B2g () while maintaining all other properties (see next section). is very close if not equal to . Since there is no sum rule in electronic Raman scattering, the response just pops up and is superposed on the particle-hole continuum. Hence, the initial slope does not track the relaxation rate of ordinary carriers but rather the characteristic energy of the fluctuation peaks. This explains why remains metallic for very low doping levels down to the lowest temperatures in spite of a non-metallic resistivity.
IV.3 Ordering fluctuations
The additional response from fluctuations due to incipient density-wave formation is found for LSCO in the doping range but not for the undoped sample (Fig. 11). Earlier, indications at 2 and 10% have been reported Venturini2002_P66_060502 ; Tassini2005_PRL95_117002 . Caprara and coworkers explained the spectra quantitatively in terms of Aslamazov-Larkin (AL) type diagrams where two fluctuations with opposite momenta are excited simultaneously Caprara2005_PRL95_117004 . In Y123, charge-ordering fluctuations were observed only in non-superconducting samples at low doping Tassini2008_PRB78_020511 , where only indirect support for ordering is found J'anossy2003_PRL91_177001 . Recently, an ordering instability in superconducting samples was suggested to be at the origin of the depression Liang2006_PRB73_180505 and of the new frequency in the SdH oscillations found close to 1/8 doping LeBoeuf2007_N450_533 ; Pfleiderer2007_N450_492 . Nevertheless, ordering in the compounds with high is much farther from being static than in LSCO or Tranquada2007__ ; Li2007_PRL99_067001 , and this may explain why no Raman response from fluctuations exists or can be resolved in superconducting Y123 or Bi2212.
In LSCO, the low energy AL-modes due to a density wave instability are present below (B2g) and above (B1g) the doping level at which superconductivity appears. Even if the fluctuation response flips symmetry at , the variation with temperature and doping remains essentially the same on either side of , i. e. the response is independent of the scattering channel in which it appears. The selection rules, which are better defined the more the system is ordered (compare Fig. 11, and the results on Y123 in Ref. Tassini2008_PRB78_020511 ), demonstrate that the underlying order is nematic Kivelson2003_RMP75_1201 ; Kivelson2006_NP5_343 ; Fradkin2009__ which means preferential but short ranged.
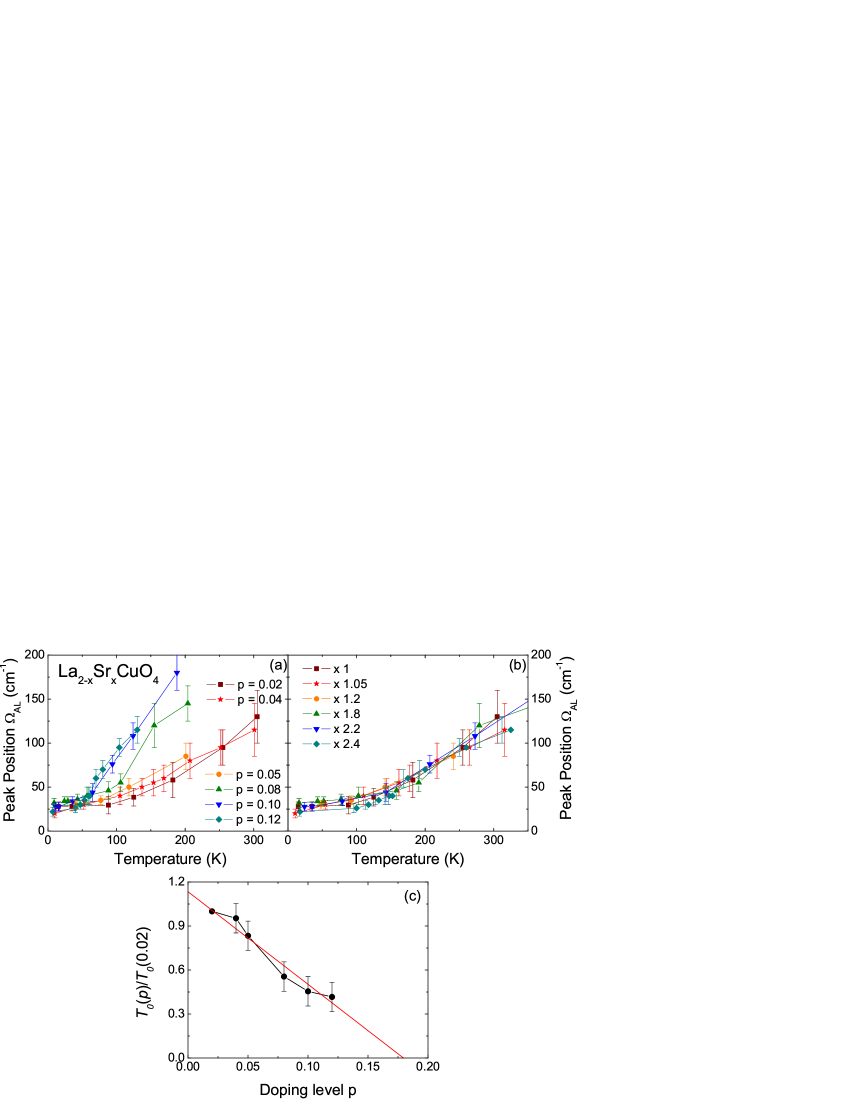
In Fig. 14 (a) we plot the peak energies of the fluctuation maxima as a function of temperature for various doping levels. At high doping, the response exists in smaller temperature ranges than at low doping. Similarly to Sugai and coworkers Sugai2006_PRL96_137003 , we do not observe a coexistence of the fluctuation and the superconducting coherence peaks [compare Fig. 11 panels (e)-(g)]. The characteristic energies of the modes decrease with decreasing temperature and saturate below some temperature in the range cm-1 for all doping levels. The crossover temperature marks the establishment of partial order.
The existence of a light scattering response well above distinguishes the AL-modes from the usual amplitude and phase modes Lee1974_SSC14_703 ; Gruner1994__ in density wave systems. The amplitude and phase modes originate from a coupling of the condensate’s phase and density fluctuations to the lattice distortion, and exhibit order parameterlike behavior with the opposite temperature dependence, i.e. the energy increases with decreasing temperature. We have shown recently for the 2D charge density wave (CDW) system DyTe3 that the amplitude mode becomes very broad with increasing temperature and disappears over a range of 1 K at the CDW transition Lavagnini2010_PRB81_081101 . (Similar results were obtained for K2SeO4 Lee1988_PRB37_6442 and other systems Gruner1994__ a while ago.) The phase mode has odd symmetry and cannot be observed by Raman scattering in systems with inversion symmetry. These considerations lead us to disagree with the interpretation of the low-energy response in terms of collective modes of the condensate (phase and amplitude mode) as proposed by Sugai and coworkers Sugai2006_PRL96_137003 . Actually, we found narrow modes only in disordered samples such as that at [Fig. 11 (e)] Fujita_008 .
In contrast to the phase and amplitude modes, the AL collective modes exist only above the transition and are expected to vanish if long-range order is being established. The finite intensity and energy we find at low temperature indicate the persistence of fluctuations in the limit , hence a transition from thermal to quantum fluctuations as is typical for a system close to a quantum critical point (QCP). The location of the QCP can be determined through a scaling argument. If we normalize the temperature scale in Fig. 14 (a) to the crossover temperature of every doping level , the temperature dependences of the AL peaks at all doping levels collapse on top of each other as shown in Fig. 14 (b). Since is ill defined, we instead use a dimensionless scaling factor which can be thought of as . For convenience, we stretch the temperature scale for samples at higher doping to match the results with those at , and therefore the scaling factor is . The scaling factors compiled in Fig. 14 (c) are plotted as and the figure clearly establishes a doping level where approaches zero. By the data a linear extrapolation is suggested and this predicts a quantum critical point at , close the level predicted by Andergassen and collaborators Andergassen2001_PRL87_056401 and seen in various other experiments Tallon2001_PC349_53 ; Billinge2003_IJMPB17_3640 .
IV.4 Phase diagram
The QCP is close to the doping level below which the superfluid density and coherence seem to decrease. Indications have been found in many experiments and have been summarized in, e.g., Refs. Tallon2001_PC349_53 ; Loram2004_PRB69_060502 . In our experiments, we derive the location of the QCP from the carrier dynamics. From a theoretical point of view, the response does not enter in lowest order but through a higher order process, the exchange of two fluctuations. This may, in an intuitive way, explain why the B1g Raman response from the anti-nodal part of the Brillouin zone but also other two-particle susceptibilities such as the NMR relaxation rate Alloul1989_PRL63_1700 ; Billinge2003_IJMPB17_3640 ; Gutmann2000__ get depressed or incoherent much earlier than the single-particle response Damascelli2003_RMP75_473 . We suggest that the suppression of the B1g coherence peaks in the superconducting state Opel2000_PRB61_9752 ; Nemetschek1997_PRL78_4837 ; Munnikes2007__ can also be traced back to fluctuations of incipient charge order. This, of course, implies that the fluctuations are also present in Y123 or Bi2212 with high even if they do not manifest themselves in an AL-type response at . However, fluctuations are found in various experiments in the static limit or, in most of the cases, in the inelastic channel Fujita2002_PRB65_064505 ; Kivelson2003_RMP75_1201 ; Cheong1991_PRL67_1791 ; Tranquada1995_N375_561 ; Bianconi1996_PRL76_3412 ; Tranquada2005__ ; Billinge2003_IJMPB17_3640 .
The phenomenology fits into the scenario proposed by Andergassen and coworkers Andergassen2001_PRL87_056401 on the basis of a Hubbard-Holstein model. They propose a phase diagram which shows a mean field transition at and a QCP at . At present we do not have the resolution in doping to pinpoint our crossover lines sufficiently precisely. However, it appears that is renormalized already at the mean field transition while the AL peaks appear only at .
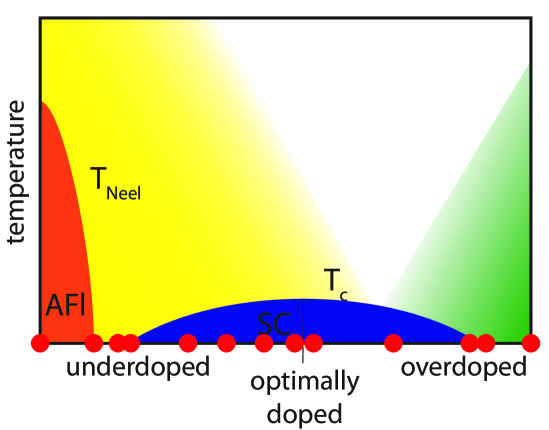
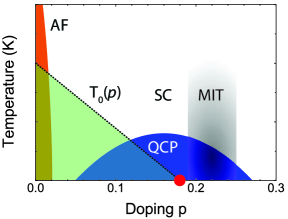
Fig. 15 shows the generic phase diagram of the cuprates including all transitions observed in the carrier dynamics by Raman scattering. A preliminary version has been published in Ref. Tassini2008_PRB78_020511 . The QCP is the point at which the ordering temperature extrapolates to zero. The vertical line at indicates the “unconventional metal-insulator transition” Venturini2002_PRL89_107003 where the dichotomy between the nodal and anti-nodal parts of the Fermi surface appears in Bi2212. The respective lines for LSCO and for Tl2201 are in the range and that of Y123 is at . Hence the region around marks the border of coherence beyond which the ground state is Fermi liquid like.
In Y123 we find a very pronounced transition between superconducting and non-superconducting samples at Tassini2008_PRB78_020511 . The two-magnon energy and width, the electronic continuum, the AL response, and the oxygen buckling mode at 340 cm-1 all change abruptly (on the scale of the limited doping resolution we presently have), suggesting a first-order transition. This implies the coexistence of competing phases and favors a phase separation scenario Fradkin2009__ ; Grilli1991_PRL67_259 ; Carlson2002__ at the lower onset point of superconductivity . Below there is AF order which is suppressed in a continuous fashion. This can be derived directly from the essentially constant two-magnon energy (Fig. 13) in the range . As soon as carriers are introduced in this doping range they cluster and apparently form stripes and nematic order Fradkin2009__ . Above the order is oriented differently. Only in LSCO do we find clear indications for a diagonal pattern. In Y123 and perhaps also in Bi2212 there are only indirect indications such as increased magnon and phonon damping, all in B1g symmetry, which would be compatible with diagonal or checkerboard-type order. Given the assumption that long-range density wave order and superconductivity are mutually exclusive, the suppressed of LSCO would just be a result of a closer proximity to the CDW ordered state.
The last pivotal point in the phase diagram is on the overdoped side where superconductivity disappears, . Wakimoto et al. Wakimoto2004_PRL92_217004 found the incommensurate spin order also to disappear there. If one examines the B1g gap maxima on the overdoped side of the phase diagram Hackl2005_45_227 ; Venturini2002_PRL89_107003 ; Munnikes2007__ ; Kendziora1995_PRB52_9867 ; Sugai2000_PRL85_1112 ; LeTacon2006_NP2_537 , it becomes clear that the intensity increases beyond , which can hardly be traced back to coherence. Actually, the increase is so fast that a divergence point may be anticipated. To explore this possibility Munnikes and coworkers Munnikes2007__ plot the inverse of the B1g intensity, finding a divergence point at , which is close to . If this were the case the B1g Raman response in the superconducting state would not just reflect the maximum gap but rather a superposition of the pair-breaking maximum and a mode related to a symmetry broken at .
V Conclusions
In this publication we focussed on generic properties of hole-doped cuprates as seen by Raman scattering.
At energies above 1000 cm-1 the Raman response generally increases with energy. However, the electronic continua lose intensity with doping in all symmetries and all compounds. The synopsis of various compounds and the analysis of extrinsic effects allow us to conclude that the increase of the spectra towards high energies is an intrinsic property which has its origin in either the strong correlations in the cuprates or in the coupling between electrons and high-energy fluctuations from spin and/or charge ordering. Since the selection rules for spin excitations are still effective and the two-magnon peaks can be resolved up to , the clusters of spins must be substantially larger than the lattice constant, i.e. the correlation of just two nearest neighbor spins can be excluded for doping levels below 20%.
The low energy continuum in B1g symmetry experiences a transition from spin-dominated close to zero doping to charge-dominated above . Here, around optimal doping, we find changes in the carrier dynamics in many observables. The ratio of the B1g to the B2g overall intensity and the transition between a metallic and an insulating temperature dependence of the B1g carrier dynamics are the most remarkable two. In underdoped La2-xSrxCuO4 we find a response which, based on its temperature and frequency dependence, can be traced back to density wave fluctuations. The symmetry selection rules as obtained from the theoretical calculations Caprara2005_PRL95_117004 and the change from B2g to B1g symmetry upon crossing lead us to conclude that charge ordering is at the origin of this response. Surprisingly, the change of symmetry does not noticeably affect the overall variation with temperature, which fits with the scenario of critical fluctuations around a quantum critical point at , conspicuously close to the “unconventional metal-insulator transition” found universally for all cuprates in the range . Apparently, coherence at the antinodal points is lost very rapidly below this doping. To what extent the same fluctuations are also responsible for the pairing still cannot be answered. However, the first-order like changes of practically all excitations at suggest strong interactions between carriers and both spin and charge fluctuations.
Acknowledgements
We profited immensely from discussions with S. Caprara, T. P. Devereaux, C. Di Castro, M. Grilli, S. Kivelson, and J. Tranquada. This work has been supported by the DFG via Research Unit FOR 538 (grant-nos. Ha2071/3 and Er342/1). B.M. and R.H. gratefully acknowledge support by the Bavarian Californian Technology Center (BaCaTeC). Y.A. is supported by KAKENHI 20030004 and 19674002. D.P., R.L., D.B., and W.H. were supported by NSERC Canada.
References
- (1) J.G. Bednorz, K.A. Müller, Z. Phys. B 64, 189 (1986)
- (2) C.C. Tsuei, J.R. Kirtley, Rev. Mod. Phys. 72, 969 (2000)
- (3) A. Damascelli, Z. Hussain, Z.X. Shen, Rev. Mod. Phys. 75, 473 (2003)
- (4) H. Alloul, T. Ohno, P. Mendels, Phys. Rev. Lett. 63, 1700 (1989)
- (5) M.R. Norman, D. Pines, C. Kallin, Adv. Phys. 54, 715 (2005)
- (6) T. Devereaux, R. Hackl, Rev. Mod. Phys. 79, 175 (2007)
- (7) R. Hackl, W. Gläser, P. Müller, D. Einzel, K. Andres, Phys. Rev. B 38, 7133 (1988)
- (8) S.L. Cooper, F. Slakey, M.V. Klein, J.P. Rice, E.D. Bukowski, D.M. Ginsberg, Phys. Rev. B 38, 11934 (1988)
- (9) H. Monien, A. Zawadowski, Phys. Rev. Lett. 63, 911 (1989)
- (10) T. Staufer, R. Hackl, P. Müller, Solid State Commun. 75, 975 (1990)
- (11) F. Slakey, M.V. Klein, J.P. Rice, D.M. Ginsberg, Phys. Rev. B 43, 3764 (1991)
- (12) T.P. Devereaux, D. Einzel, B. Stadlober, R. Hackl, D.H. Leach, J.J. Neumeier, Phys. Rev. Lett. 72, 396 (1994)
- (13) W. Prestel et al. this volume
- (14) F. Venturini, Q.M. Zhang, R. Hackl, A. Lucarelli, S. Lupi, M. Ortolani, P. Calvani, N. Kikugawa, T. Fujita, Phys. Rev. B 66, 060502 (2002)
- (15) L. Tassini, F. Venturini, Q.M. Zhang, R. Hackl, N. Kikugawa, T. Fujita, Phys. Rev. Lett. 95, 117002 (2005)
- (16) L. Tassini, W. Prestel, A. Erb, M. Lambacher, R. Hackl, Phys. Rev. B 78, 020511 (2008)
- (17) S. Caprara, C.D. Castro, M. Grilli, D. Suppa, Phys. Rev. Lett. 95, 117004 (2005)
- (18) M. Fujita, K. Yamada, H. Hiraka, P.M. Gehring, S.H. Lee, S. Wakimoto, G. Shirane, Phys. Rev. B 65, 064505 (2002)
- (19) S.A. Kivelson, I.P. Bindloss, E. Fradkin, V. Oganesyan, J.M. Tranquada, A. Kapitulnik, C. Howald, Rev. Mod. Phys. 75, 1201 (2003)
- (20) D. Reznik, S.L. Cooper, M.V. Klein, W.C. Lee, D.M. Ginsberg, A.A. Maksimov, A.V. Puchkov, I.I. Tartakovskii, S.W. Cheong, Phys. Rev. B 48, 7624 (1993)
- (21) A. Erb, E. Walker, R. Flükiger, Physica C 245, 245 (1995)
- (22) Y. Ando, G.S. Boebinger, A. Passner, T. Kimura, K. Kishio, Phys. Rev. Lett. 75, 4662 (1995)
- (23) Y. Ando, G.S. Boebinger, A. Passner, N.L. Wang, C. Geibel, F. Steglich, Phys. Rev. Lett. 77, 2065 (1996)
- (24) Y. Ando, G.S. Boebinger, A. Passner, N.L. Wang, C. Geibel, F. Steglich, I.E. Trofimov, F.F. Balakirev, Phys. Rev. B 56, 8530 (1997)
- (25) H. Eisaki, N. Kaneko, D.L. Feng, A. Damascelli, P.K. Mang, K.M. Shen, Z.X. Shen, M. Greven, Phys. Rev. B 69, 064512 (2004)
- (26) D. Peets, R. Liang, M. Raudsepp, W. Hardy, D. Bonn, J. Cryst. Growth 312, 344 (2010)
- (27) L. Tassini, Ph.D. thesis, Technische Universität München (2008)
- (28) R. Hackl, L. Tassini, F. Venturini, C. Hartinger, A. Erb, N. Kikugawa, T. Fujita, Ordering phenomena in cuprates, Vol. 45 (Advances in Solid State Physics, 2005)
- (29) R. Hackl, L. Tassini, F. Venturini, A. Erb, C. Hartinger, N. Kikugawa, T. Fujita, J. Phys. Chem. Solids 67, 289 (2006)
- (30) A. Erb et al. this volume
- (31) M. Fujita, private communication
- (32) G. Turrell, Infrared and Raman spectra of Crystals (Academic Press inc., London and New York, 1972)
- (33) F. Venturini, M. Opel, T.P. Devereaux, J.K. Freericks, I. Tüttő, B. Revaz, E. Walker, H. Berger, L. Forró, R. Hackl, Phys. Rev. Lett. 89, 107003 (2002)
- (34) S. Blanc et al., Phys. Rev. B 80, (2009) 140502(R).
- (35) T. Yoshida, X.J. Zhou, K. Tanaka, W.L. Yang, Z. Hussain, Z.X. Shen, A. Fujimori, S. Sahrakorpi, M. Lindroos, R.S. Markiewicz et al., Phys. Rev. B 74, 224510 (2006)
- (36) P.E. Sulewski, P.A. Fleury, K.B. Lyons, S.W. Cheong, Phys. Rev. Lett. 67, 3864 (1991)
- (37) S. Sugai, S.i. Shamoto, M. Sato, Phys. Rev. B 38, 6436 (1988)
- (38) G. Blumberg, R. Liu, M.V. Klein, W.C. Lee, D.M. Ginsberg, C. Gu, B.W. Veal, B. Dabrowski, Phys. Rev. B 49, 13295 (1994)
- (39) G. Blumberg, P. Abbamonte, M.V. Klein, W.C. Lee, D.M. Ginsberg, L.L. Miller, A. Zibold, Phys. Rev. B 53, 11930 (1996)
- (40) S. Sugai, H. Suzuki, Y. Takayanagi, T. Hosokawa, N. Hayamizu, Phys. Rev. B 68, 184504 (2003)
- (41) A. Gozar, S. Komiya, Y. Ando, G. Blumberg, Magnetic and Charge Correlations in La2-x-yNdySrxCuO4: Raman Scattering Study (Frontiers in Magnetic Materials, 2005)
- (42) S. Sugai, Phys. Rev. B 39, 4306 (1989)
- (43) M. Opel, R. Nemetschek, C. Hoffmann, R. Philipp, P.F. Müller, R. Hackl, I. Tüttő, A. Erb, B. Revaz, E. Walker, Phys. Rev. B 61, 9752 (2000)
- (44) D. Einzel, R. Hackl, J. Raman Spectrosc. 27, 307 (1996)
- (45) T. Katsufuji, Y. Tokura, T. Ido, S. Uchida, Phys. Rev. B 48, 16131 (1993)
- (46) J.G. Naeini, X.K. Chen, J.C. Irwin, M. Okuya, T. Kimura, K. Kishio, Phys. Rev. B 59, 9642 (1999)
- (47) M. Opel, M. Götzinger, C. Hoffmann, R. Nemetschek, R. Philipp, F. Venturini, R. Hackl, A. Erb, E. Walker, J. Low Temp. Phys. 117, 347 (1999)
- (48) M. Opel, R. Hackl, T. P. Devereaux, A. Virosztek, A. Zawadowski, A. Erb, E. Walker, H. Berger, L. Forró, Phys. Rev. B 60, 9836 (1999)
- (49) T. Zhou, K. Syassen, M. Cardona, J. Karpinski, E. Kaldis, Solid State Commun. 99, 669 (1996)
- (50) M. Dumm, D.N. Basov, Seiki Komiya, Yasushi Abe, Yoichi Ando, Phys. Rev. Lett. 88, 147003 (2003)
- (51) J.Y.P. Delannoy, M.J.P. Gingras, P.C.W. Holdsworth, A.M.S. Tremblay, Phys. Rev. B 72, 115114 (2005)
- (52) F.H. Vernay, M.J.P. Gingras, T.P. Devereaux, Phys. Rev. B 75, 020403 (2007)
- (53) K.B. Lyons, P.A. Fleury, L.F. Schneemeyer, J.V. Waszczak, Phys. Rev. Lett. 60, 732 (1988)
- (54) M. Rübhausen, O.A. Hammerstein, A. Bock, U. Merkt, C.T. Rieck, P. Guptasarma, D.G. Hinks, M.V. Klein, Phys. Rev. Lett. 82, 5349 (1999)
- (55) S. Wakimoto, H. Zhang, K. Yamada, I. Swainson, H. Kim, R.J. Birgeneau, Phys. Rev. Lett. 92, 217004 (2004)
- (56) M. Opel, Dissertation, Technische Universität München (2000)
- (57) S. Nakamae, K. Behnia, N. Mangkorntong, M. Nohara, H. Takagi, S.J.C. Yates, N.E. Hussey, Phys. Rev. B 68, 100502 (2003)
- (58) S. Andergassen, S. Caprara, C. Di Castro, M. Grilli, Phys. Rev. Lett. 87, 056401 (2001)
- (59) J. Chang, M. Shi, S. Pailhés, M. Månsson, T. Claesson, O. Tjernberg, A. Bendounan, Y. Sassa, L. Patthey, N. Momono et al., Phys. Rev. B 78, 205103 (2008)
- (60) G.S. Boebinger, Y. Ando, A. Passner, T. Kimura, M. Okuya, J. Shimoyama, K. Kishio, K. Tamasaku, N. Ichikawa, S. Uchida, Phys. Rev. Lett. 77, 5417 (1996)
- (61) D.N. Basov, T. Timusk, Rev. Mod. Phys. 77, 721 (2005)
- (62) A.V. Puchkov, D.N. Basov, T. Timusk, J. Phys.: Condens. Matter 8, 10049 (1996)
- (63) S.W. Cheong, G. Aeppli, T.E. Mason, H. Mook, S.M. Hayden, P.C. Canfield, Z. Fisk, K.N. Clausen, J.L. Martinez, Phys. Rev. Lett. 67, 1791 (1991)
- (64) J. Tranquada, B. Sternlieb, J. Axe, Y. Nakamura, S. Uchida, Nature 375, 561 (1995)
- (65) A. Bianconi, N.L. Saini, A. Lanzara, M. Missori, T. Rossetti, H. Oyanagi, H. Yamaguchi, K. Oka, T. Ito, Phys. Rev. Lett. 76, 3412 (1996)
- (66) J.M. Tranquada, Neutron Scattering Studies of Antiferromagnetic Correlations in Cuprates (Treatise of High Temperature Superconductivity, 2005)
- (67) A. Jánossy, T. Fehér, A. Erb, Phys. Rev. Lett. 91, 177001 (2003)
- (68) R. Liang, D.A. Bonn, W.N. Hardy, Phys. Rev. B 73, 180505 (2006)
- (69) D. LeBoeuf, N. Doiron-Leyraud, J. Levallois, R. Daou, J.B. Bonnemaison, N.E. Hussey, L. Balicas, B.J. Ramshaw, R. Liang, D.A. Bonn et al., Nature 450, 533 (2007)
- (70) C. Pfleiderer, R. Hackl, Nature 450, 492 (2007)
- (71) J. Tranquada, Treatise of Superconductivity (Springer Verlag, Berlin - Heidelberg, 2007)
- (72) Q. Li, M. Hucker, G.D. Gu, A.M. Tsvelik, J.M. Tranquada, Phys. Rev. Lett. 99, 067001 (2007)
- (73) S.A. Kivelson, Nat. Phys. 5, 343 (2006)
- (74) E. Fradkin, S.A. Kivelson, M.J. Lawler, J.P. Eisenstein, A.P. Mackenzie (2009), preprint at arXiv:0910.4166v2
- (75) S. Sugai, Y. Takayanagi, N. Hayamizu, Phys. Rev. Lett. 96, 137003 (2006)
- (76) P. Lee, T. Rice, P. Anderson, Solid State Commun. 14, 703 (1974)
- (77) G. Grüner, Density Waves in Solids (Addison-Wesley, 1994)
- (78) M. Lavagnini, H. M. Eiter, L. Tassini, B. Muschler, R. Hackl, R. Monnier, J.H. Chu, I. R. Fisher, L. Degiorgi, Phys. Rev. B 81, 081101 (2010)
- (79) W.K. Lee, H.Z. Cummins, R.M. Pick, C. Dreyfus, Phys. Rev. B 37, 6442 (1988)
- (80) Concerning the mosaic spread and the width of the superconducting transition, the sample at 8% doping is the most disordered one we used. (T. Fujita, private communication) It has the strongest contribution from extra lines superposed on a broader continuum.
- (81) J.L. Tallon, J.W. Loram, Physica C 349, 53 (2001)
- (82) S. Billinge, M. Gutmann, E. Božin, Int. J. Mod. Phys. B 17, 3640 (2003)
- (83) J.W. Loram, J.L. Tallon, W.Y. Liang, Phys. Rev. B 69, 060502 (2004)
- (84) M. Gutmann, E. Bozin, S. Billinge (2000), preprint at arXiv:cond-mat/0009141v2
- (85) R. Nemetschek, M. Opel, C. Hoffmann, P.F. Müller, R. Hackl, H. Berger, L. Forró, A. Erb, E. Walker, Phys. Rev. Lett. 78, 4837 (1997)
- (86) N. Munnikes, B. Muschler, F. Venturini, L. Tassini, W. Prestel, S. Ono, Y. Ando, A. Damascelli, A. Erb, R. Hackl (2009), preprint at arXiv:0901.3448
- (87) M. Grilli, R. Raimondi, C. Castellani, C. Di Castro, G. Kotliar, Phys. Rev. Lett. 67, 259 (1991)
- (88) E. Carlson, V. Emery, S. Kivelson, D. Orgad, The Physics of Conventional and Unconventional Superconductors (K. H. Bennemann and J. B. Ketterson, 2002)
- (89) C. Kendziora, A. Rosenberg, Phys. Rev. B 52, 9867 (1995)
- (90) S. Sugai, T. Hosokawa, Phys. Rev. Lett. 85, 1112 (2000)
- (91) M. LeTacon, A. Sacuto, A. Georges, G. Kotliar, Y. Gallais, D. Colson, A. Forget, Nat. Phys. 2, 537 (2006)