The Megaparsec-Scale X-ray Jet of the BL Lac Object OJ287
Abstract
We present an X-ray image of the BL Lacertae object OJ287 revealing a long jet, curved by and extending , or 90 kpc from the nucleus. This de-projects to Mpc based on the viewing angle on parsec scales. Radio emission follows the general X-ray morphology but extends even farther from the nucleus. The upper limit to the isotropic radio luminosity, W Hz-1, places the source in the Fanaroff-Riley 1 (FR 1) class, as expected for BL Lac objects. The spectral energy distribution indicates that the extended X-ray emission is from inverse Compton scattering of cosmic microwave background photons. In this case, the derived magnetic field is G, the minimum electron energy is 7-40, and the Doppler factor is in a knot from the nucleus. The minimum total kinetic power of the jet is 1-2 erg s-1. Upstream of the bend, the width of the X-ray emission in the jet is about half the projected distance from the nucleus. This implies that the highly relativistic bulk motion is not limited to an extremely thin spine, as has been proposed previously for FR 1 sources. The bending of the jet, the deceleration of the flow from parsec to kiloparsec scales, and the knotty structure can all be caused by standing shocks inclined by to the jet axis. Moving shocks resulting from major changes in the flow properties can also reproduce the knotty structure, but such a model does not explain as many of the observational details.
1 Introduction
According to the unified scheme of extragalactic radio sources, BL Lacertae (BL Lac) objects represent Fanaroff-Riley 1 (FR 1; Fanaroff & Riley, 1974) radio galaxies in which one of the jets points within of the line of sight (Antonucci & Ulvestad, 1985; Padovani & Urry, 1990). Based on a careful analysis of the radio jets of 38 radio sources, Laing et al. (1999) inferred that the bulk flow of a typical FR 1 jet decelerates from a relativistic speed to less than within a distance of two to tens of kpc from the nucleus. The inferred deceleration agrees with the expectations of a model in which the jet entrains material from its surroundings (Bicknell, 1994; Laing, 1996). The distance from the nucleus over which the deceleration occurs is then expected to increase with the kinetic power of the jet. It should therefore be greater at higher values of both the initial bulk Lorentz factor and the luminosity of extended emission. Laing et al. (1999) also found that the data are consistent with a model in which the velocity of the flow decreases from the axis to the edge of the jet, either gradually or in a more distinct manner, as a spine plus sheath. Chiaberge et al. (2000) came to the same conclusion based on a comparison of BL Lac and FR I core spectral energy distributions. Some jet launching models include an ultra-fast spine produced by the ergosphere of a rotating black hole, with the slower sheath emanating from the accretion disk (e.g., Punsly, 1996; McKinney, 2006). Alternatively, Meier (2003) proposed that the spine is generated by the central engine, while the sheath arises from velocity shear downstream.
The proposed deceleration of jets could reconcile gross discrepancies between inferred bulk Lorentz factors of the BL Lac and FR I populations. Urry, Padovani, & Stickel (1991) concluded that the properties of BL Lac objects require the values of of the FR I parent population to range up to . There is independent support for this conclusion: measurements of proper motions of -ray bright BL Lacs by Jorstad et al. (2001) indicate apparent speeds (and therefore minimum values of ) as high as .
The extended X-ray emission from low-power FR 1 radio galaxy jets is consistent with synchrotron radiation within the inner 10 kpc by electrons with energies in the 10-100 TeV range (Worrall, Birkinshaw, & Hardcastle, 2001; Kataoka & Stawarz, 2005). Those that are more luminous, highly relativistic, and pointing close to the line of sight — characteristics of radio-bright BL Lac objects — can also produce observable X-rays from inverse Compton scattering off the microwave background (IC/CMB; Tavecchio et al., 2000; Celotti, Ghisellini, & Chiaberge, 2001; Sambruna et al., 2001) on scales of tens or hundreds of kiloparsecs. The total energy requirements are higher in the IC/CMB case owing to the radiative inefficiency of low-energy electrons (Dermer & Atoyan, 2004). This has led to a controversy over the process by which X-ray emission is produced in the jets of quasars and BL Lac objects with highly relativistic jets.
Until now, observations that provide information on deceleration, spine-sheath structure, and X-ray emission have been limited to FR 1 radio galaxies that are not BL Lac objects (e.g., Worrall, Birkinshaw, & Hardcastle, 2001), three BL Lac objects with mixed FR 1 and FR 2 morphologies (Sambruna et al., 2007, 2008), and blazar-class quasars with powerful, highly relativistic jets (e.g., Jorstad & Marscher, 2004; Harris & Krawczynski, 2006). The extended X-ray emission of low-power, high- BL Lac objects has been less well studied. Such jets should radiate at X-ray energies via the IC/CMB and/or synchrotron process, with the emission gradually becoming weaker with distance from the nucleus as the jet decelerates. Because of the low power of the jet as determined by the luminosity of the extended emission, the IC/CMB process can be eliminated as a major contributor to the X-ray emission if the total energy requirement is too high, as is the case for some quasars (Dermer & Atoyan, 2004). Furthermore, if the jet possesses a spine-sheath structure, the IC/CMB emission should arise only in the narrow, highly relativistic spine.
In order to explore the low-power, high- case, we have carried out multi-waveband imaging of the jet of the BL Lac object OJ287 with the Chandra X-ray Observatory (CXO), Hubble Space Telescope (HST), Spitzer Space Telescope (SST), and Very Large Array (VLA). We report here the detection of X-ray emission along a length of the jet extending kpc from nucleus in projection, and more than 1 Mpc after de-projection. The X-ray emission, which has a somewhat knotty structure, is resolved in the transverse direction and fades gradually with distance from the nucleus, as does the radio emission. The radio and X-ray fluxes, along with upper limits at infrared and optical wavelengths, provide a spectral energy distribution that strongly constrains the emission model.
We discuss the observations in §2 and analyze the results in §3. §4 contains our interpretation of the observations and discusses the implications for extended jets, while §5 presents our main conclusions. In this study, we adopt the current standard flat-spacetime cosmology, with Hubble constant =71 km s-1 Mpc-1, , and . At a redshift , OJ287 has a luminosity distance = 1.58 Gpc, and corresponds to a projected distance of 4.48 kpc in the rest frame of the host galaxy of OJ287.
2 Observations and Data Analysis
Table 1 lists the main information about the CXO, HST, SST, and VLA observations of OJ287. The VLA data include both a new observation at a wavelength of 2 cm and archival data at 6 and 21 cm.
2.1 X-Ray Observations
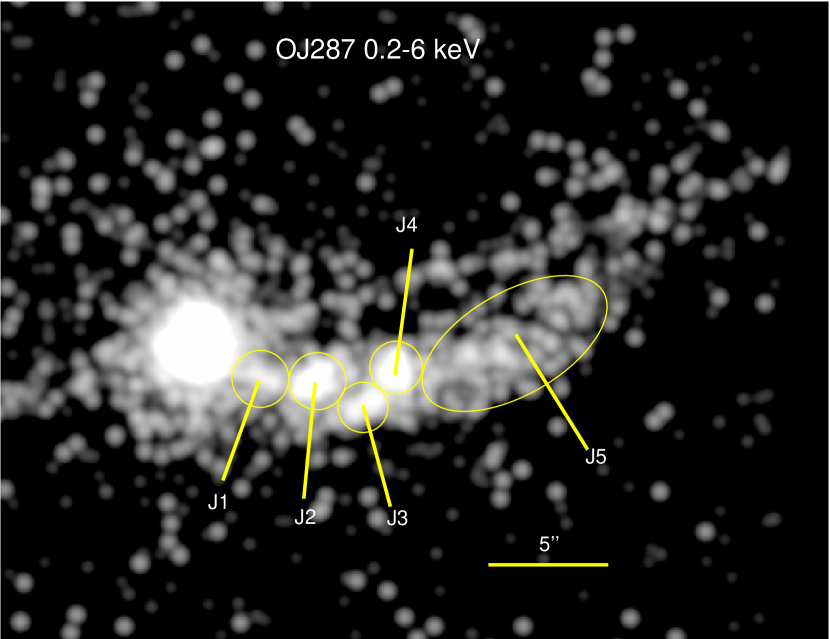
We observed OJ287 using the back-illuminated S3 chip of the Advanced Camera for Imaging and Spectroscopy (ACIS) on CXO and a 1/8 subarray to reduce the frame time to 0.4 s. The data analysis, which utilized version 3.3.0 of the CIAO software and version 3.2.4 of CALDB, followed the procedures detailed in Jorstad & Marscher (2004). We generated a new level 2 event file with a pixel size of and convolved the image with a FWHM circular Gaussian kernel corresponding to the angular resolution of the ACIS. The resulting image (Fig. 1) shows a prominent jet that extends out to from the nucleus. The direction of the jet changes by from the straight inner section within of the core to the end of the X-ray emission. The jet has a knotty structure, which we separate into five regions, . All knots are detected at a level of 10 or higher relative to the background.
We fit the spectral data for the jet in the photon energy range 0.2-6 keV by a power-law model with fixed Galactic absorption cm-2 (Dickey & Lockman, 1990). (Allowing the column density to vary yields a value that is not significantly different from this.) The calculated parameters of the X-ray jet are given in Table 2.
2.2 Optical Observations
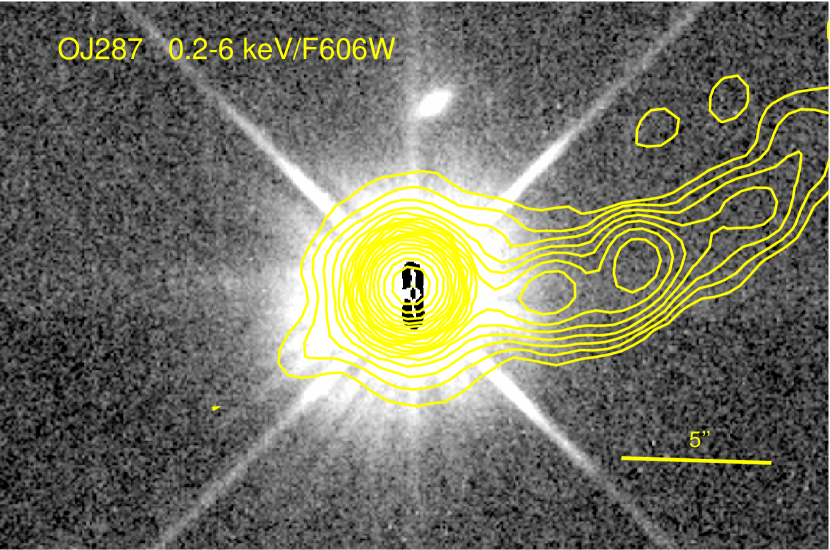
Over two orbits of HST, we obtained 12 exposures of 230 sec each of OJ287 with the WFPC2 PC-chip using the broad filter F606W in a 4-point dithering mode. The images were combined with task crrej within the STSDAS software package. We generated the point-spread function (PSF) with the TinyTim software and subtracted it from the combined image. The deconvolved image is displayed in Figure 2. We did not detect significant flux over the sky level along the position of the X-ray and radio jet. Yanny, Jannuzi, & Impey (1997) also did not detect the jet at 814 nm with the WFPC2, and found that emission from nebulosity associated with the host galaxy is insignificant beyond from the nucleus.
2.3 Infrared Observations
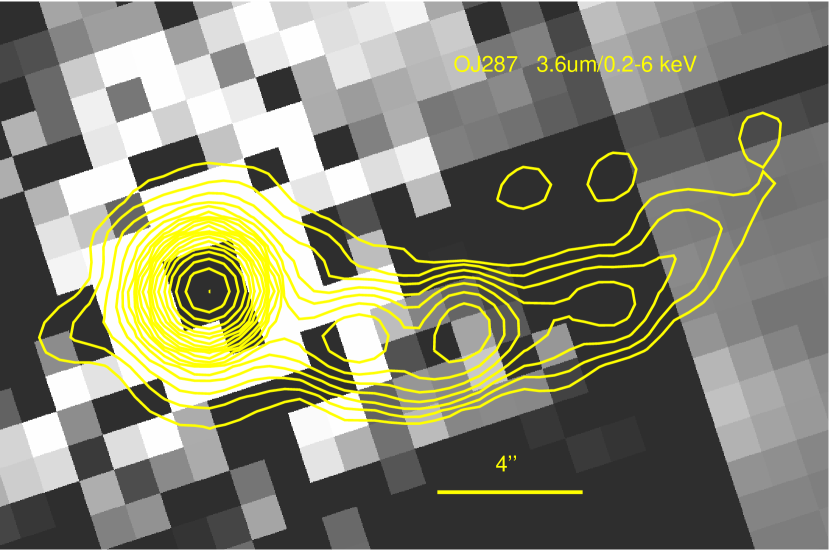
We observed OJ287 with IRAC on SST at 3.6 and 5.8 m with a single frame exposure of 12 s in a dithering mode (36 Positions Reuleaux). We used the Level 2 Post-BCD Pipeline images, which we checked for artifacts. We created the PSF at each infrared (IR) wavelength using image stars, then subtracted it from the image with the task apex_qa_1frame.pl of version 18.3.1 of the MOPEX/APEX software package. Figure 3 displays the deconvolved image at 3.6 m, which reveals some enhanced brightness in the jet direction, especially in the regions of knots and . However, the fluxes are at 1-2 detection level owing to possible confusion with unrelated IR sources, hence we cannot ascertain that the emission is physically associated with the jet. We therefore use the measured fluxes (plus the 2- uncertainties) to estimate the IR upper limits for the jet regions.
2.4 Radio Observations
We processed the VLA data with the Astronomical Image Processing System (AIPS) software provided by the National Radio Astronomy Observatory (NRAO), following the standard procedures outlined in the AIPS Cookbook available at www.nrao.edu. (The observations at 15 GHz included only 15 of the usual 27 antennas, since they occurred during the changeover to the new EVLA.) Each observation employed two 50 MHz bands, centered on 1.3851, 1.4649 GHz (21 cm wavelength), 4.5351, 4.8851 GHz (6 cm), and 14.915, 14.965 GHz (2 cm), with mean frequencies listed in Table 1. We performed the imaging with the Difmap software (Shepherd, 1997), again following standard procedures. Figure 4 presents all three radio images, while Table 2 gives the parameters of the radio emission. The image at 1.425 GHz is very similar to the full-resolution version presented by Perlman & Stocke (1994), which was based on the same data.
3 Observational Results
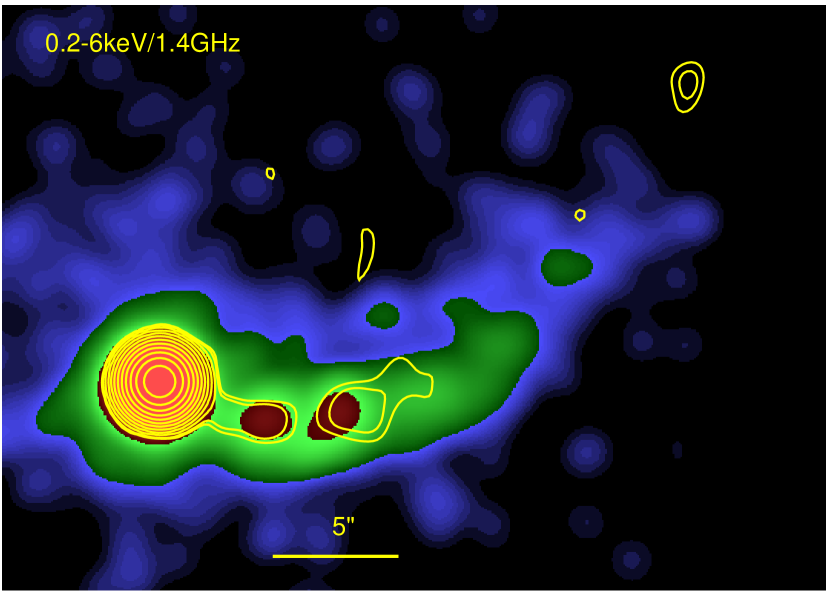
Figure 5 displays the entire jet at both radio and X-ray frequencies. The radio and X-ray emission is generally coincident within of the nucleus, beyond which the radio emission falls below the detection limit. An exception is knot J3, situated along the southern rim of the jet with centroid from the nucleus, where we detect no radio emission above the noise level. Because of the low radio flux, we cannot reliably determine the flux density separately at 4.7 or 14.9 GHz for each knot denoted in Figure 1. We therefore measure these quantities only for the entire extended jet from knot J1 to J5, with the values given in Table 2.
3.1 Comparison of X-ray and Radio Emission
Figure 6 marks the jet axis (which traces the mid-point of the detected X-ray emission transverse to the axis) and three crosscuts that pass through knots , , and . In Figure 7 we plot both the X-ray and radio intensity profiles along the jet axis, and only the transverse X-ray profile along the crosscuts. The path along the axis misses knot J3, which lies along the southern boundary of the jet, but crosscut b includes the knot. Knots J1, J2, and J4 are clearly seen in the axial profile, while crosscut a passes through knot J2 and c includes J4. The maximum X-ray intensity lies farther from the nucleus than does the radio peak in both J1 and J2 by and , respectively, while the peaks at the two wavebands coincide in knot J4. In each case, however, the upstream boundaries of the radio and X-ray emission coincide.
The displacement of the intensity peaks of knots J2-J4 from the axis (defined as the centroid of the detectable X-ray emission across the jet) seen in Figures 1 and 7 is striking. On the other hand, the intensity along the axis is too strong to consider the jet to be edge-brightened.
The spectral index of the radio emission from the jet, integrated over the region containing detectable X-ray flux, is (radio). This differs somewhat from the X-ray value, (X-ray). The discrepancy could be due to a gradient in X-ray spectral index, which increases with distance from the nucleus from knots J2 to J4. We note that the overall radio spectral index falls within the 1- range of the X-ray spectral index for all knots except J2. Given this, and because we can only determine the overall radio spectral index, we will ignore the small apparent radio/X-ray discrepancy in spectral slope and adopt a value in our analysis.
The radio emission on milliarcsecond scales consists of a bright “core” with multiple knots — some with apparent superluminal motion and others that are subluminal or even stationary — lined up along position angles that vary with time. These cover a range over more than (Tateyama & Kingham, 2004; Agudo et al., 2010), which is amplified by projection effects owing to the small angle of the compact jet to the line of sight, Jorstad et al. (2005). The mean over a 7.5-year period was (measured from north, with defined as due west) (Tateyama & Kingham, 2004), while the mean position angle of the X-ray jet within of the nucleus is . This implies that, independent of the direction of motion on parsec scales, the flow bends to collimate along a well-defined direction on kiloparsec scales, as has been observed directly in 3C 279 (Homan et al., 2003).
3.2 Upper Limit to Unbeamed Radio Luminosity
The parsec-scale superluminal motion, with apparent velocities as high as (Jorstad et al., 2005), indicates that bulk motions in the jet are highly relativistic inside the nucleus. Jorstad et al. (2005) combined the apparent speeds with the rate of decline of flux of moving knots to derive a Doppler factor , a bulk Lorentz factor , and an angle between the axis and line of sight of for the compact jet. The one-sidedness of the extended X-ray and radio emission implies that relativistic bulk motion continues at least out to an angular distance of from the nucleus.
We cannot determine whether any of the radio emission that we detect is unbeamed. However, given the limit to the sensitivity of our radio images, it is possible that the two outermost features seen in Figure 5 are located in a very faint lobe or other region where there is only non-relativistic bulk flow. We measure a flux density at 1.425 GHz from this region to be mJy, which gives a 2- upper limit to the unbeamed extended radio power at 1.4 GHz of W Hz-1. We therefore confirm that this BL Lac object is within the luminosity range expected for FR 1 radio sources (Fanaroff & Riley, 1974).
3.3 Spectral Energy Distribution
Figure 8 presents the multifrequency continuum spectrum of the extended jet. The measurements include the entire length of the detected extended X-ray jet, i.e., from to from the nucleus in order to provide a signal-to-noise ratio at 4.7 and 14.9 GHz sufficiently high for analysis and to allow comparison with the low-resolution IR images. The figure reveals that the X-ray emission lies slightly above an extrapolation of the radio spectrum, while the 3.6m IR and 600 nm optical upper limits fall well below the extrapolation. In fact, the 600 nm upper limit is comparable to the X-ray flux measurement. This is contrary to models in which the X-rays arise from synchrotron radiation from electrons with energies in the TeV range. In such models (Dermer & Atoyan, 2002, 2004; Jester et al., 2006; Uchiyama et al., 2006), the value of (X-ray) can exceed (opt), but the flux densities cannot unless the electron energy spectrum is extraordinarily shallow, with , where is the electron energy in units of . In this case, essentially all of the electron energy would be confined to TeV energies. Furthermore, the spectral index in the X-ray region should then be , while our measured value is significantly higher.
Having eliminated the synchrotron model, we construct the SED for the alternative model, IC/CMB, by integrating over both the electron energy distribution [assumed to be of the form ] and the spectrum of the CMB to calculate the X-ray flux density as a function of photon energy. In order to avoid violating the upper limit at 600 nm, we cut off the electron energy distribution below an energy . We present two SEDs for this model in Figure 8, representing the lowest and highest allowed values of the product that provide good fits to the observed SED.
4 Discussion
4.1 Physical Parameters of the Extended Jet
We use the formulas derived in the Appendix of Jorstad & Marscher (2004) to determine the physical parameters of the extended jet of OJ287 under the assumptions that the X-ray emission is from the IC/CMB process and that the magnetic and particle energy densities are equal, with random kinetic energies of the protons and electrons each contributing 25% of the total energy density. We do this for knot J4, from the nucleus, which is well resolved from the other features in both the X-ray and radio images. The knot is nearly circular (see Fig. 1), with a mean extent of . We assume that the radio and X-ray spectral indices are the same, and carry out the calculations for the value that is most consistent with the data at both wavebands, .
The above values of and , plus the flux densities listed in Table 2 yield a Doppler factor and magnetic field G for the case that represents the leftmost curve in Figure 8, while for the rightmost curve , G, and . In order to derive the minimum total jet power, we assume equipartition between the magnetic and electron energy densities. We then multiply the magnetic energy density by times the square of the luminosity distance, the cross-sectional area and speed () of the jet, and the square of the bulk Lorentz factor (with the approximation that ) to transform to the host galaxy rest frame. We double the result, since the magnetic field supplies only half of the total energy under the equipartition assumption, to arrive at a total power of 1-2 ergs s-1. This is similar to that derived from a detailed analysis of very long baseline interferometric images for the parsec-scale jet of the FR 1 radio galaxy 3C 120 by Marscher et al. (2007). Both analyses, however, ignore the rest mass of the protons, which multiplies the derived kinetic power by , where is the fraction of the positively charged species that are protons rather than positrons. The total kinetic power is therefore ergs s-1 for the value that minimizes the power requirement. This corresponds to times the Eddington luminosity of a black hole with mass . If the mass of the black hole that powers OJ287 is as high as , as in the binary model of Valtonen et al. (2008), then the total kinetic power is much less than the Eddington value. The jet power can be sub-Eddington even if the black-hole mass is . We therefore find that the EC/CMB model for the X-ray emission produces reasonable physical parameters, especially if the value of near the maximum of allowed by the SED.
4.2 Bending, Length, and Deceleration of the Jet
We note that the derived value of the Doppler factor in knot it J4 from the nucleus is a factor of 2-3 lower than that found in the parsec-scale jet (Jorstad et al., 2005). This implies that the jet flow either decelerates on scales of hundreds of kiloparsecs or varies over time-scales of thousands of years. The main bending of the jet appears to occur beyond from the nucleus. If the jet remains as straight in three dimensions as it appears projected on the sky, as is the most likely case, then we can adopt the same value for the angle of the axis to the line of sight as that found on parsec scales, (Jorstad et al., 2005). The deprojected length of the straight portion of the jet is then kpc. In order for a jet at an initially small viewing angle to appear to bend by more than that angle, it must curve in three dimensions by at least the same angle as . Such bending should require a shock at the boundary of the jet opposite the side toward which it curves (Courant & Friedrichs, 1948). Knot J3 could represent such a shock. If the total curvature of the jet in three dimensions is near the minimum required to produce the apparent bending by , , then the final viewing angle increases to . With these values, we estimate the total deprojected length of the X-ray jet to be Mpc, with the radio jet extending even farther.
The Doppler factor that we have obtained from our analysis is still quite high, indicating that the jet flow remains highly relativistic out to hundreds of kiloparsecs from the nucleus. This is contrary to the deceleration to sub-relativistic speeds and disruption on scales of tens of kiloparsecs that has been inferred to be typical of FR 1 radio galaxies (Laing, 1996; Laing et al., 1999). However, OJ287 cannot be typical, given the highly relativistic nature of the jet on parsec scales, with , compared with a more common value closer to (see Lister & Marscher, 1997). The extension of the jet beyond 1 Mpc therefore agrees with the theoretical expectation (see §1) that more highly relativistic (and presumably more highly supersonic) flows can penetrate the interstellar and intergalactic medium out to greater distances before being slowed down and disrupted.
4.3 Knotty Structure of the Jet and Shock Models
The bulk of the extended X-ray emission seen in Figure 1 emanates from several bright knots. Figure 7 shows that the knot to inter-knot flux ratio is as high as :1 in X-rays and even greater at 4.7 GHz. A successful emission model must be consistent with this morphology. In fact, such knotty structure has been used as an argument against the IC/CMB model on the grounds that the energies of the electrons that scatter the CMB photons to the X-ray range are low, -130 in the case of OJ287. Because of this, the electrons have lifetimes to radiative energy losses that are too long to confine the emission to knots of length 5-10 kpc (Stawarz et al., 2004). This is true even for electrons radiating at centimeter wavelengths, whose Lorentz factors are quite high, for magnetic fields in the several micro-Gauss range. The radiative-loss lifetimes (mainly from IC/CMB radiation) of these electrons are yr. While gradients in magnetic field can cause synchrotron intensity contrasts, the knot to inter-knot flux ratio is too high for this to be the sole cause. The knotty structure must therefore involve another process. We now consider hydrodynamical effects that can potentially produce emission features with sizes kpc.
4.3.1 Standing Shock Model
Hydrodynamical effects that occur in the flows of jets (Courant & Friedrichs, 1948) can cause spatial variations in both density and bulk velocity. Interactions with the external medium form shocks oblique to the jet axis that decelerate, compress, and bend the jet flow (Gómez et al., 1997), as well as energize relativistic particles. In between the shocks are rarefactions, which increase the Lorentz factor at the expense of lower energy density of the electrons, where is the number density of electrons. On the other hand the energy density of relativistic electrons is inversely related to ; e.g., in the case of adiabatic compression and rarefactions and an ultra-relativistic equation of state, . Because the IC/CMB intensity depends on these factors as for a small viewing angle, the relationship would limit the knot to inter-knot intensity ratio to a value near unity if compression were the only physical effect. We therefore need to include non-adiabatic effects of shocks to explain the presence of distinct knots of IC/CMB emission.
We use the formulas given in Lind & Blandford (1985) and Cawthorne & Cobb (1990) to calculate and the angle of deflection of the flow velocity behind the shock, as well as the ratio of post-shock to pre-shock densities. These depend on the upstream value of and the angle of inclination of the shock front relative to the upstream flow direction. We consider the most extreme case, in which , as derived on parsec scales, is adopted for the upstream flow and downstream of the shock front, as in knot J4. This occurs for and causes a deflection that is adequate for a large bend to appear in projection, as observed. We note that, since it is the velocity component that is transverse to the shock front that decreases, the shock must be oriented in the direction of the bend, which can be seen to be the case for knot J3 in Figure 1. We calculate the upstream to downstream density contrast to be a factor of 5 in this model. If we include compressional heating by the shock, so that , we find that increases by a factor of 11 from the compression for our adopted value . However, the decrease in across the shock offsets this when calculating the expected IC/CMB intensity, since . In order to explain the intensity contrast, the shock would need to heat the electrons more strongly by another process, probably diffusive particle acceleration (e.g., Ellison, Baring, & Jones, 1996; Meli & Quenby, 2003). In order to bring the knot to inter-knot intensity ratio to the observed value of by increasing , the minimum (and therefore the mean) relativistic electron energy would need to increase by a factor of , i.e., 8 times more than by compression alone. The required increase in could be reduced by a factor of 1.6 if were 10 (roughly the minimum Lorentz factor that is compatible with a shock having ) instead of the parsec-scale value of 16.5.
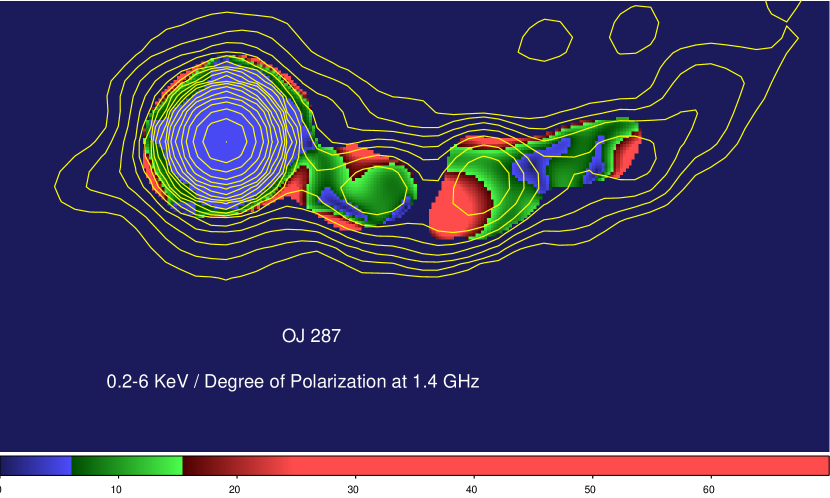
Since bending and deceleration of the jet near the X-ray knots can be caused by interactions with the external medium that set up standing oblique shocks that deflect the flow, a shock model can potentially explain both features of the jet in OJ287. This conclusion is supported by the crude 1.425 GHz polarization map displayed in Figure 9. (Unfortunately, the noise level of the polarized intensity is too high even to estimate the position angle of the polarization after statistical bias is taken into account.) The highest polarization is between knot J3 and the southeastern side of J4, where the jet first bends noticeably, as well as in J5. The polarization is in Knot J2. This conforms with the expectation for a shock, which partially aligns a chaotic ambient magnetic field along the direction of the shock front.
4.3.2 Moving Shock Model
Moving shocks, caused by major disturbances in the injection at the central engine, are a viable alternative to stationary ones, since the electron energies and densities, as well as the bulk Lorentz factor, all increase behind the shock front relative to those of the undisturbed flow. Such shocks are bounded by rarefactions on the side toward the nucleus, since the shocked flow is faster than the undisturbed flow that was later injected into the jet. We note that this scenario is in fact similar to the intermittent jet proposal by Stawarz et al. (2004), since it involves a major enhancement in the jet flow velocity and/or injected energy density that persists for thousands of years. Although the direction of elongation of the knots seen in Figure 1 is not always transverse to the flow, we will simplify by approximating that the shock front is perpendicular to the velocity vector. In the rest frame of the shock front, marked by a prime, the ratio of density ahead of (subscript “2”) to that behind (“1”) the front equals , where is the velocity in light units (e.g., Sokolov, Marscher, & McHardy, 2004). We can obtain a consistent solution if, in the (unprimed) rest frame of the host galaxy of OJ287, for the pre-shocked ambient jet and for the shock front. Relativistic addition of the velocities gives for the shocked plasma if , as appropriate for an ultra-relativistic equation of state (Königl, 1980). Then and , which is also approximately . If the electrons are heated only by compression, the IC/CMB intensity, , behind the shock is still times the ambient value.
Either a standing or moving shock model can therefore account for the knotty structure, although an oblique standing shock is favored, since it also explains the deceleration and curvature of the jet. Within the model, the slight displacement of the radio and X-ray intensity peaks (Fig. 7) implies that either the magnetic field or the density of electrons with is higher near the shock front than 30-50 kpc downstream. In the moving shock model, the region of enhancement in and/or would need to be 30-50 kpc closer to the nucleus than the location of the shock front. This could be caused by turbulence that develops and amplifies the magnetic field behind the shock (Mizuno et al., 2010) and possibly also accelerates particles. The displacement of the various knots from the jet axis implies that the shocks cover only a fraction of the jet cross-section.
4.4 Comment on Spine-Sheath Models
The strong, one-sided extended X-ray jet in OJ287 is best explained if the flow velocity remains highly relativistic at least out to hundreds of kiloparsecs from the nucleus. We detect bright knots and ambient X-ray emission across (9 kpc) on both sides of the centroid of the jet along much of its length. The length-to width ratio within of the nucleus is only , which becomes when de-projected, corresponding to a full opening angle of when deprojected. (We note that this is similar to the opening angle of the parsec-scale jet derived by Jorstad et al., 2005, .)Therefore, either the spine is not an ultra-narrow pencil beam or its direction varies, as suggested by the placements of the knots. Furthermore, the similar opening angle on parsec and kiloparsec scales supports our conclusion that the extended jet remains relativistic, since FR 1 jets that decelerate tend to broaden considerably on such scales (Laing et al., 1999).
5 Conclusions
Our Chandra observations have revealed quite strong X-ray emission from the extended jet of the BL Lac object OJ287, which has the unbeamed radio luminosity of an FR 1 source. The X-ray emission persists out to hundreds of kiloparsecs from the nucleus, while weak radio emission can be seen beyond 1 Mpc. This demonstrates that the main requirement for strong extended X-ray emission and an extremely long jet is a highly relativistic outflow, independent of the class of radio source.
The observed SED of the extended jet of OJ287 eliminates synchrotron emission as the source of the X-rays unless the electron energy distribution differs from those in other blazars by concentrating essentially all of the energy within the TeV range. The highly relativistic flow speed observed in the parsec-scale jet and the relativistic beaming implied by the one-sidedness of the kiloparsec-scale jet support an IC/CMB model for the extended X-ray emission. Since the relatively low-energy electrons involved have extremely long radiative lifetimes, the knotty structure of the jet requires shocks that compress the plasma and rarefactions that lower the density again. The model that explains the widest range of observed properties involves a standing shock at an angle of to the upstream flow, which can explain the bending beyond as well as the knot to inter-knot intensity ratio and decrease in bulk Lorentz factor. The knotty structure can also arise from variations in the jet flow on time-scales of thousands of years. This results in moving shock waves followed by rarefactions. The knots lie at various positions relative to the jet axis, which implies that, rather than confinement to an extremely narrow spine, the structure subtends a more normal (for relativistic jets) full opening angle of , similar that that found on parsec scales.
We selected OJ287 because of its extended, although very weak, radio jet and its high apparent superluminal motion on parsec scales. Exploration with Chandra of the extended X-ray emission around other BL Lac objects with very weak kiloparsec-scale radio jets detectable with the EVLA could discover more structures with high X-ray to radio flux ratios. Observations of such sources would further our knowledge of the physical development of relativistic jets as they propagate through and beyond their host galaxies.
References
- Agudo et al. (2010) Agudo, I., et al. 2010, in Fermi Meets Jansky — AGN at Radio and Gamma-Rays, ed. T. Savolainen et al. (Bonn: Max-Planck-Institut für Radioastronomie), 143
- Antonucci & Ulvestad (1985) Antonucci, R. R. J., & Ulvestad, J. S. 1985, ApJ, 294, 158
- Bicknell (1994) Bicknell, G. V. 1994, ApJ, 422, 542
- Cawthorne & Cobb (1990) Cawthorne, T. V., & Cobb, W. K. 1990, ApJ, 350, 536
- Celotti, Ghisellini, & Chiaberge (2001) Celotti, A., Ghisellini, G., & Chiaberge, M. 2001, MNRAS, 321, L1
- Chiaberge et al. (2000) Chiaberge, M., Celotti, A., Capetti, A., & Ghisellini, G. 2000, A&A, 358, 104
- Courant & Friedrichs (1948) Courant, R., & Friedrichs, K. O. 1948, Supersonic Flow and Shock Waves (New York: Springer-Verlag)
- Dermer & Atoyan (2002) Dermer, C. D., & Atoyan, A. 2002, ApJ, 568, L81
- Dermer & Atoyan (2004) Dermer, C. D., & Atoyan, A. 2004, ApJ, 611, L9
- Dickey & Lockman (1990) Dickey, J. M., & Lockman, F. J. 1990, ARA&A, 28, 215
- Ellison, Baring, & Jones (1996) Ellison, D. C., Baring, M. G., & Jones, F. C. 1996, ApJ, 473, 1029
- Fanaroff & Riley (1974) Fanaroff, B. L, & Riley, J. M. 1974, MNRAS, 167, 31P
- Gómez et al. (1997) Gómez, J. L., Martí, J. M., Marscher, A. P., Ibáñez, J. M., & Alberdi, A. 1997, ApJ, 482, L33
- Harris & Krawczynski (2006) Harris, D.E., & Krawczynski, H. 2006, ARAA, 44, 463
- Homan et al. (2003) Homan, D C., et al. 2003, ApJ, 589, L9
- Jester et al. (2006) Jester, S., Harris, D. E., Marshall, H. L., & Meisenheimer, K. 2006, ApJ, 648, 900
- Jorstad et al. (2001) Jorstad, S. G. et al. 2001, ApJS, 134, 181
- Jorstad & Marscher (2004) Jorstad, S. G., & Marscher, A. P. 2004, ApJ, 614, 615
- Jorstad et al. (2005) Jorstad, S. G. et al. 2005, AJ, 134, 1418
- Kataoka & Stawarz (2005) Kataoka, J., & Stawarz, L. 2005, ApJ, 622, 797
- Königl (1980) Königl, A. 1980, Phys. Fluids, 23, 1083
- Laing (1996) Laing, R. A. 1996, in Energy Transportation in Galaxies and Quasars, ed. P. E. Hardee, A. H. Bridle, & J. A. Zensus, ASP conf. ser. 100, 241
- Laing et al. (1999) Laing, R. A., Parma, P., de Ruiter, H. R., & Fanti, R. 1999, MNRAS, 306, 513
- Lind & Blandford (1985) Lind, K. R., & Blandford, R. D. 1985, ApJ, 295, 358
- Lister & Marscher (1997) Lister, M. L., & Marscher, A. P. 1997, ApJ, 476, 572
- Marscher et al. (2007) Marscher, A. P. et al. 2007, ApJ, 665, 232
- McKinney (2006) McKinney, J. C. 2006, MNRAS, 367, 1797
- Meier (2003) Meier, D. L. 2003, New Astron., 47, 667
- Meli & Quenby (2003) Meli, A., & Quenby, J. J. 2003, Astroparticle Phys., 19, 649
- Mizuno et al. (2010) Mizuno, Y., et al. 2010, ApJ, submitted
- Padovani & Urry (1990) Padovani, P., & Urry, C. M. 1990, ApJ, 356, 75
- Perlman & Stocke (1994) Perlman, E. S., & Stocke, J. T. 1994, AJ, 108, 56
- Punsly (1996) Punsly, B. 1996, ApJ, 473, 178
- Sambruna et al. (2001) Sambruna, R. M., et al. 2001, ApJ, 549, L161
- Sambruna et al. (2007) Sambruna, R. M., et al. 2007, 670, 74
- Sambruna et al. (2008) Sambruna, R. M., Donato, D. Cheung, C. C., Tavecchio, F., & Maraschi, L. 2008, ApJ, 684, 862
- Shepherd (1997) Shepherd, M.C. 1997, in Astronomical Data Analysis Software and Systems VI, ed. G. Hunt & H.E. Payne (San Francisco: ASP), ASP. Conf. Proc. 125, 77
- Sokolov, Marscher, & McHardy (2004) Sokolov, A. S., Marscher, A. P., & McHardy, I. M. 2004, ApJ, 613, 725
- Stawarz et al. (2004) Stawarz, L., Sikora, M., Ostrowski, M., & Begelman, M. C. 2004, ApJ, 608, 95 ApJ, 570, 543
- Tateyama & Kingham (2004) Tateyama, C. E., & Kingham, K. A. 2004, ApJ, 608, 149
- Tavecchio et al. (2000) Tavecchio, F., Maraschi, L., Sambruna, R. M., & Urry, C. M. 2000, ApJ, 544, L23
- Uchiyama et al. (2006) Uchiyama, Y., et al. 2006, ApJ, 648, 910
- Urry, Padovani, & Stickel (1991) Urry, C. M., Padovani, P., & Stickel, M. 1991, ApJ, 382, 501
- Valtonen et al. (2008) Valtonen, M. J., et al. 2008, Nature, 452, 851
- Worrall, Birkinshaw, & Hardcastle (2001) Worrall, D. M., Birkinshaw, M., & Hardcastle, M. J. 2001, MNRAS, 326, L7
- Yanny, Jannuzi, & Impey (1997) Yanny, B., Jannuzi, B. T. & Impey, C. 1997, ApJ, 484, L113
| Telescope | Instrument | Band | Exposure | ||
|---|---|---|---|---|---|
| (1) | (2) | (3) | (4) | (5) | (6) |
| Chandra | ACIS-S | 0.2-10 keV | 2007-12-27 17:02:36 | 2007-12-28 07:15:20 | 50.4 ks |
| HST | WFPC2 | 600.1 nm | 2007-12-18 21:43:39 | 2007-12-19 01:03:39 | 2760 s |
| Spitzer | IRAC | 3.6 m | 2007-11-25 23:30:45 | 2007-11-26 00:26:41 | 2592 s |
| Spitzer | IRAC | 5.8 m | 2007-11-25 23:30:45 | 2007-11-26 00:26:41 | 2592 s |
| VLA | A-array | 1.425 GHz | 1993-01-04 05:30:00 | 1993-01-04 14:30:00 | 170 m |
| VLA | A-array | 4.710 GHz | 2003-08-31 14:00:00 | 2003-08-31 23:00:00 | 200 m |
| VLA | B-array | 14.940 GHz | 2007-11-08 12:00:00 | 2007-11-08 15:00:00 | 150 m |
| Knot | (X-ray)11Photon counts from 0.2 to 6 keV; units: ph s-1; no value for J1 because it is confused with the PSF of the nucleus | (1.4 GHz)22Flux density in mJy; signal-to-noise ratio is insufficient to determine for individual knots at 4.8 and 15 GHz | (4.8 GHz)22Flux density in mJy; signal-to-noise ratio is insufficient to determine for individual knots at 4.8 and 15 GHz | (15 GHz)22Flux density in mJy; signal-to-noise ratio is insufficient to determine for individual knots at 4.8 and 15 GHz | Dimensions33Full width across feature at half intensity parallel perpendicular to axis, in arcseconds | (X-ray)44Spectral index, defined such that flux density ; signal-to-noise ratio is insufficient to determine for some knots, especially at the radio frequencies | (radio)44Spectral index, defined such that flux density ; signal-to-noise ratio is insufficient to determine for some knots, especially at the radio frequencies |
|---|---|---|---|---|---|---|---|
| J1 | — | — | — | — | |||
| J2 | — | — | — | ||||
| J3 | — | — | — | ||||
| J4 | — | — | — | ||||
| J5 | — | — | — | — | |||
| J1-J555Includes emission between knots | 1.3 | 0.610.06 | 0.80.1 | ||||
| Outer66Region beyond detected X-ray emission out to last radio feature seen in Figure 5; only apparent at 1.4 GHz | — | — | — | — | — | — |