First Views of a Nearby LIRG: Star Formation and Molecular Gas in IRAS 04296+2923
Abstract
We present a first look at the local luminous infrared galaxy IRAS 04296+2923. This barred spiral galaxy, overlooked because of its location behind the Taurus molecular cloud, is among the half dozen closest (D= 29 Mpc) LIRGs. More IR-luminous than either M82 or the Antennae, it may be the best local example of a nuclear starburst caused by bar-mediated secular evolution. We present Palomar J and Pa images, VLA continuum maps from 20–1.3 cm, a subarcsecond Keck LWS image at 11.7m and Owens Valley Millimeter Array CO(1–0), 13CO(1–0), and 2.7 mm continuum images. The J-band image reveals a symmetric barred spiral galaxy. Two bright, compact mid-infrared and radio sources in the nucleus mark a starburst that is energetically equivalent to O7 stars, separated by pc. This is probably a pair of young super star clusters, with estimated stellar masses of each. The nuclear starburst is forming stars at the rate of , or about half of the total star formation rate for the galaxy of . IRAS 04296+2923 is very bright in CO, and among the most gas-rich galaxies in the local universe. The 12CO luminosity of the inner half kpc is equivalent to that of the entire Milky Way. While the most intense CO emission is extended over a 15″ (2 kpc) diameter region, the nuclear starburst is confined to within 1–2″ (150–250 pc) of the dynamical center. Based on masses obtained with 13CO, we find that the CO conversion factor in the nucleus is higher than the Galactic value, X by a factor of 3–4, typical of gas-rich spiral nuclei. The nuclear star formation efficiency is , corresponding to a gas consumption timescale, yrs. The star formation efficiency is ten times lower in the disk, with yrs. The low absolute star formation efficiency in the disk implies that the molecular gas is not completely consumed before it drifts into the nucleus, and is capable of fueling a sustained nuclear starburst. IRAS 04296+2923 appears to be beginning a 100 Myr period as a LIRG, during which it will turn much of its of molecular gas into a nuclear cluster of stars.
Subject headings:
galaxies:individual(IRAS 04296+2923,2MASX J04324860+2929578) — galaxies:starburst — galaxies: ISM — radio lines — radio continuum: galaxies1. Introduction
Luminous (L L⊙) and ultraluminous (L L⊙) infrared galaxies are powered by prodigious amounts of star formation (Joseph & Wright, 1985; Condon et al., 1991; Sanders & Mirabel, 1996; Genzel et al., 1998; Lutz et al., 1998; Downes & Solomon, 1998). While ULIRGs are typically associated with mergers (Sanders et al., 1988), in LIRGs, star formation may be generated by interactions or secular evolution, often related to bars (Kormendy & Kennicutt, 2004). LIRGs are relatively rare (Soifer et al., 1987). The few LIRGs close enough for their internal structure to be resolved are valuable targets for the study of the local physics of the starburst/gas interaction, such as when and where the star formation takes place within a galaxy.
IRAS 04296+2923 (hereafter IRAS 04296) lies behind A mag of extinction from the dark cloud L1500 in Taurus (Table First Views of a Nearby LIRG: Star Formation and Molecular Gas in IRAS 04296+2923). Low-resolution optical and HI spectra allowed it to be identified as a galaxy (Strauss et al., 1992; Chamaraux et al., 1995). IRAS 04296 has an IRAS luminosity of (29 Mpc, for Ho = 71 km s-1 Mpc-1 Sanders et al., 2003), making it the fifth most IR-luminous galaxy within 30 Mpc, at the lower bound of the LIRG class. It is 60% more IR-luminous than M82, and 35% more than the Antennae, exceeded only by NGC 1068, NGC 2146, NGC 7552, and NGC 1365 in the local universe.
Little is known about IRAS 04296. We discovered its nuclear starburst in a subarcsecond mid-infrared imaging survey with the Long Wavelength Spectrometer (LWS) on the Keck Telescope; it has a warm IRAS 60/100m color that is a diagnostic of concentrated star formation. The bright double mid-IR source revealed by LWS (3.1), ″ (150 pc) across, suggested the presence of a new starburst galaxy in the local universe.
In this paper we present near-infrared (NIR), mid infrared (MIR), millimeter and centimeter radio continuum images of IRAS 04296, as well as NIR and millimeter spectral imaging. While its location in Taurus hinders optical and ultraviolet observations of IRAS 04296, infrared and radio observations are unaffected, and they are the most reliable probes of star formation in dusty starbursts.
2. Observations
2.1. Near-Infrared J-Band and Pa Images from the Hale Telescope
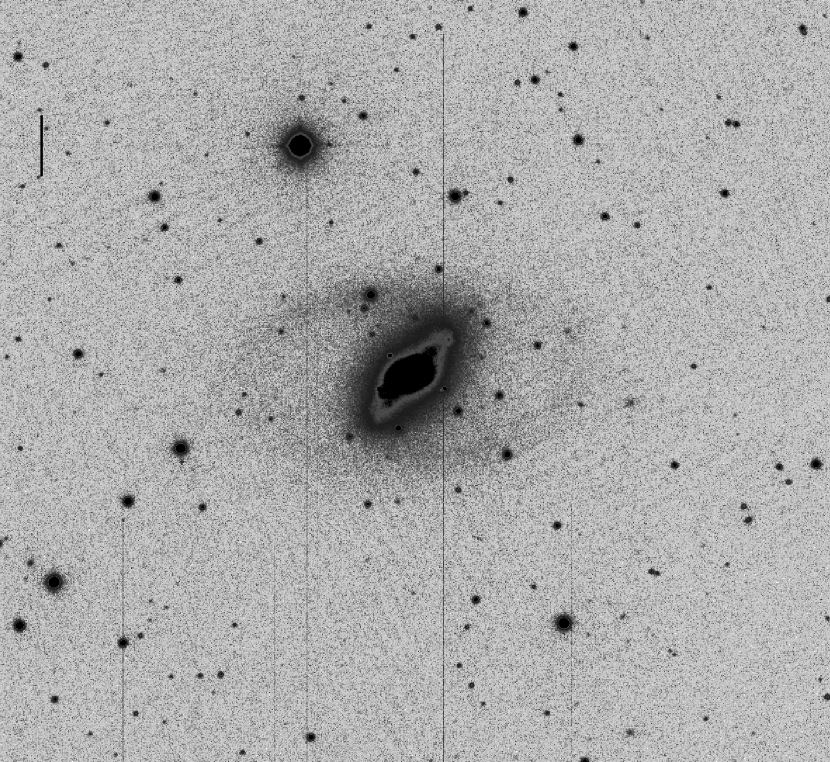
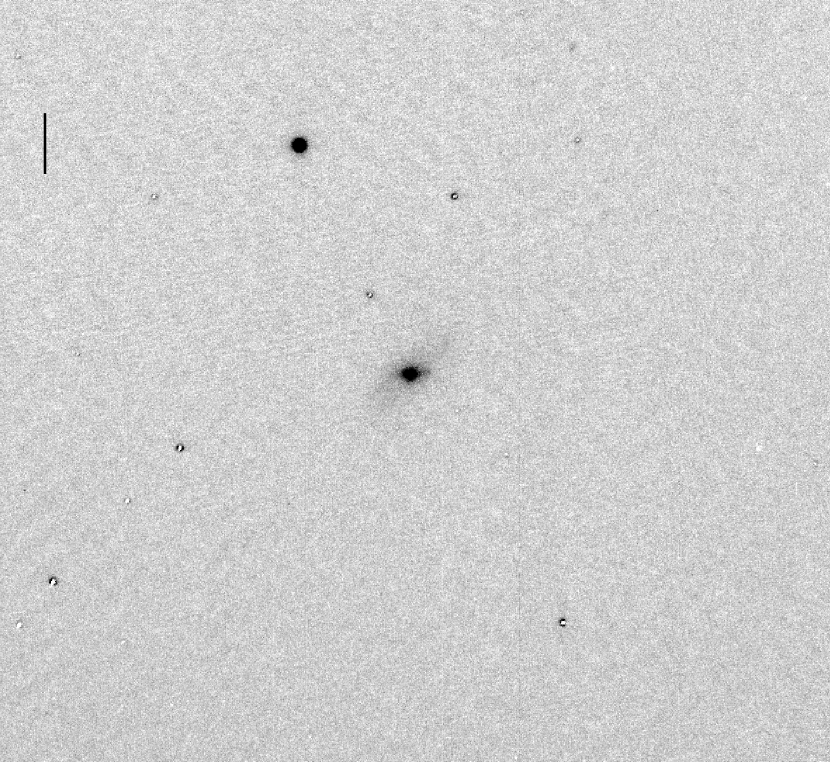
IRAS 04296 was observed using the Palomar Hale 5-meter telescope111Based on observations obtained at the Hale Telescope, Palomar Observatory, as a part a continuing collaboration between the California Institute of Technology, NASA/JPL, and Cornell University. on 2005 January 23 UT with the Wide-field Infrared Camera (WIRC; Wilson et al., 2003) at prime focus, in broad-band J and narrow-band Pa filters. The camera has a pixel size of 025. Exposure times on-source were 11 minutes (3 20 sec frames, 11 pointings) for the continuum band and 18 minutes (3 60 sec frames, 6 pointings) in the emission-line band, with equivalent off-source exposure times to measure the sky. The observing conditions were good with seeing at FWHM. Median dark current and filtered sky images created for each band were subtracted from the frames. Finally a coadded mosaic was produced from each set of on-source frames. We scaled the counts in each band’s mosaic, via aperture photometry of several bright, uncrowded stars in the field around the galaxy, and subtracted the J-band mosaic (see Fig. 1a) from the Pa mosaic, to produce an approximate continuum subtracted image (see Fig. 1b). The images in the broad-band and narrow band filters were not explicitly flux-calibrated using observations of standard stars, so we are unable to derive a value for the net Pa flux in the continuum subtracted image.
2.2. Mid-Infrared Images from Keck
IRAS 04296 was observed on 24 December 2002 with the Long Wavelength Spectrometer (LWS) in imaging mode on the Keck I Telescope, with the standard m/SIC filter. The standard stars were Aur, Aries and Leo, observed both before and after the source exposures. High quality images at both wavelengths were obtained (Fig. 2); however, the absolute flux calibration was uncertain due to intermittent instrumental problems, and so we reobserved the galaxy on 31 January, with the same parameters as confirmation. Absolute flux calibration is estimated to be good to 10%, based on derived flux counts on standard star before/after observations throughout the night. Stellar images were about 5 pixels or FWHM.
2.3. Radio Continuum Images from the VLA
The radio data were taken with the NRAO VLA222The National Radio Astronomy Observatory is a facility of the National Science Foundation operated under cooperative agreement by Associated Universities, Inc.. There were two projects: AB1092 on 2003 July 7 with the A configuration for high angular resolution at 20 cm, 6 cm, 3.5 cm, 2 cm, and 1.3 cm (L,C,X U and K bands) and AT309 on 2005 July 5 with the array in BC configuration for moderate resolution at 1.3 cm only. 3C48 was the primary calibrator for both runs. The 20, 6, and 3.6 cm data were processed with AIPS, including baseline corrections. The 2 cm and 1.3 cm data were observed in fast-switching mode and reduced according to the AIPS prescriptions for high frequency calibration. The details of the radio imaging are discussed below (§3.2)
2.4. Millimeter CO Lines and Continuum from OVRO
Simultaneous aperture synthesis observations of the 12CO(1-0) transition (115.271 GHz) and the 13CO(1-0) transition (110.201 GHz) of IRAS 04296 were made with the Owens Valley Radio Observatory (OVRO) Millimeter Interferometer between 2003 November 1 and 2004 May 8. The interferometer consisted of six 10.4 m antennas with cryogenically cooled SIS receivers (Scoville et al., 1994). Observations in “Compact”, “Low” and “High” configuration were obtained, with system temperatures (single sideband) ranging from 220 - 450 K at 115 GHz. 644 MHz channels were used to cover both transitions, giving a velocity resolution of 10.5 km s-1 for CO(1-0). The phase center is within of the 2 m peak listed in Table First Views of a Nearby LIRG: Star Formation and Molecular Gas in IRAS 04296+2923 and the adopted systemic velocity (LSR) was 2100 km s-1. Simultaneous low spectral resolution, wideband (12831.25 MHz) COBRA observations were used to generate a 3 mm continuum image ( 111 GHz), free from 12CO(1-0), CN(1-0) and 13CO(1-0) contamination. The data were calibrated using the MMA software package. Phase calibration was done by observing the quasar J0336+323 every 25 minutes. Absolute flux calibration was done using Uranus as primary flux calibrator and 3C273 and 3c454.3 as secondary flux calibration, and is good to 10%.
Mapmaking was done in MIRIAD and subsequent data analysis and manipulation was done with the NRAO AIPS package. Maps were generated with natural weighting to maximize sensitivity, uniform weighting to maximize resolution and robust = 0 weighting to simultaneously optimize sensitivity and resolution. Unless stated the analysis results from the naturally weighted data. Integrated intensity images are straight moment 0 maps with all emission brighter than 1.3 (1 for 13CO) per channel included. The OVRO primary beam is 64 at 115 GHz. Corrections for the primary beam have not been applied so emission at the edge of the primary beam will be somewhat underestimated. Structures extended on scales larger than 52 for CO(1-0) will be resolved out by the interferometer. No single-dish observations of this galaxy exists, so no estimate of the amount of resolved-out flux is possible for the mm-wave images. However, 52 corresponds to spatial scales of 7.3 kpc and given that the emission must be extended on this scale in an individual channel to be missed, we consider it unlikely that significant flux is resolved out. If large amounts of flux are missed then the observed molecular richness is a lower limit.
3. Results: A First Look at IRAS 04296+2923
Near-infrared images of IRAS 04296 reveal a normal, barred spiral galaxy in starlight. The bright, concentrated nuclear starburst is prominent at MIR and radio continuum wavelengths. In 3.1 we discuss the large field Palomar near-IR images of the galaxy and its Pa emission, and the Keck high resolution m MIR image. In 3.2 we discuss the VLA radio images, which were mapped in four ways, one to match beams for extended emission dominated by synchrotron emission, and two for matching compact emission dominated by free-free from HII regions. In §3.3 we discuss the CO and molecular gas.
3.1. Infrared Views
The Palomar J band continuum image and a narrow band continuum-subtracted image of Pa in IRAS 04296 are shown in Figure 1. The near-infrared continuum at J-band reveals the stellar population. IRAS 04296 is an inclined, barred spiral with outer ring-like spiral arms (SBb/c(r)). The total extent of the emission is roughly 2-2.5′, or 17-20 kpc (8-10 kpc in radius). The stellar distribution appears bi-symmetric and undistorted. The image shows line emission to be very concentrated and bright in the galactic nucleus, with some very weak emission along the inner arms. The compact nature of the bright Pa emission shows that the starburst is highly concentrated at the nucleus. Since the images are not photometric, and extinction is probably variable across the galaxy, we cannot precisely quantify the relative brightnesses of disk and nuclear star formation from the Pa image.
Mid-IR continuum emission traces warm ( few hundred K) dust heated by young stars in the starburst. The high resolution (0.3″) mid-IR continuum image at 11.7m made with LWS on Keck of IRAS 04296 is shown in Figure 2; the field of view of this image is only 10″ 10″, or about 1.4 kpc on a side. A similar m image (not shown) will be published in a subsequent paper (Turner et al. 2010, in prep.). The 11.7m filter contains two PAH features; however, based on observations of the starburst galaxies NGC 7714 and Arp 220 (Brandl et al., 2004; Armus et al., 2007) we estimate that at most 15% of the 12m continuum is due to PAH emission.
The mid-IR emission comprises a bright source, which cannot be resolved at the 03 diffraction limit of Keck at 11.7m, and a secondary source or tail extending to the east of the main source, separated from the main source by 15 (200 pc). The total flux density is mJy. These two compact, mid-infrared sources account for roughly half of the IRAS m flux of the entire galaxy.
3.2. Radio Views
VLA maps of IRAS 04296 across the cm waveband are presented in Figure 3, with fluxes and noise values given in Table 2. The radio continuum emission is a combination of thermal bremstrahlung emission from the HII regions and nonthermal synchrotron emission from supernovae and their remnants associated with the starburst. The brightest radio emission, like the mid-IR emission, is concentrated within the central 1–2″ region of 150–250 pc extent; higher resolution maps shown below give a better comparison with the Keck mid-IR images.
Separating free-free emission from the HII regions from the synchrotron emission is possible because these sources have different spectral and spatial characteristics. However, complications arise when comparing aperture synthesis maps at different frequencies, so the spectral analysis must be done with care. The synchrotron component in galaxies is spatially extended with a spectrum that falls steeply with increasing frequency. Free-free emission from HII regions is compact with spectra that are either flat or rising with frequency (e.g., Turner & Ho, 1994). Except at 1.3 cm, the robustly-weighted VLA maps of Figure 3 were done with a single array configuration, so the maps have responses to extended structure that vary with frequency; shorter wavelength maps are less sensitive to extended emission. The shortest baselines determine the maximum detectable spatial scales, , which are listed in Table 2. So the maps of Figure 3 cannot be compared directly to obtain spectral index maps. Since single dish or lower resolution VLA fluxes do not exist for IRAS 04296 except at 20 cm, we cannot estimate the effects of missing short baselines except at 20 cm. Our A array maps, with total flux mJy, recover the entire 20 cm flux recorded by Condon et al. (1996), and so the 20 cm map is probably a good representation of the total radio emission, although there may be faint extended emission that is undersampled. From the 20 cm image we can see that the extended radio emission is aligned along the apparent bar of the galaxy (§3.3). The bright mid-IR sources and the peak of the radio emission mark a starburst located at the inner end of the northwestern arm traced by CO (§3.3).
Free-free and nonthermal synchrotron sources can be separated by determining the spectral index, , of the emission () so long as the beams are matched, not only in beamsize (), but also in , defined by . Toward this end we have made a series of “cut” maps, which are high-pass spatially filtered images with common and , that enable us to construct images with nearly identical coverages and allow us to compare the radio spectra for the compact sources, at the cost of losing response to extended emission. Since the star formation arises largely in compact sources 1″ (150 pc), we expect to detect nearly all of the free-free emission in the “cut” maps and resolve out most of the synchrotron emission, which is our goal.
The first set of “cut” maps were made to match the beams at 20, 6, 3.6, and 1.3 cm, with a consistent of (″, 1.4 kpc). The beam for this series of maps is 082 029, p.a. -89°. For the 1.3 cm emission, we used the BC configuration data. From the cut maps, we mapped the spectral index , shown in Figure 4. The spectral index is negative over the entire range, confirming that the extended emission cm-wave emission is largely non-thermal, typical of large spiral galaxies and LIRGs (e.g. Condon et al., 1991; Condon, 1992; Clemens et al., 2008). Fluxes from this set of maps are measured for a box (630 pc 420 pc) are shown in Table 2.
A second set of “cut” maps were made from the shorter wavelength data to image the compact emission at 3.6, 2 and 1.3 cm. For these maps, ( 4″, or 550 pc) and they were convolved to match the 027023, p.a. -90° beam () of the 3.6 cm map. These cut maps are shown in Figure 5, and fluxes are given in Table 2. The peak flux densities are the same within observational uncertainties for all three maps, 1.1–1.5 mJy/beam. The restriction has eliminated about two-thirds of the total 3.6 cm flux as compared to the map of Figure 3. The compact emission that remains in these maps has a nearly flat spectrum: this is emission from HII regions. These radio images are similar to the 11.7m image of Figure 2, given the lower resolution (03) of the mid-IR image. We identify the brightest, elongated radio source with the mid-IR peak, and the extension visible to the southeast in the 3.6 cm image (Fig. 5) with the extension in the mid-IR image.
A third set of “cut” maps, designed to match beams at 2 and 1.3 cm, give the highest resolution images. Like the previous set of maps, they are cut to but these maps are instead convolved to match the smaller 2 cm beam of 015014, p.a. -66°. These images resolve the brightest continuum source (Fig. 6) into a double source separated by 02, or 30 pc oriented east-west. The eastern source is the stronger. Slight differences in the spatial structure of the double source at the two frequencies might be due to differences in azimuthal (u,v) coverage or to 1.3 cm seeing. This source is flat in radio spectral index, indicating that the compact emission is largely free-free emission from HII regions. Comparison of the three sets of maps suggests that the total amount of flat-spectrum, compact emission in the nucleus of IRAS 04296 is 10 mJy.
Continuum emission at 2.7 mm was detected with OVRO (Figure 7d). The peak 2.7 mm continuum intensity is 101 mJy bm-1 () with a total detected flux of 112 mJy (Table 2). The millimeter continuum emission is confined to the nuclear starburst, with position and extent consistent with the (uncut) cm-wave and infrared continuum. At this wavelength, potential continuum sources include synchrotron, free-free emission and dust. Extrapolation of synchrotron emission all the way from 20 cm to 2.7 mm is dangerous since it is sensitive to the exact spectral index, but using the 20 cm emission seen in the first ‘cut’ map and -0.8 implies a contribution of 2–3 mJy. Based on our estimated nuclear gas mass (§4.2) we expect that 1-2 mJy of the 3 mm continuum is from dust emission. From this, we conclude that the millimeter continuum flux associated with star formation is 5–7 mJy at 2.7 mm, consistent with the fraction of the flux from the compact flat spectrum sources seen directly in cm-wave continuum.
3.3. Molecular Views
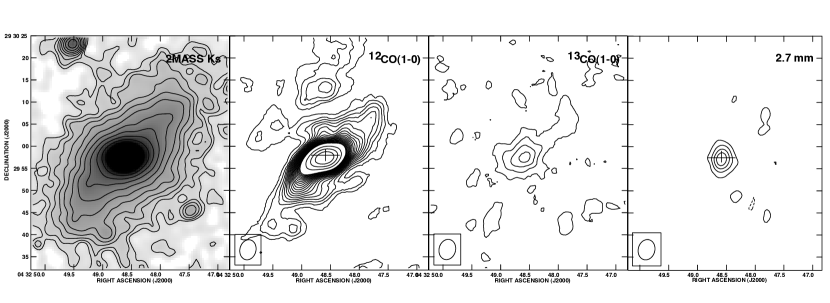
The first observations of molecular gas towards IRAS 04296 are shown in Figures 7–8. The CO(1–0) integrated intensity (Fig. 7) is remarkably bright, extending over a 2.5 kpc (diameter) region, peaking at the nucleus. (When no superscript appears the most abundant from, 12C16O is implied; ’13CO’ refers to the less abundant 13C substituted isotopologue.) The CO emission extends well beyond the Pa emission region (Figure 1b) and the radio continuum (Figure 8). Beyond the nucleus the molecular gas is bar-like, extended southeast-northwest. Weak emission is also seen to the north and west of the nucleus. The CO morphology closely follows the stellar morphology seen in the Palomar J band and 2MASS Ks images, as shown in Figure 7.
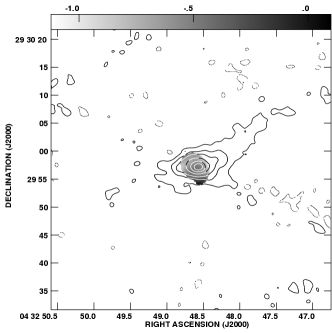
Towards the nucleus, antenna temperatures in the robustly weighted image (Figure 8) peak at 10 K averaged over the inner 160 pc radius. This is a remarkably high brightness temperature for a galaxy at the distance of IRAS 04296; it implies that the beam filling factor for the CO must be near unity over regions 300-400 pc in diameter. The CO line widths are broadest towards the nucleus but are fairly modest (250 km s-1, FWHM) compared to other luminous starbursts (Solomon, Downes & Radford, 1992; Solomon et al., 1997; Downes & Solomon, 1998), and drop to 50 km s-1 towards the outer molecular arms. The velocity field is consistent with a rotating disk, except for modest perturbations ( km s-1; see below). We have fit the axisymmetric velocity field with a Brandt rotation curve; the best-fit parameters are given in Table First Views of a Nearby LIRG: Star Formation and Molecular Gas in IRAS 04296+2923. The separate CO component north of the nucleus follows the same velocity field as does the bar and nucleus. This suggests that these clouds are a continuation of the galaxy’s disk (the outer spiral arms).
The molecular morphology is bar-like. The best fit for the kinematic major axis from the CO velocity field is at a position angle of 252o (to the receding axis). This is perpendicular to the long axis of the CO and IR morphology. Therefore the observed bar-like structure seen in CO is not a result of inclination, but is intrinsic. The strong bar deduced for the stellar distribution makes it impossible to separately constrain the bar strength and the galaxy’s inclination angle, , over the inner arcminute. Instead we estimate the inclination angle from the axial ratio of the outer, presumably more circular, spiral arms seen in the J band image (Fig. 1a). The measurement yields and is consistent with the same p.a. determined from the CO velocity field. Such an inclination angle implies a peak velocity of 190 km s-1, or a dynamical mass of over the 7 (R 500 pc) and over the radius, (R 4.3 kpc). This suggests that IRAS 04296 is similar in size to the Milky Way at this radius. HI observations at larger radii will be needed to determine a global dynamical mass for IRAS 04296.
To verify that the gas distribution and kinematics are consistent with response to a bar potential, we generate a simple analytical, weak-bar model. These models treat the gas dissipation by adding a damping term proportional to radial velocity to the standard stellar barred orbits (e.g. Wada, 1994; Lindblad & Lindblad, 1994). Despite the simplicity of the model, it matches full hydrodynamical simulations with surprising fidelity (e.g. Lindblad & Lindblad, 1994). The current model is that of Sakamoto et al. (1999), except that we use an axisymmetric potential that generates a Brandt rotation curve. With the analytical model we can quickly search barred galaxy parameter space for configurations consistent with what is observed.
Figure 9, which shows the bar models and rotation curve, indicates a close agreement of models with the observed morphology and kinematics. From the best models we find that the molecular gas distribution of IRAS 04296 is very well reproduced by a large axial ratio bar. We assume that the northern portion of the galaxy is the near side, consistent with two fairly straight trailing arms on the leading edge of the bar. The observed velocity residuals have the expected signatures of inflow along the downstream sides of the bar arms and weaker outflow on the upstream (so called “spray” region) sides of the arms. Both modeled radial velocities and peak observed velocity residuals are in the range of V km s-1.
4. Discussion
4.1. The Star Formation Rate and Luminosity of the Starburst in IRAS 04296
From the observed free-free emission (3.2) we can infer the Lyman continuum rate of the starburst, its , and star formation rate. The compact cm-wave emission of IRAS 04296 consists of an east-west elongated source, centered at RA=04h32m486, Dec=29°29′57″. The brightest emission corresponds to a region 0402 in size (50 pc 30 pc) with a flux of 3 mJy and a flat spectrum, located about 1″ (140 pc) WSW of the dynamical center. There is a halo of emission, stronger to the south of the double source (Fig. 3). The emission measure, EM, of these HII regions is high; our high resolution maps (Figs. 5 and 6) detect only gas with –, which is characteristic of dense or compact HII regions in the Galaxy. The central double radio source has a total flux mJy at 1.3 cm, and 10 mJy at 2 and 3.6 cm. The short wavelength (2 - 0.26 cm) continuum emission is consistent with star formation having a free-free flux of 5–7 mJy, which implies an ionizing flux from young stars of for optically thin emission. This total Lyman continuum rate is equivalent to O7 (Martins et al., 2005) stars. Using STARBURST99 (Leitherer et al., 1999; Vázquez & Leitherer, 2005) and a Kroupa IMF with mass cutoffs of 0.1 and 100 M☉, we infer a luminosity associated with the OB stars of for the nuclear (R150 pc) starburst, to within a factor of two, given uncertainties in free-free flux and starburst age. The mid-IR continuum flux is consistent picture: the 12m/radio flux ratio of 100 is similar to the values of 50–100 observed in both Galactic and extragalactic HII regions (e.g. Genzel et al., 1982; Ho et al., 1989). The thermal cm-wave fluxes imply a star formation rate of and a mass of for the nuclear starburst. From the morphology, we infer that these are two massive young super star clusters, “hyper star clusters”, each containing 50,000 O stars and with individual masses of . The nuclear starburst contains about half of the current global star formation rate of IRAS 04296, based on the ratio of LWS flux for the nuclear source to the IRAS 12 flux for the entire galaxy.
4.2. A Super CO-Rich Galaxy: Conversion Factors and Estimating IRAS 04296 ’s H2 Mass.
IRAS 04296 is very bright in CO. Its total mapped CO luminosity is L. The nucleus is the dominant feature in the CO maps. The peak integrated CO(1-0) intensity averaged over the central kpc (R = 3.5) is higher than the peak CO brightness averaged over individual GMC scales in the nearby gas-rich spiral, IC 342 (e.g. Meier, Turner & Hurt, 2000). Among nearby galaxies, only NGC 2146, also a LIRG, and possibly NGC 253, can rival it in the richness of its molecular emission (Jackson & Ho, 1988; Young et al., 1988).
The bright CO implies a large H2 mass. For a Galactic conversion factor of (e.g. Strong et al., 1988; Hunter et al., 1997), we would derive a molecular gas total mass of for the central kpc, which is larger than the molecular mass of the entire Milky Way. This mass is comparable to the dynamical mass for the central kpc, as determined by the rotation curve from our model (Fig. 9). Either molecular gas accounts for the entirety of the dynamical mass in the inner 500 pc radius or the CO-to-H2 conversion factor is different than in the Galaxy. Evidence is accumulating that the latter explanation is far more likely in the center of a gas-rich galaxy such as IRAS 04296. Studies of a variety of galaxies indicate that as determined from the molecular clouds in the disk of our Galaxy is inappropriate for the central regions of galaxies. In (U)LIRGs it is well known that the Galactic conversion factor consistently overestimates (nuclear) molecular masses by factors of 3-4 (e.g. Downes et al., 1993; Solomon et al., 1997; Yao et al., 2003; Narayanan et al., 2005). This is often called the “starburst” conversion factor. However, in fact, this lower conversion factor also holds in gas-rich centers of normal spiral galaxies including relatively quiescent ones such as our own (e.g. Mauersberger et al., 1996; Dahmen et al., 1998; Meier & Turner, 2001; Weiss et al., 2001; Paglione et al., 2001; Meier & Turner, 2004; Meier, Turner & Hurt, 2008). Since is a dynamical measure of mass, any contribution to the cloud linewidths from systematic motions driven by the stellar potential will cause an overestimate of the gas mass. This is particularly likely in galactic centers, where tidal effects on the clouds become important (e.g., Meier & Turner, 2004).
Our 13CO map provides an independent measure of gas mass, which we can obtain from this optically thin line by “counting molecules”. If we adopt abundances of [12CO/13CO] = 60, (e.g. Wilson & Rood, 1994), and [12CO/H2] = (Frerking et al., 1982), and an excitation temperature, Tex= 20 K, which are typical of clouds in the nuclei of nearby galaxies, then N(H2) column densities can be estimated from 13CO line strengths. The peak nuclear column densities derived from 13CO are 3.6 times lower than the corresponding values obtained from 12CO using the Galactic . Our 13CO mass suggests that in IRAS 04296, similar to values found for other spiral nuclei, LIRGs, and ULIRGs.
We conclude that the nuclear H2 mass (including He) for IRAS 04296 is () for the inner kpc, with estimated uncertainties of 50% due to unknown 13CO excitation temperature and abundance. Caution should be used in comparing this value to masses determined for other galactic centers in the literature in which the Galactic is used to determine the mass; those masses are probably systematically overestimated.
Outside the nucleus, the CO intensity in the disk remains high in absolute terms. Normalized by distance squared, the CO intensity of IRAS 04296 averaged over its central aperture is larger than any galaxy observed in the FCRAO survey (Young et al., 1995) out to its 30 Mpc distance. Over the central arcminute of the OVRO field of view a total of of molecular gas is implied (for a Galactic conversion factor including He). Even adopting the lower M 82 conversion factor (Walter et al., 2002) for this rather normal appearing disk, IRAS 04296 has twice the molecular mass of M 82, including all outflows and streamers. 13CO(1–0) is weakly detected towards the disk in IRAS 04296 so further constraints on the validity of the conversion factor are testable here as well. At 10 radii, the values of N(H2) derived from 13CO are within a factor of 1.6 of what the standard conversion factor predicts, and along the arms at distances larger than 10 (particularly at the bar ends), the two column densities agree within the uncertainties. This suggests that in the disk of IRAS 04296 may be consistent with Galactic disk values. However gradients in excitation temperature, 13CO opacity and isotopic abundances can affect the 13CO mass by at least a factor of two, so this merits further study.
The IR luminosity of IRAS 04296 is (Sanders et al., 2003). Averaged over the central arcminute, IRAS 04296 has LIR/LCO = 72 L, LIR/M = 18 L⊙/M⊙ and M(H2/MHI) 5, all typical of LIRGs (e.g. Scoville et al., 1991; Sanders & Mirabel, 1996). Given the rotation curve (§3), an inclination of 50o and the molecular gas masses derived above, molecular gas accounts for at least 30% of the dynamical mass within the central 500 pc radius (using the lower 13CO mass) and 15% of the dynamical mass over the entire mapped region.
4.3. Gas Stability Against in the Molecular Bar
Is the molecular gas disk in IRAS 04296 so dense that it will collapse into new stars without further triggering, or is the disk stable? We can assess this using the Toomre Q parameter,
| (1) |
where is the epicyclic frequency (e.g. Binney & Tremaine, 1987), is the gas velocity dispersion, is the total gas surface density and is a constant of order unity depending on the structure of the galactic disk (here assumed to be ) (Safronov, 1960; Toomre, 1964). If the gas disk is unstable.
Figure 10 displays the observed values of (calculated both from 12CO and 13CO, neglecting the HI surface density contribution, which if conservatively estimated to be distributed uniformly over the disk contributes much less than 10% everywhere within R=17.5), , and as a function of galactocentric radius. The data has been averaged in azimuth assuming a disk inclined at 50 to the line of sight. For 12CO and the Galactic conversion factor, for the inner 5 and rises to 3 - 4 by the end of the bar. This dependence is driven primarily by the rapid drop in gas surface density just outside the nucleus together with the fact the velocity dispersion of the gas remains fairly large ( km s-1) along the entire molecular bar. At first glance this is consistent with gravitational instabilities driving the starburst. But note that this depends on the overestimated H2 mass from the standard conversion factor. If we use derived from optically thin 13CO emission, a rather different picture appears. In this case derived ’s would be effectively constant with radius over much of the bar and the disk would be stable everywhere. This suggests that the starburst is not a result of gravitational instabilities in a disk alone and possibly that the large shear/non-circular motions in the strong bar act to inhibit star formation in the arms. The morphology of CO and the starburst’s location at the inner terminus of the bar (Fig. 8) argue for bar induced cloud-cloud collisions as inflowing molecular gas piles up in the nucleus.
5. Enhanced Star Formation Efficiency in the Nucleus
From the nuclear mass and disk mass determinations, and the star formation rates (SFR), we can compare nuclear and disk star formation efficiencies (SFE). We consider three representations of SFE: 1) the gas consumption timescale, , 2) the ratio of the mass of formed stars to total mass available in stars + gas, , and 3) LIR/Mgas.
We obtain the SFR for disk (0.5 kpc R 4.3 kpc, not inclination corrected) and nucleus (R 500 pc) in different ways. We estimate the nuclear SFR from our free-free fluxes for the inner 5″ region, as described in 4.1 (which are also consistent with the 11.7µm LWS flux). We obtained , equivalent to , or a total stellar mass associated with the young stars of , and an estimated SFR . For the disk SFR, we cannot use our radio continuum maps, since they are not sensitive to extended emission. To estimate the SFR of the disk, we use the IRAS 12µm flux and subtract off the nuclear contribution using our 11.7µm LWS flux. About half of the IRAS 12µm flux originates from the inner 5″ of IRAS 04296. The total disk SFR is only slightly higher than that of the nuclear starburst, at SFR, or 2–5 times that of the Milky Way. The total predicted luminosity in massive stars (if we assume the 12µm flux is excited by OB stars) produces only half of the observed total infrared luminosity, which will also have contributions from both older populations of stars and regions of exclusively low mass star formation. Our SFR value for the disk may therefore be an underestimate of the true SFR, but only significantly so if the predominant mode of star formation is exclusively low mass, which we view as unlikely.
To determine the nuclear SFE, we use the nuclear gas mass (from 13CO including He) is . The nuclear SFE can then be represented as –50, with the uncertainty due to the gas mass. This is high, but within the range found for starburst galaxies (Young & Scoville, 1991). The surface density of star formation for this region is then (R 500 pc) . The surface density of gas, which we assume is all molecular, is . This SFE point lies about an order of magnitude above the nominal relation for the Kennicutt-Schmidt law (Kennicutt, 1998), although within the scatter. The gas depletion timescale, yrs, 50 times shorter than the disk value of Gyr found for the 23 local spiral galaxies of the THINGS survey (Leroy et al., 2008) and more than 20 times shorter than the 1 Gyr in M51 (Kennicutt et al., 2007; Blanc et al., 2009) at similar gas surface densities. In terms of the percentage of molecular mass converted to stars, over the 500 pc of our CO beam, and is almost certainly significantly higher on smaller GMC scales. This SFE is already somewhat high for GMC scales of 50 pc or more, but is characteristic of SFEs seen in the Galaxy on cluster (10 pc) scales (e.g. Lada & Lada, 2003). Therefore star formation appears to progress at an elevated, but not unusual efficiency in the nucleus.
From the SFR and molecular gas mass estimated for the disk, we can compute the disk SFE. Using the Galactic value of the CO-H2 conversion factor appropriate for disks, we compute a disk-only molecular gas mass of , which is 10 times the mass of the nuclear gas. The SFR over the entire disk, by contrast, is comparable to that of the nucleus, at SFR,. We find uncertain to about a factor of two largely due to gas mass. This is similar, within the uncertainties, to the global Galactic value of 8 (Young & Scoville, 1991, corrected to our value of ). The surface density of star formation is then . The surface density of gas, which we assume is all molecular in this region, is . The disk SFE can also be represented by , or a gas consumption timescale of yrs. The gas consumption timescale is a factor of six shorter than the typical THINGS galaxy (Leroy et al., 2008), and a factor of three shorter than the average value for M51 (Blanc et al., 2009). In terms of percentage of molecular gas converted into stars, Within the uncertainties, this is consistent with the SFE of 1% observed for Galactic disk star formation on GMC scales (Lada & Lada, 2003; Ikeda et al., 2007; Higuchi et al., 2009; Johnston et al., 2009).
A low disk SFE is consistent with the model of a nuclear starburst produced through secular evolution. If nuclear star formation is seen, it means that fresh gas must be present in the nucleus, else it would have formed stars long ago. In a morphologically undisturbed galaxy such as IRAS 04296, the nuclear gas must be a product of secular evolution. If the SFE of the disk were higher, then the gas would be used up before it arrived in the nucleus. Much of the molecular gas presently lies within 1.7 kpc (12″) of the center. At this radius the orbital timescale is yrs. If we estimate the velocity for the outermost gas in IRAS 04296 to drift inward via secular evolution to be a few km s-1 (§3.3 Athanassoula, 1992; Kormendy & Kennicutt, 2004), then the timescale for all of the CO gas in the disk of IRAS 04296 to drift into the nucleus is 1 Gyr. The star formation timescale averaged over the disk is yrs. If the SFE were much larger than this, then there would be no build-up of nuclear gas, and we would not see strong nuclear star formation.
We conclude that the SFE in the nucleus of IRAS 04296 is an order of magnitude higher than the SFE in its disk. The value %, for the disk of IRAS 04296 is consistent with the Milky Way value of 1% on GMC scales. The value of 5% found for the nucleus is consistent with SFE values on cluster (10 pc) scales in the Galaxy. The corresponding star formation timescales are yrs for the nucleus and yrs for the disk. While the disk percolates along at normal Galactic disk SFRs, the starburst mode “waits” until the gas has drifted to the nucleus.
6. Comparison of IRAS 04296 with other Nearby Galaxies and LIRGs
IRAS 04296 is a LIRG of the local universe. We now place IRAS 04296 in the context of the other better-known members of that class: NGC 2146, NGC 7552, NGC 4418, NGC 1365 and NGC 1068. NGC 1068 and NGC 1365 contain active nuclei which contribute significant fractions of their total luminosity. NGC 7552 hosts a weak LINER. NGC 4418 is thought to be a Seyfert 2 because it contains a very a compact bright nucleus (Eales et al., 1990; Evans et al., 2003), but it is no more compact than the infrared continuum from IRAS 04296. NGC 4418 actually resembles a compact nuclear starburst more than the composite galaxies with which it is usually classed. NGC 2146, along with the less luminous galaxies M82 and the Antennae, are thought, like IRAS 04296, to be pure starbursts.
In contrast to NGC 4418 and IRAS 04296, star formation is more spatially extended in the remainder of the LIRGs. NGC 7552 and NGC 1068 have kpc-scale starburst rings, well outside the nucleus. The starburst-dominated galaxies, NGC 2146, NGC 1365, M82, and the Antennae, have starbursts extended over many hundreds of parsecs. NGC 7552 and NGC 1365 are the only other starburst-dominated local LIRG that does not appear overly disturbed; both have barred stellar appearances similar to IRAS 04296’s. NGC 7552 may have experienced a similar dynamical history to IRAS 04296, namely slow, bar-mediated evolution, although in IRAS 04296’s case the starburst is concentrated in the nucleus, whereas NGC 7552’s enhanced star formation occurs well before the gas reaches the nucleus.
The local universe LIRGs are a surprisingly diverse class. Many of the differences are probably because they are at different evolutionary stages but others appear to be more fundamental. They may perhaps relate to the underlying causes and mechanisms of the starbursts.
7. Conclusions: First Look at IRAS 04296, A Bar-Driven Starburst Turning On
The little-studied nearby (29 Mpc) LIRG, IRAS 04296, is a barred and normal-appearing spiral galaxy, with an intense nuclear starburst and a vast reservoir of molecular gas. Mid-IR and radio continuum imaging show that IRAS 04296 currently has a bright nuclear starburst containing the equivalent of O7 stars (). This 150 pc region alone has the equivalent of more than half the star-forming luminosity in the entire 500 pc starburst region in M82. The nuclear starburst region accounts for 50% of the total current star formation in the galaxy as measured by 11.7µm continuum flux, and contributes 20% of the total IRAS luminosity of IRAS 04296. The starburst luminosity is concentrated in a double source that is 50 pc in size, located near the inner end of the northwestern bar arm. Radio and mid-IR images suggest that these are the HII regions associated with two massive young super star clusters containing a total of of stars, and a total young stellar luminosity of .
The morphology and kinematics of the CO emission of IRAS 04296 show a starburst that is being fueled by slow gas inflow along a bar. We can estimate the history and lifetime of the starburst from the gas content and inflow velocity. If the velocity of gas inflow to the nuclear starburst is the maximum value of the average observed bar-induced peculiar velocity, 20 km s-1, a net radial inflow of gas along the arm width (750 pc at 10) of 9 M⊙ yr-1 results (for a Galactic conversion factor relevant to the arms). For more expected net inflow rates of a few percent of the orbital velocity (Athanassoula, 1992), 1 M⊙ yr-1. The star formation rate in IRAS 04296 from the thermal radio continuum is consistent with a current, nuclear star formation rate of SFR M⊙ yr-1 and as much as SFR M⊙ yr-1 total for the galaxy as a whole. The nuclear star formation is not in equilibrium with the net inflow rate and hence the starburst is currently consuming its reservoir of nuclear fuel faster than it is being replenished.
Stellar mass buildup also dictates that the current rate of nuclear star formation is not sustainable over the long term, that it is a true starburst. Subtracting the gas mass from the dynamical mass leaves a small nuclear stellar mass of M⊙. Nuclear star formation also could not have been occurring at the current 12 M⊙ yr-1 rate for more than the past yrs or the stellar mass would exceed the observed dynamical mass.
We also find that the star formation efficiency is a function of position in the galaxy. We derive a starburst timescale of yrs for the nucleus (R 500 pc), or =5%; the star formation timescale is ten times longer in the disk, and the SFE is only =0.5%. The relatively low SFE observed in the disk, where the gas consumption timescale is 5 orbital times, is necessary so that gas drifting into the nucleus along the bar orbits would not be consumed before it reached the center. Any higher value for the disk SFE would be inconsistent with a nuclear starburst fueled by gas drifting inward via bar inflow.
Taken together these facts imply that we are witnessing an early stage of starburst / bar inflow induced secular evolution in the history of IRAS 04296. Otherwise the bulge would be much larger and the disk depleted of its gas.
References
- Armus et al. (2007) Armus, L., et al. 2007, ApJ, 656, 148
- Athanassoula (1992) Athanassoula, E. 1992, MNRAS, 259, 345
- Binney & Tremaine (1987) Binney, J., & Tremaine, S. 1987, Princeton, NJ, Princeton University Press, 1987, p.747
- Blanc et al. (2009) Blanc, G. A., Heiderman, A., Gebhardt, K., Evans, N. J., & Adams, J. 2009, ApJ, 704, 842
- Brandl et al. (2004) Brandl, B. R., et al. 2004, ApJS, 154, 188
- Chamaraux et al. (1995) Chamaraux, P., Kazes, I., Saito, M., Yamada, T., & Takata, T. 1995, A&A, 299, 347
- Clemens et al. (2008) Clemens, M. S., Vega, O., Bressan, A., Granato, G. L., Silva, L. & Panuzzo, P. 2008, A&A, 477, 95
- Condon (1992) Condon, J. J., 1992, ARA&A, 30, 575
- Condon et al. (1996) Condon, J. J., Helou, G., Sanders, D. B., & Soifer, B. T. 1996, ApJS, 103, 81
- Condon et al. (1991) Condon, J. J., Huang, Z.-P., Yin, Q. F., & Thuan, T. X. 1991, ApJ, 378, 65
- Dahmen et al. (1998) Dahmen, G., Huttemeister, S., Wilson, T. L., & Mauersberger, R. 1998, A&A, 331, 959
- Downes & Solomon (1998) Downes, D., & Solomon, P. M. 1998, ApJ, 507, 615
- Downes et al. (1993) Downes, D., Solomon, P. M., & Radford, S. J. E. 1993, ApJ, 414, L13
- Eales et al. (1990) Eales, S. A., Becklin, E. E., Hodapp, K.-W., Simons, D. A., & Wynn-Williams, C. G. 1990, ApJ, 365, 478
- Evans et al. (2003) Evans, A. S., et al. 2003, AJ, 125, 2341
- Frerking et al. (1982) Frerking, M. A., Langer, W. D. & Wilson, R. W. 1982, ApJ, 262, 59
- Genzel et al. (1982) Genzel, R., Becklin, E. E., Moran, J. M., Reid, M. J., Jaffe, D. T., Downes, D., & Wynn-Williams, C. G. 1982, ApJ, 255, 527
- Genzel et al. (1998) Genzel, R., et al. 1998, ApJ, 498, 579
- Ho et al. (1989) Ho, P. T. P., Turner, J. L., Fazio, G. G., & Willner, S. P. 1989, ApJ, 344, 135
- Higuchi et al. (2009) Higuchi, A. E., Kurono, Y., Saito, M., & Kawabe, R. 2009, ApJ, 705, 468
- Hunter et al. (1997) Hunter, S. D. et al. 1997, ApJ, 481, 205
- Ikeda et al. (2007) Ikeda, N., Sunada, K., & Kitamura, Y. 2007, ApJ, 665, 1194
- Jackson & Ho (1988) Jackson, J. M., & Ho, P. T. P. 1988, ApJ, 324, L5
- Johnston et al. (2009) Johnston, K. G., Shepherd, D. S., Aguirre, J. E., Dunham, M. K., Rosolowsky, E., & Wood, K. 2009, ApJ, 707, 283
- Joseph & Wright (1985) Joseph, R. D., & Wright, G. S. 1985, MNRAS, 214, 87
- Kennicutt (1998) Kennicutt, R. C., Jr. 1998, ApJ, 498, 541
- Kennicutt et al. (2007) Kennicutt, R. C., Jr., et al. 2007, ApJ, 671, 333
- Kormendy & Kennicutt (2004) Kormendy, J., & Kennicutt, R. C., Jr. 2004, ARA&A, 42, 603
- Lada & Lada (2003) Lada, C. J., & Lada, E. A. 2003, ARA&A, 41, 57
- Leitherer et al. (1999) Leitherer, C., et al. 1999, ApJS, 123, 3
- Leroy et al. (2008) Leroy, A. K., Walter, F., Brinks, E., Bigiel, F., de Blok, W. J. G., Madore, B., & Thornley, M. D. 2008, AJ, 136, 2782
- Lindblad & Lindblad (1994) Lindblad, P. O., & Lindblad, P. A. B. 1994, ASP Conf. Ser. 66: Physics of the Gaseos and Stellar Disks of the Galaxy, 66, 29
- Lutz et al. (1998) Lutz, D., Spoon, H. W. W., Rigopoulou, D., Moorwood, A. F. M., & Genzel, R. 1998, ApJ, 505, L103
- Martins et al. (2005) Martins, F., Schaerer, D., & Hillier, D. J. 2005, A&A, 436, 1049
- Mauersberger et al. (1996) Mauersberger, R., Henkel, C., Wielebinski, R., Wiklind, T., & Reuter, H.-P. 1996, A&A, 305, 421
- Meier & Turner (2001) Meier, D. S. & Turner, J. L. 2001, ApJ, 551, 687
- Meier & Turner (2004) Meier, D. S., & Turner, J. L. 2004, AJ, 127, 2069
- Meier, Turner & Hurt (2000) Meier, D. S., Turner, J. L. & Hurt, R. L. 2000, ApJ, 531, 200
- Meier, Turner & Hurt (2008) Meier, D. S., Turner, J. L. & Hurt, R. L. 2008, ApJ, 675, 281
- Narayanan et al. (2005) Narayanan, D., Groppi, C. E., Kulesa, C. A., & Walker, C. K. 2005, ApJ, 630, 269 Wielebinski, R. 1998, A&A, 339, 737
- Paglione et al. (2001) Paglione, T. A. D., et al. 2001, ApJS, 135, 183
- Safronov (1960) Safronov, V. S. 1960, Annales d’Astrophysique, 23, 979
- Sakamoto et al. (1999) Sakamoto, K., Okumura, S. K., Ishizuki, S. & Scoville, N. Z. 1999, ApJS, 124, 403
- Sanders et al. (2003) Sanders, D. B., Mazzarella, J. M., Kim, D.-C., Surace, J. A., & Soifer, B. T. 2003, AJ, 126, 1607
- Sanders & Mirabel (1996) Sanders, D. B., & Mirabel, I. F. 1996, ARA&A, 34, 749
- Sanders et al. (1988) Sanders, D. B., Soifer, B. T., Elias, J. H., Madore, B. F., Matthews, K., Neugebauer, G., & Scoville, N. Z. 1988, ApJ, 325, 74
- Scoville et al. (1994) Scoville, N. Z., Carlstrom, J., Padin, S., Sargent, A., Scott, S. & Woody, D. 1994, Astronomy with Millimeter and Submillimeter Wave Interferometry, IAU Colloquium 140, ASP Conference Series, Vol. 59, 1994, M. Ishiguro and J. Welch, Eds., p.10
- Scoville et al. (1991) Scoville, N. Z., Sargent, A. I., Sanders, D. B. & Soifer, B. T. 1991, ApJ, 365, L5
- Soifer et al. (1987) Soifer, B. T., Sanders, D. B., Madore, B. F., Neugebauer, G., Danielson, G. E., Elias, J. H., Lonsdale, C. J., & Rice, W. L. 1987, ApJ, 320, 238
- Solomon, Downes & Radford (1992) Solomon, P. M., Downes, D. & Radford, S. J. E. 1992, ApJ, 387, L55
- Solomon et al. (1987) Solomon, P. M., Rivolo, A. R., Barrett, J., & Yahil, A. 1987, ApJ, 319, 730
- Solomon et al. (1997) Solomon, P. M., Downes, D., Radford, S. J. E., & Barrett, J. W. 1997, ApJ, 478, 144
- Strauss et al. (1992) Strauss, M. A., Huchra, J. P., Davis, M., Yahil, A., Fisher, K. B., & Tonry, J. 1992, ApJS, 83, 29
- Strong et al. (1988) Strong, A. W. et al. 1988, A&A, 207,1
- Toomre (1964) Toomre, A. 1964, ApJ, 139, 1217
- Turner & Ho (1994) Turner, J. L., & Ho, P. T. P. 1994, ApJ, 421, 122
- Vázquez & Leitherer (2005) Vázquez, G. A., & Leitherer, C. 2005, ApJ, 621, 695
- Wada (1994) Wada, K. 1994, PASJ, 46, 165
- Walter et al. (2002) Walter, F., Weiss, A., & Scoville, N. 2002, ApJ, 580, L21
- Weiss et al. (2001) Weiss, A., Neininger, N., Hüttemeister, S. & Klein, U. 2001, A&A, 365, 571
- Wilson et al. (2003) Wilson, J. C. et al. 2003, SPIE, 4841, 451
- Wilson & Rood (1994) Wilson, T. L. & Rood, R. 1994, ARA&A, 32, 191
- Yao et al. (2003) Yao, L., Seaquist, E. R., Kuno, N., & Dunne, L. 2003, ApJ, 588, 771
- Young et al. (1988) Young, J. S., Claussen, M. J., Kleinmann, S. G., Rubin, V. C., & Scoville, N. 1988, ApJ, 331, L81
- Young et al. (1995) Young, J. S., et al. 1995, ApJS, 98, 219
- Young & Scoville (1991) Young, J. S., & Scoville, N. Z. 1991, ARA&A, 29, 581
| Characteristic | Value | Reference |
|---|---|---|
| Dynamical CenteraaBased on the best fitting Brandt rotation curve (§3). | 1 | |
| (kinematic) | ||
| 2m peak (2MASS) | 1 | |
| VlsraaBased on the best fitting Brandt rotation curve (§3). | 2086 kms-1 | 1 |
| Adopted Distance | 29 Mpc | 1 |
| Position AngleaaBased on the best fitting Brandt rotation curve (§3). | 252o | 1 |
| Inclination | 50o | 1 |
| Rmax(J band) | 8.1 kpc | 1 |
| (rotation curve)aaBased on the best fitting Brandt rotation curve (§3). | 2.15 kpc | 1 |
| aaBased on the best fitting Brandt rotation curve (§3). | 190 km s-1 | 1 |
| aaBased on the best fitting Brandt rotation curve (§3). | 1.25 | 1 |
| bbBased on the best fitting bar model (Figure 9). | -85o | 1 |
| bbBased on the best fitting bar model (Figure 9). | 43 km s-1 kpc-1 | 1 |
| M( 500 pc)ddFrom 13CO(1–0) (§4.2). | 1 | |
| ( 500 pc)ddFrom 13CO(1–0) (§4.2). | 550 M⊙ pc-2 | 1 |
| Mdyn ( 500 pc)aaBased on the best fitting Brandt rotation curve (§3). | 1 | |
| M(4.3 kpc)ccAssuming the standard CO conversion factor (§4.2). | 1 | |
| Mdyn ( kpc)aaBased on the best fitting Brandt rotation curve (§3). | 1 | |
| 3 | ||
| IRAS 12, 25, 60, 100 | 1.39, 5.90, 42.1, 48.3 Jy | 2 |
| LIR | 2 |
References. — (1) This paper; (2) Sanders et al. (2003); (3) Chamaraux et al. (1995)
| r.m.s. | Beam (Robust=0) | Peak Flux | Total Mappeda,ba,bfootnotemark: | Cut Fluxb,cb,cfootnotemark: | Cut Fluxb,cb,cfootnotemark: | ||
|---|---|---|---|---|---|---|---|
| mJy/bm | ″″, pa∘ | ″ | mJy/bm | mJy | mJy | mJy | |
| 20 cm | 0.11 | 1.601.35, 82.8 | 38 | 32 | 130 10 | 71 5 | … |
| 6 cm | 0.04 | 0.480.39, -83.3 | 10 | 3.8 | 59 5 | 28 3 | … |
| 3.6 cm | 0.034 | 0.250.21, 88.2 | 7 | 1.5 | 25 5 | 14 2 | 11 2 |
| 2 cm | 0.085 | 0.180.138, -53.9 | 4 | 1.0 | 10 1 | … | 10 2 |
| 1.3 cm | 0.068 | 0.10.09, -80.39 | 2 | 0.5 | 7 1.5 | … | 7 1.5 |
| 1.3 cm BC array | 0.16 | 0.910.30, 76 | 20 | 3.7 | 23 5 | 18 3 | … |
| 2.7 mm | 0.75 | 4.63.8, 8 | 52 | 9.9 | 11 2 | … | … |
| 11.7 m | 5.1 cts/s | 0.4 | n.a. | 7110 | 680 100 | … | … |