First-Principles Study on Structural Properties of GeO2 and SiO2 under Compression and Expansion Pressure
Abstract
The detailed analysis of the structural variations of three GeO2 and SiO2 polymorphs (-quartz, -cristobalite, and rutile) under compression and expansion pressure is reported. First-principles total-energy calculations reveal that the rutile structure is the most stable phase among the phases of GeO2, while SiO2 preferentially forms quartz. GeO4 tetrahedras of quartz and cristobalite GeO2 phases at the equilibrium volume are more significantly distorted than those of SiO2. Moreover, in the case of quartz GeO2 and cristobalite GeO2, all O-Ge-O bond angles vary when the volume of the GeO2 bulk changes from the equilibrium point, which causes further deformation of tetrahedra. In contrast, the tilt angle formed by Si-O-Si in SiO2 markedly changes. This flexibility of the O-Ge-O bonds reduces the stress at the Ge/GeO2 interface due to the lattice-constant mismatch and results in the low defective interface observed in the experiments [Matsubara et al.: Appl. Phys. Lett. 93 (2008) 032104; Hosoi et al.: Appl. Phys. Lett. 94 (2009) 202112].
1 Introduction
Ge has recently attracted increasing attention for future advanced complementary metal oxide semiconductor (CMOS) device structures owing to its high intrinsic carrier mobility as it is becoming increasingly difficult to enhance the performance of CMOS devices through scaling based on conventional Si-based techniques. The key issue to be resolved in advanced Ge-based devices is the formation of gate stacks with superior interface properties. Research activity related to GeO2 is steadily increasing, and it has been reported that Ge is well passivated by GeO2 by conventional dry oxidation without any hydrogen passivation treatment [1, 2]. On the theoretical side, Houssa et al. claimed that the viscoelastic properties of GeO2 lead to a low interface defect density at the Ge/GeO2 interface after performing a calculation using a modified Maxwell model [3]. In our previous study, we examined the oxidation mechanism of crystalline GeO2 and Ge(100) interfaces by a first-principles total energy calculation following the Si(100) oxidation process proposed by Kageshima and Shiraishi [4], and we found that Ge atom emission, which deteriorates the Ge/GeO2 interface, hardly occurs during the oxidation process of Ge(100) [5]. To investigate the low probability of Ge atom emission, the mechanism accounting for the release of interface stress should be clarified.
From the viewpoint of phase transition, SiO2 occurs in many different forms. At ambient temperature and pressure, the ground-state structure for SiO2 is -quartz (q-SiO2). SiO2 forms a rutile structure (r-SiO2) under a pressure above 2 GPa and it is transformed into -cristobalite (c-SiO2) at a high temperature. On the other hand, there are two stable polymorphs of GeO2 at normal pressures: the low temperature form has the rutile structure (r-GeO2), and GeO2 undergoes a smooth transformation to -quartz (q-GeO2) at 1300 K. An -cristobalite structure (c-GeO2) has been identified after the long-time heating of GeO2 glass at 873 K [6]. The investigation of the c-GeO2 phase is important because Ge substrates are typically subjected to dry oxidation in an O2 ambient at 623-823 K to form a GeO2 layer in recent experiments [2, 7].
Here, we investigate the structural properties of q-, c-, and r-GeO2 by first-principles total energy calculations. The structural properties of SiO2 are also examined for comparison. It was found that the rutile structure of GeO2 is the most stable structure, whereas SiO2 preferentially forms the quartz structure. We then investigate the variations of the O-Ge-O (O-Si-O) bond angles of quartz and cristobalite phases with respect to the volume since local pressure is induced at the semiconductor/oxide interface. Although the variations of the atomic structures of q-GeO2, r-GeO2, q-SiO2, c-SiO2, and r-SiO2 under pressure have been examined by both experimental and theoretical studies [8, 9, 10, 11, 12, 13, 14, 15, 16, 17, 18, 19, 20], no study reports the relationship between their bond angles and pressure of these six oxides in the same treatment of computational code or experimental facility. We note that the lattice constant (bulk modulus) of q-SiO2 reported by the first-principles calculation [15] is smaller (larger) by more than 3 (34 ) than the one reported by another first-principles study [16]. Moreover, it is reported that a dioxide forms a cristobalite structure before the atom emission as well as at the initial stage of oxidation [4]. The pressure-dependent behavior of c-GeO2, which has never been explored to the best of our knowledge, is a subject of intense research to clarify the relaxation mechanism of the interface stress. Therefore, it is of importance that the uniform theoretical treatment facilitates systematic comparisons and the identification of trends among these six oxides. Our finding is that the O-Ge-O bond angles change significantly under pressure, while the tilt angle and Si-O bond length vary in the case of SiO2. The variation of the bonding network of GeO2 exhibits completely different characteristics from that of SiO2. The metallic properties of Ge provide a qualitative understanding of not only the difference between the ground-state phases of GeO2 and SiO2 but also the variations of the bond angles under pressure.
The rest of this paper is organized as follows. In § 2, we describe the computational techniques used in this study. In § 3, we present the main results and a discussion of the structural parameters and properties. Finally, a brief summary is given in § 4.
2 Computational Techniques
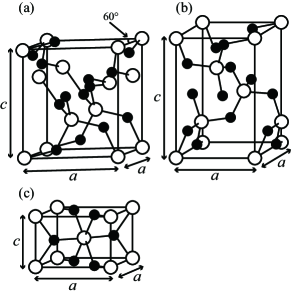
The structures of q-, c-, and r-GeO2 are hexagonal, tetragonal, and tetragonal with three, four, and two GeO2 molecules per unit cell, respectively. Ge atoms in q- and c-GeO2 are surrounded by four oxygen atoms, while each Ge atom in r-GeO2 is surrounded by six oxygen atoms with distorted octahedral coordination as shown in Fig. 1. The calculations are performed within the local density approximation [21] of density functional theory [22, 23] using the real-space finite-difference approach [24, 25, 26, 27, 28] and the norm-conserving pseudopotentials [29] of Troullier and Martins [30] in the Kleinman-Bylander representation [31]. The grid spacing was set at 0.25 bohr, and a denser grid spacing of 0.083 bohr in the vicinity of nuclei with the augmentation of double-grid points [27] for each GeO2 polymorph. We took , , and k-point grids in the Brillouin zone for q-, c-, and r-GeO2, respectively. The optimal lattice parameters and internal atomic coordinates were determined by minimization of the total energy using calculated forces, with a force tolerance of F 1.0 mH/bohr. The same computational procedures were applied for SiO2 polymorphs.
3 Results and Discussion
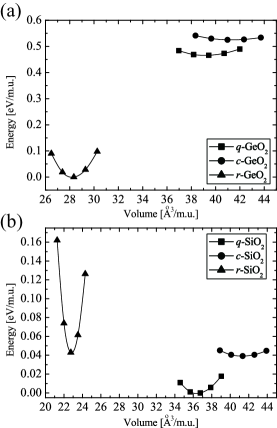
Figures 2 (a) and (b) show the total energy per molecular unit as a function of volume for the three structures of GeO2 and SiO2, respectively. The zeros of the energy scales are rutile for GeO2 and quartz for SiO2. It was found that the zero-temperature phase in GeO2 has the rutile structure while that in SiO2 exhibits the quartz structure, which is in good agreement with a previous report [18, 32]. Sn, which is also a group IV element similarly to Si and Ge, is a metal and its oxide crystallizes in the rutile structure under ambient conditions [33]. GeO2 forms the sixfold-coordinated rutile structure more preferentially than SiO2 because Ge is between Si and Sn in the periodic table. Tables 1 and 2 show the calculated lattice constants, bond lengths , bond angles , and tilt angles of GeO2 and SiO2. The other calculated and experimental results are also given [20, 34, 35, 9, 36, 37, 10]. There are two distinct Ge-O (Si-O) bond lengths in GeO4 (SiO4) tetrahedra. In addition, exactly corresponds to the O-Ge-O (O-Si-O) bond angle, and the tilt angle is related to the Ge-O-Ge (Si-O-Si) bond angle [38, 39]. The agreement between our results and experimental results for SiO2 is excellent for the structural parameters. The lattice constants of q- and c-GeO2 are slightly underestimated in both the theoretical calculations: this underestimation is caused by the use of the local density approximation [21], and the parameters obtained by the theoretical calculations agree well. The deviations of the O-Ge-O bond angles from the ideal tetrahedral angle (109.5∘) are larger than those for O-Si-O, resulting in distorted GeO4 tetrahedra.
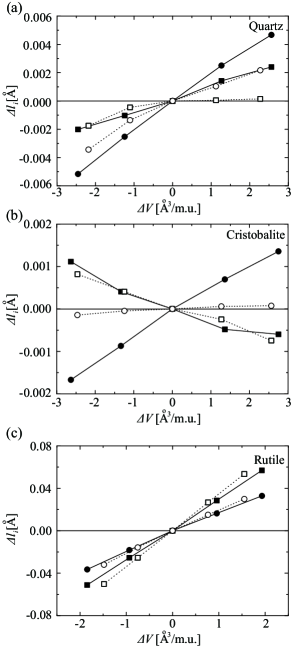
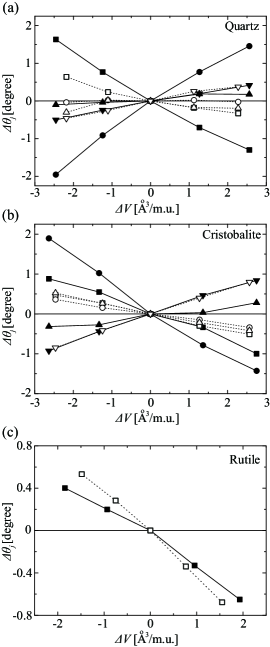
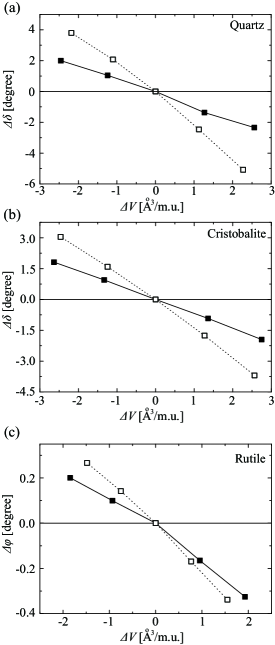
Thermally oxidized GeO2 on a Ge substrate has been found to mainly form the fourfold-coordinated structure by X-ray photoelectron spectroscopy [40], and crystalline q- and c-SiO2 are formed on a Si(100) surface according to the oxidation model of the Si(100) surface [4]. The compressive in-plane stress at the Ge/GeO2 (Si/SiO2) interface is induced by the lattice mismatch between Ge (Si) and its oxide. Therefore, we particularly focus on the bond structures of crystalline q- and c-GeO2 assuming that the oxidation mechanism of Ge is the same as that of Si. Figures 3, 4, and 5 show the variations of the Ge-O (Si-O) bond lengths, the O-Ge-O (O-Si-O) bond angles, and the tilt angles with respect to the volume, respectively. In the case of the rutile phases, we depict the variations of the Ge-O-Ge (Si-O-Si) bond angles instead of the tilt angles since the rutile structure has a higher symmetry than the others. The models at elevated pressures do not exhibit the amorphous phase or transform into another phase because the calculated O-Ge-O and O-Si-O bond angles show no indication that the tetrahedra become significantly more irregular or distorted. Although the lattice constants are varied by increments of 1%, the variations of the bond lengths are less than 0.1%. This indicates that the bond angles play a predominant role in the compression or expansion of the fourfold oxides. Note that the bond lengths in the sixfold oxides change under pressure due to the higher symmetry of the O-Ge-O (O-Si-O) bond angles as well as the Ge-O-Ge (Si-O-Si) ones. The variations of the O-Ge-O bond angles are larger than those of O-Si-O [Figs. 4(a) and 4(b)], whereas the tilt angles in SiO2 vary more significantly than those in GeO2 [Figs. 5(a) and 5(b)] with respect to the volume. These results indicate the strong rigidity of the O-Si-O bonds. The experimental study reported that the O-Ge-O bond angles markedly change in q-GeO2, while the tilt angle in q-SiO2 varies significantly as the pressure increases, which agrees well with our result [8]. The metallic property of Ge, as mentioned above, is also attributed to the distorted GeO4 tetrahedra and the variation of the O-Ge-O bond angles from the ideal tetrahedral angle. This characteristic of the O-Ge-O bonds leads to markedly reduced lattice stress at the Ge/GeO2 interface during the oxidation process compared with its Si counterpart. Kageshima and Shiraishi reported that SiO2 forms a cristobalite structure at the initial stage of Si oxidation transforms into a quartz structure after the Si atom at the Si/SiO2 interface has been ejected to release the interface stress [4]. We also investigated the emission of Ge atoms from the Ge/c-GeO2 interface following their model and found that Ge atoms are hardly emitted [5]. We have concluded that this is because the dispersion of the bond angles around the suboxidized Ge atom at the Ge/GeO2 interface is larger than that around the Si atom at the Si/SiO2 interface. The present result that the bond angles around Ge atoms in c-GeO2 also more drastically change than those around Si atoms as well as those in the other phases supports the conclusion in our preceding study.
4 Conclusions
We have calculated the bond lengths and bond angles of the rutile, -cristobalite, and -quartz phases of GeO2 and SiO2 using first-principles electronic-structure calculations. It was found that rutile GeO2 is the most stable phase among the structures of GeO2 examined here while SiO2 preferentially forms the quartz structure, which agrees well with previous first-principles results. Symmetry allows four different O-Ge-O (O-Si-O) tetrahedral angles in GeO4 (SiO4) in the case of the cristobalite and quartz phases, and the angles in GeO4 are more distorted from the ideal tetrahedral angle (109.5∘) than those in SiO4 at the equilibrium volume. Moreover, we have also examined the variation of the bond lengths and bond angles with respect to volume and found that the mechanisms leading to compression and expansion are markedly different between GeO2 and SiO2 even though the volume compressibilities and expansibilities are almost identical: the tetrahedra of GeO4 are significantly deformed under pressure whereas the tilting angle composed of two tetrahedras markedly varies in the case of SiO2. These characteristics of GeO2, i.e., the ground-state phase of the oxides and the difference in the variation of bond angles with respect to the volume, can be interpreted in terms of the metallic properties of the bond network of Ge. Thus, our results are highly relevant to the low defect density at the Ge/GeO2 interface because the deterioration of the interface is suppressed owing to the flexibility of the O-Ge-O bond angles.
Acknowledgements.
The authors would like to thank Professor Kikuji Hirose, Professor Yoshitada Morikawa, and Professor Heiji Watanabe of Osaka University, and Professor Kenji Shiraishi of University of Tsukuba for reading the manuscript and fruitful discussions. This research was partially supported by Strategic Japanese-German Cooperative Program from Japan Science and Technology Agency and Deutsche Forschungsgemeinschaft, by a Grant-in-Aid for Young Scientists B (No. 20710078), and also by a Grant-in-Aid for the Global COE ”Center of Excellence for Atomically Controlled Fabrication Technology” from the Ministry of Education, Culture, Sports, Science and Technology, Japan. The numerical calculation was carried out using the computer facilities of the Institute for Solid State Physics at the University of Tokyo, Center for Computational Sciences at University of Tsukuba, the Research Center for Computational Science at the National Institute of Natural Science, and the Information Synergy Center at Tohoku University.References
- [1] H. Matsubara, T. Sasada, M. Takenaka, and S. Takagi: Appl. Phys. Lett. 93 (2008) 032104.
- [2] T. Hosoi, K. Kutsuki, G. Okamoto, M. Saito, T. Shimura, and H. Watanabe: Appl. Phys. Lett. 94 (2009) 202112.
- [3] M. Houssa, G. Pourtois, M. Caymax, M. Meuris, M. M. Heyns, V. V. Afanas’ev, and A. Stesmans: Appl. Phys. Lett. 93 (2008) 161909.
- [4] H. Kageshima and K. Shiraishi: Phys. Rev. Lett. 81 (1998) 5936.
- [5] S. Saito, T. Hosoi, H. Watanabe, and T. Ono: Appl. Phys. Lett. 95 (2009) 011908.
- [6] H. Böhm: Naturwissenschaften 55 (1968) 648.
- [7] A. Delabie, F. Bellenger, M. Houssa, T. Conard, S. Van Elshocht, M. Caymax, M. Heyns, and M. Meuris: Appl. Phys. Lett. 91 (2007) 082904.
- [8] J. D. Jorgensen: J. Appl. Phys. 49 (1978) 5473.
- [9] L. Levien, C. T. Prewitt, and D. J. Weidner: Am. Mineral. 65 (1980) 920.
- [10] R. T. Downs and D. C. Palmer: Am. Mineral. 79 (1994) 9.
- [11] V. P. Prakapenka, G. Shen, L. S. Dubrovinsky, M. L. Rivers, and S. R. Sutton: J. Phys. Chem. Solids 65 (2004) 1537.
- [12] M. Vaccari, G. Aquilanti, S. Pascarelli, and O. Mathon: J. Phys.: Condens. Matter 21 (2009) 145403.
- [13] N. R. Keskar and J. R. Chelikowsky: Phys. Rev. B 46 (1992) 1.
- [14] F. Liu, S. H. Garofalini, D. King-Smith, and D. Vanderbilt: Phys. Rev. B 49 (1994) 12528.
- [15] D. R. Hamann: Phys. Rev. Lett. 76 (1996) 660.
- [16] Th. Demuth, Y. Jeanvoine, J. Hafner, and J. G. Ángyán: J. Phys.: Condens. Matter 11 (1999) 3833.
- [17] M. Catti, B. Civalleri, and P. Ugliengo: J. Chem. Phys. 104 (2000) 7259.
- [18] D. M. Christie and J. R. Chelikowsky: Phys. Rev. B 62 (2000) 14703.
- [19] M. Sahnoun, C. Daul, R. Khenata, and H. Baltache: Eur. Phys. J. B 45 (2005) 455.
- [20] C. Sevik and C. Bulutay: J. Mater. Sci. 42 (2007) 6555.
- [21] J. P. Perdew and A. Zunger: Phys. Rev. B 23 (1981) 5048.
- [22] P. Hohenberg and W. Kohn: Phys. Rev. 136 (1964) B864.
- [23] W. Kohn and L. J. Sham: Phys. Rev. 140 (1965) A1133.
- [24] J. R. Chelikowsky, N. Troullier, and Y. Saad: Phys. Rev. Lett. 72 (1994) 1240.
- [25] J. R. Chelikowsky, N. Troullier, K. Wu, and Y. Saad: Phys. Rev. B 50 (1994) 11355.
- [26] K. Hirose, T. Ono, Y. Fujimoto, and S. Tsukamoto: First-Principles Calculations in Real-Space Formalism, Electronic Configurations and Transport Properties of Nanostructures (Imperial College, London, 2005).
- [27] T. Ono and K. Hirose: Phys. Rev. Lett. 82 (1999) 5016.
- [28] T. Ono and K. Hirose: Phys. Rev. B 72 (2005) 085115.
- [29] We used the norm-conserving pseudopotentials NCPS97 constructed by K. Kobayashi. See K. Kobayashi: Comput. Mater. Sci. 14 (1999) 72.
- [30] N. Troullier and J. L. Martins: Phys. Rev. B 43 (1991) 1993.
- [31] L. Kleinman and D. M. Bylander: Phys. Rev. Lett. 48 (1982) 1425.
- [32] The difference in the formation energy between the q- and r-GeO2 phases obtained by our study is larger than that in ref. \citenchelikowsky because only one k-points in the Brillouin zone is used in ref. \citenchelikowsky. We confirmed that the total energy of q-GeO2 deviates by 0.28 eV/m.u. depending on the sampling point in the Brillouin zone in the case of one k-point sampling.
- [33] R. W. G. Wyckoff: Crystal Structures (Wiley, New York, 1965) Vol. 1.
- [34] G. S. Smith and P. B. Isaacs: Acta Crystallogr. 17 (1964) 842.
- [35] R. M. Hazen and L. W. Finger: J. Phys. Chem. Solids 42 (1981) 143.
- [36] J. J. Pluth, J. V. Smith, and J. Faber: J. Appl. Phys. 57 (1985) 1045.
- [37] M. Sugiyama, S. Endo, and K. Koto: Mineral. J. 13 (1987) 455.
- [38] H. Grimm and B. Dorner: J. Phys. Chem. Solids 36 (1975) 407.
- [39] M. O’Keefee and B. G. Hyde: Acta Crystallogr. Sect. B 32 (1976) 2923.
- [40] See, for example, A. Molle, Md. N. K. Bhuiyan, G. Tallarida, and M. Fanciulli: Appl. Phys. Lett. 89 (2006) 083504.
| Present work | Other works | Experiment | ||||||||
|---|---|---|---|---|---|---|---|---|---|---|
| Ref. | Ref. | |||||||||
| q-GeO2 | 4.897 | 5.636 | 4.870 | 5.534 | \citenh | 4.987 | 5.652 | \citensmith | ||
| c-GeO2 | 4.818 | 7.128 | 4.985 | 7.070 | \citenboehm | |||||
| r-GeO2 | 4.418 | 2.886 | 4.283 | 2.782 | \citenh | 4.397 | 2.863 | \citenhazen | ||
| q-SiO2 | 4.850 | 5.348 | 4.883 | 5.371 | \citenh | 4.916 | 5.405 | \citen25 | ||
| c-SiO2 | 4.925 | 6.828 | 4.950 | 6.909 | \citenh | 4.929 | 6.847 | \citenpluth | ||
| r-SiO2 | 4.147 | 2.662 | 4.175 | 2.662 | \citenh | 4.180 | 2.667 | \citen51 | ||
| q-GeO2 | Present work | 1.763 | 1.755 | 114.13 | 110.69 | 107.28 | 105.39 | 29.66 |
|---|---|---|---|---|---|---|---|---|
| Ref. \citensmith | 1.741 | 1.737 | 113.1 | 110.4 | 107.7 | 106.3 | 26.54 | |
| c-GeO2 | Present work | 1.760 | 1.760 | 120.69 | 111.39 | 109.95 | 101.72 | 35.64 |
| — | ||||||||
| r-GeO2 | Present work | 1.918 | 1.887 | 80.25 | ||||
| Ref. \citenhazen | 1.903 | 1.871 | 80.2 | |||||
| q-SiO2 | Present work | 1.608 | 1.603 | 110.58 | 109.37 | 109.23 | 108.55 | 17.85 |
| Ref. \citen25 | 1.614 | 1.605 | 110.52 | 109.24 | 108.93 | 108.81 | 16.37 | |
| c-SiO2 | Present work | 1.604 | 1.603 | 111.46 | 110.02 | 109.01 | 108.15 | 25.41 |
| Ref. \citen32 | 1.603 | 1.603 | 111.42 | 109.99 | 109.03 | 108.20 | 23.25 | |
| r-SiO2 | Present work | 1.786 | 1.751 | 81.02 | ||||
| Ref. \citen51 | 1.810 | 1.758 | 81.35 |