(kumar2010d.tex 22 July 2010)
Effect of pressure on the kinetics of bulge bases in small RNAs
Abstract
Using molecular dynamics simulations, we study the effect of pressure on the binding propensity of small RNAs by calculating the free energy barrier corresponding to the looped out conformations of unmatched base, which presumably acts as the binding sites for ligands. We find that the free energy associated with base looping out increases monotonically as the pressure is increased. Furthermore, we calculate the mean first passage time of conformational looping out of the base bulge using the diffusion of reaction coordinate associated with the base flipping on the underlying free energy surface. We find that the mean first passage time associated with bulge looping out increases slowly upon increasing pressures upto kbar but changes dramatically for kbar. Finally, we discuss our results in the light of the role of hydration shell of water around RNA.
I Introduction
RNA molecules are very diverse both structurally and functionally Cech1987 . Apart from having the regular helical purine-pyramidene base pairs, RNA molecules are also found to have many other secondary structures (motifs) such as loops, knots and bulges etc Wyatt1989 ; Hermann2000 . The presence of such structural motifs is found to play a role in binding of different molecules to RNA Lustig1998 . For many protein binding RNAs, it was found that the frequency of adenosine bulge at the binding site is very high. The presence of a bulge may change the conformational flexibility of an RNA Patel1982 ; Woodson1989 and hence more internal surface area of RNA is available for any chemistry. Moreover, the presence of the bulges does not only change the conformational flexibility but the bulges themselves may just flip out exposing the internal regions of a RNA to solvent and ligands. It has been shown that the bulge base looping out is highly sensitive to the bulge bases and their neighbors Patel1982 ; Woodson1989 , which makes the question of generality of any picture of base bulge looping out difficult.
Recent state of the art computer simulations of small RNAs have shed light on the base bulge looping out processes Andre06 ; Feig2001 ; Auffinger2007 in few of the possible cases. Specifically, these works have studied the free energy barriers associated with bulge base looping out process Andre06 . For example A. Barthel and M. Zacharias studied single uridine and adenosine bulge structures and their looping out using the torsional angle which measures the degree of looping out of bulge bases from the local helical plane. They find that the conformational free energy change in the case of adenosine bulge in a complete looping out process is higher by kcal.mol-1 as compared to the adenosine bulge Andre06 , suggesting that in a base nonspecific binding process a structure with single uracil bulge base would have higher propensity to flip out of helical plane. Although, a wealth of literature is available on the base looping from the helical plane at ambient conditions; the changes in the kinetics of bulge base flipping is rather unexplored at conditions away from ambient conditions.
It is known that water’s hydrogen bond network and so the local structure of liquid water changes upon changing thermodynamic conditions, giving rise to anomalous changes in the dynamics and thermodynamics of water and aqueous systems. The structural stability and kinetics of proteins (where structural stability usually implies kinetically functional) as a function of pressure and temperature. The solvation barrier in the case of proteins plays an important role both in the hydrophobic collapse of the polypeptides as well as the stability of these structures as a function of pressure and temperature. In this paper, we will investigate another class of molecules which are involved in ligand binding kientics and are very stable at high pressures and temperatures. One can ask questions whether the structural stability in these cases will also imply kinetic functionality. We specifically study the binding of a purine A based molecules to small RNAs with a single A-bulge structural motif. This study is relevant to understand the self-aminoacylation of small ribozymes illanga ; Lehmann2007 in different thermodynamic conditions. It is widely believed that for the purine A-based molecules such as ATP to bind to such a bulge, the A-bulge base has to flip out, which allows the purine A-based molecules to come and stack into the bulge configuration. In other words, for the binding to proceed the A-bulge has to overcome both the bending regidity and solvation energy barrier to solvate in water. The solvation of different substances in water is a widely studied problem tanford ; kdill ; lum ; ashbaugh ; garde ; widom . Indeed, studies of apolar solutes in water shows an ellipitic region in the pressure-temperature plane in which water behaves as a bad solvent and hence less solubility of these subtances buldyrev07 . However, study of solvation barrier of base flipping in case of RNA/DNA is not studied.
In this paper, we study the effect of pressure on the kinetics of bulge base looping out of a double strand RNA with single adenosine bulge. In section II, we discuss the method, in section III we present the results for the free energy barrier associated with torsional deviation of the bulge base from the local helical backbone, in section IV we present a mean first passage time calculation associated with looping out process and finally we discuss and summarize the results.
II System and Method
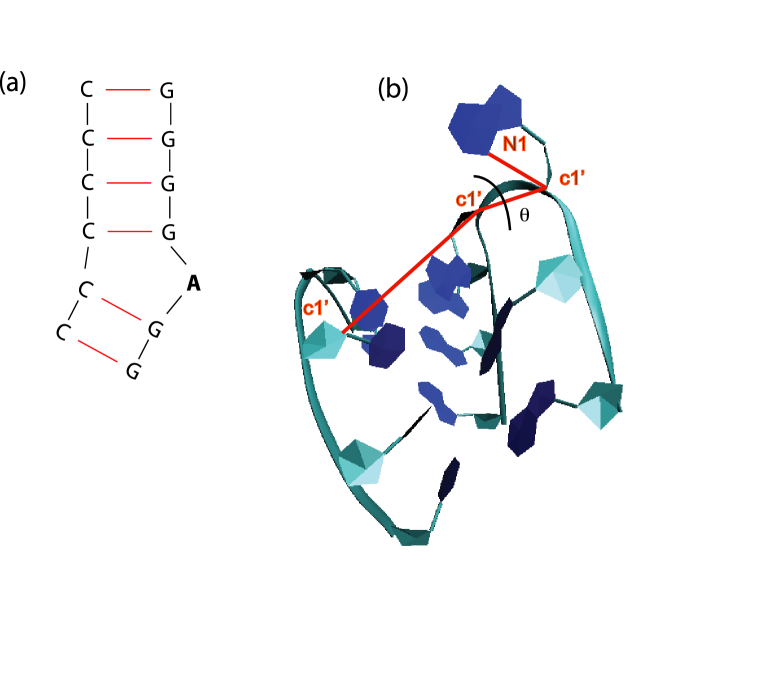
The energy minimized starting structure of the RNA with single A (5’-GGGGAGG-3’/5’-CCCCCC-3’) bulge was created using the NAB/Nucgen module of the Amber10 program suite (Fig. 1). The RNA structure was then solvated in 4000 TIP3P water molecules such that there was about nm space left between the boundary of the box and the RNA solute atoms. For electro-neutrality Na+ counter ions were added to the solution. Energy minimizations were carried using the steepest descent ( steps) in GROMACS3.3.3 gromacs1 ; gromacs2 with keeping the RNA atoms fixed. Simulations were carried out using the GROMACS3.3.3 program with the Amber99 force field with a periodic boundary conditions and integration time step of fs. The long range electrostatic interactions were treated with the particle-mesh-ewald (PME) method. After minimization the system was slowly heated to temperature T= K with positional restraints.
After the position restrained simulations, unrestrained Molecular Dynamics (MD) was carried out at four different values of the pressures atm. Thermal equilibrium at a constant temperature K and different pressures was achieved using Berendsen thermostat and barostat respectively. The final equilibrated conformation was then used for as the starting conformation for umbrella sampling at different pressures.
To quantify the relative propensity of binding of RNA at different pressures, we chose the dihedral angle (C1’C1’C1’N1) (see Fig. 1) as the reaction coordinate for calculation of free energy. Since the conformational changes are very slow and an equilibilirium sampling of torsional angles require much larger time scales than computationally feasible, we use biasing potential to calculate the free energy. Umbrella sampling method was used to calculate the relative free energy of bulge base looping out conformations for the RNA shown in Fig. 1. Harmonic umbrella biasing potentials with a force constant were distributed uniformly along the reaction coordinate at an interval . Consecutive sampling windows of were started from equilibrium structure of last run. For each values of the umbrella sampling window, we run a ns simulation and record the value of every ps. The final potential of mean force (PMF) was calculated using the WHAM (weighted histogram method) wham . The unbiased probability distribution at a given temperature under WHAM is given by
| (1) |
where is the number of sampling window (simulations), is the number of counts in the bin associated with , is the biasing potential, and free energy from simulation and is given by
| (2) |
where is the number of bins for the individual sampling window. The equations 1 and 2 are iterated to obtain the self consistent value of . The value of depends on the time scale of simulations and hence long simulations are needed for a good convergence of the free energy.
In Fig. 2, we show typical histograms along the reaction coordinate for biasing potential centered at different values of with . We obtain smooth histograms for all the sampling windows for all the trajectories.

III Kinetics of single A bulge at ambient and elevated pressures
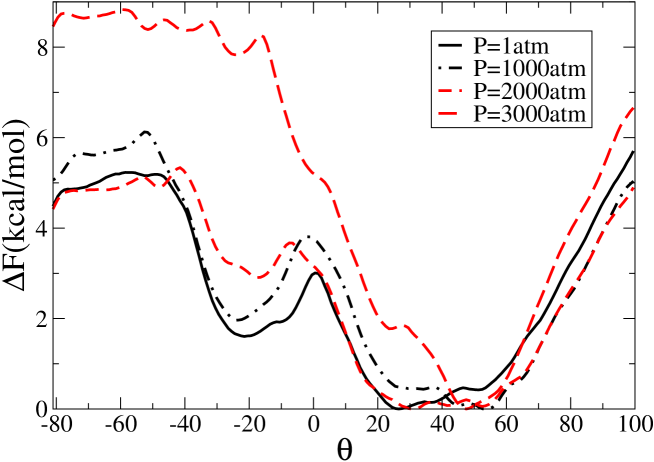
In Fig. 3, we show as a function of for the RNA structure with -bulge at atm. Negative value of corresponds to deviation towards minor groove while the positive values corresponds to deviation towards major groove. We find that has characteristic two minima centered around and as reported in earlier studies of single A bulge Andre06 . Note that the definition of the torsional angle is different from the one used Ref. Andre06 and hence different values of . As we can see from figure 3, the orientation of the A-bulge at more stable minimum is tilted slightly along the major groove while the second minimum at is presumably due to the base triplet formation with the neighboring bases. The free energy difference between these two minima is kcal/mol. suggesting that although is relatively a more stable minimum configuration, the thermal fluctuations at K ( kcal/mol) is sufficient enough for the bulge to get displaced of the free energy minimum configuration. Due to a large free energy barrier ( a complete looped out conformation of single A-bulge is less favorable and hence consistent with experimental fact that a single A does not bind efficiently with the incoming ligands.

Figure 4 shows as a function of for different . We find that for pressures up to atm has the characteristic two minima as we find in the case of atm. However, as the pressure in increased, the minimum at becomes shallower and disappears for atm, suggesting that at atm the base triplet formation of the bulge base with the neighboring bases does not occur during the looping process. Moreover, the free energy barrier between the two minima changes just a little upon increasing pressure for atm. For atm, free energy barrier for the flipped out state changes drastically where kcal/mol, suggesting that the propensity of single A-bulge base looping out from the local helical plane would decrease upon increasing pressure and so the binding propensity of of incoming ligands. Furthermore, we note that although the free energy barrier associated with complete looped out conformations is finite is for all the pressures the final looped out state is not a free energy minimum state hence a RNA structure with single A bulge would not favor ligand binding. To verify this we ran ns long simulations to see if there is any bulge looping out event at different pressures and we do not observe any.
In order to calculate the effective rate of transition from a stacked to looped out conformation, we use Langevin equation KampenBook ; Gardiner . Assuming the diffusion of the reaction coordinate on an underlying free energy surface the dynamics of is governed by
| (3) |
where is the torsional deviation and is the diffusion constant and is the thermal noise with zero mean, and delta function correlation, . In the high friction limit, the probability of finding the system with reaction coordinate after time is given by the Smoluchowsky equation:
| (4) |
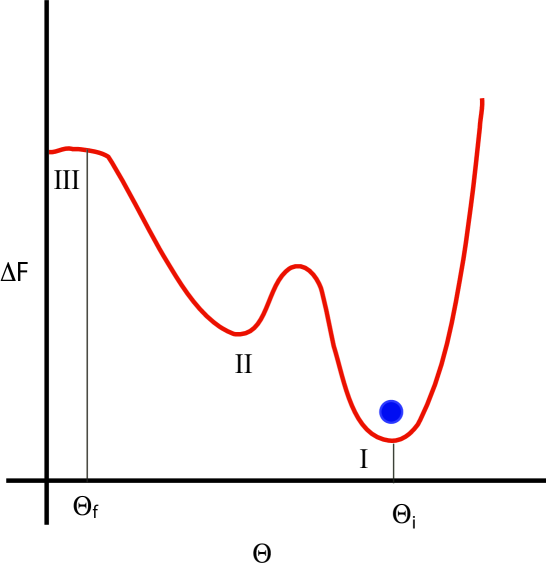
where is the Fokker-Planck operator given by and . The mean first passage time associated with crossing the barrier from any coordinate to final state is given by (see Fig. 5)
| (5) |
where and denote the reflecting and absorbing boundaries respectively. We choose as the final looped out state and initial state is chosen to the values of where the free energy curve has the deepest minimum for respective pressures. The effective rate of transition from to would then be given by . The reflecting boundary was chosen to be at where the relative free energy is . Using Eq. 5, we calculate the value of for different pressures. We list the values of in table 1 where is measured in . We find that increases upon increasing pressure within the error bars and increases sharply for atm.
| Pressure | |
|---|---|
| 1 atm | 2.1625 |
| 1000 atm | 9.8104 |
| 2000 atm | 5.3807 |
| 3000 atm | 1018 |
IV Hydration shell and base flipping of RNA
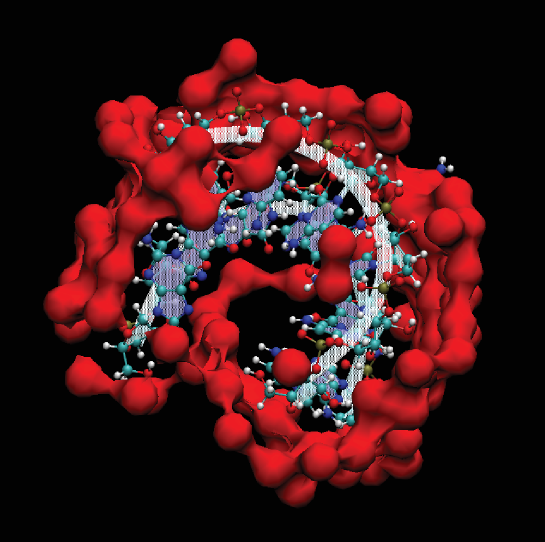
As we have seen the sections above, that the base flipping kinetics changes as the pressure is increased – namely, the free energy barrier for the bulge base to flip out increases with pressure. Moreover, the transient barrier which presumably is due to the base triplet formation of the bulge base with the neighboring bases disappears at pressures kbar. We note that kbar is the pressure where most of the anomalies of liqid water disappears and also the pressure at which hydrophobic barriers for small molecules in water tend to vanish. Motivated by this we looked at the structure of the solvation shell (first hydration shell) of water around RNA for different pressures. We show a typical hydration shell around RNA in Fig. 6. The hydration shell is calculated by finding all the water molecules within a distance of RNA molecule. We choose nm as the first minimum in the radial distribution function of RNA and oxygen of water molecules (not shown here). We find that is independent of the pressure.
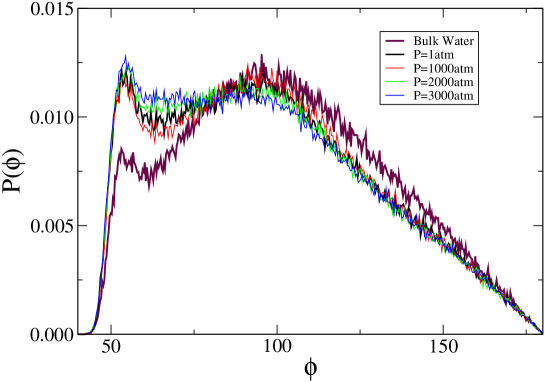
We first looked at whether the observed change in the pressure dependence of the kinetics is a result of ordering of water around RNA. To this effect, we calculated the OOO-bond angle and its distribution of a central water molecule and its nearest neighbors in the hydration shell. If the water orders then , would be very close to the tetrahedral angle . In Fig. 7, we show for pressures atm. For a comparison we also plot for bulk TIP3P water at atmospheric pressures. We find that, the second peak corresponding to more ordered water of the distribution shifts to smaller values of , suggesting that the water monotonically disorders upon increasing pressure. Moreover, we do not find any significant sharp changes in which could be associated with sharp change in the free energy barrier observed at atm.
To quantify the ordering/disordering of water molecules around , we use the tetrahedral order parameter Chou98 ; errington ; kumarPNAS09 . Tetrahedral order parameter quantifies how close a given water molecule and its first shell neighbors form a structure close to a tetrahedron. In general, of molecules is defined as
| (6) |
where, the indices i, and j run over all four neighboring molecules and the OOO-angle formed between the oxygens of central molecule k and neighbors i and j.
Since, we only consider a thin hydration shell, the expression for ensemble average can be written as
| (7) |
In table 2, we list the average tetrahedral order parameter of the hydration shell for different pressures. For a comparison, we also compute for bulk water. Table 2 lists values of for different pressures. We find that, monotonically decreases upon increasing pressure and no sudden change in is seen at atm.
| Average Tetrahedral Order Parameter | ||
|---|---|---|
| Pressure | Bulk Water | Hydration Shell |
| 1 atm | 0.467 | 0.396 |
| 1000atm | 0.375 | |
| 2000 atm | 0.361 | |
| 3000atm | 0.348 | |
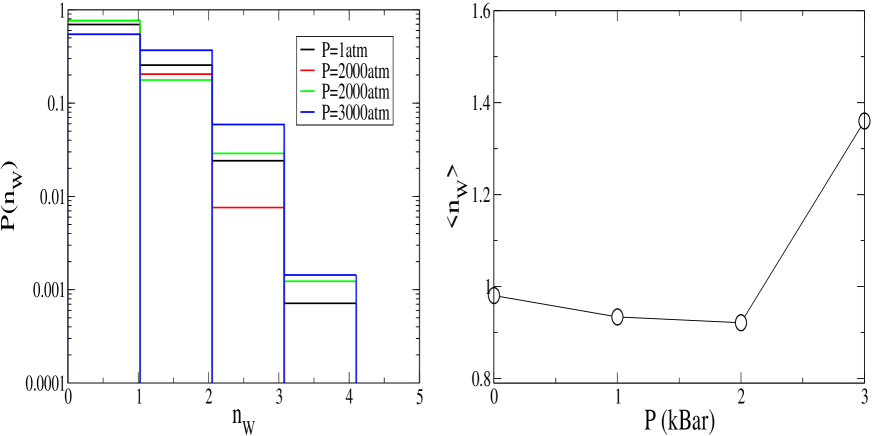
Since, we did not see any sudden change in the ordering of hydration shell around RNA that might lead to the base flipping barrier observed at atm, we next studied the hydration shell of the bulge base and suprisingly, we find that at high pressures, the average number of water molecules in the first hydration shell of the bulge base increases, from an average of about to (see Fig. 8(b)). Moreover, we find that the distribution of water molecules around the bulge base shows significant probability of finding water molecules. To this end, we suggest that the increased barrier of base flipping and the disappearance of the transient barrier in the free energy barrier is due to the presence of increased water molecules in the solvation shell around the bulge base. The presence of more water molecules creates a competition between the base triplet formation and the hydrogen bond formation with the water molecules, which might have penetrated from the major groove, and hence stabilizing the stacking of the bulge base.
V Summary and Discussions
In summary, in this paper we have investigated the effect of pressure on the kinetics of base flipping by calculating the free energy barrier associated with looping out torsional angle of an adenosine bulge base in a short double strand RNA. We find that, upon increasing the pressure, the propensity or likelihood of base flipping decreases. At pressure atm, we see a sharp increase in the free energy barrier. Further, we calculate the time scale of flipping by mapping the problem of base flipping to a diffusion of reaction coordinate on an underlying free energy landscape from which we calculate the time scale of looping out of bulge base. We find that the time scale increases upon increasing pressure and changes dramatically at atm. We associate this behavior with the competing hydrogen bonds between the neighboring bases and increased solvation of the bulge base at high pressures.
Acknowledgements.
Authors would like to thank NSF grant no. PHY-0848815 for support. PK acknowledges support from National Academies Keck Foundation Future Initiatives Award.References
- (1) T. R. Cech, Science 236 1532–1539 (1987).
- (2) J. R. Wyatt, J. D. Puglisi, and I. Tinoco Jr., BioEssays 11, 100 (1989).
- (3) T. Hermann and D. J. Patel, Structure 8, R48 (2000).
- (4) B. Lustig, I. Bahar, and R. L. Jernigan, Nucelic Acids Research 26 5212–5217 (1998).
- (5) D. J. Patel, S. A. Kozlowski, L. A. Marky, J. A. Rice, L. Broka, K. Itakura, K. J. Breslauer, Biochemistry 21 445–451 (1982).
- (6) S. A. Woodson and D. M. Crothers, Biopolymers 30 4042-4047 (1989).
- (7) A. Barthel and M. Zacharias, Biophysical Journal 90, 2450 (2006).
- (8) M. Feig, M. Zacharias, and B. M. Pettitt, Biophysical Journal 81, 352–370 (2001).
- (9) P. Auffinger and Y. Hanshem, Curr. Opin. Struct. Bio. 17, 325 (2007).
- (10) M. Illangasekare, O. Kovalchuke, and M. Yarus, J. Mol. Biol. 274 519 (1997).
- (11) J. Lehmann, A. Reichel, A. Buguin, and A. Libchaber, RNA 13, 1191 (2007).
- (12) C. Tanford, The Hydrophobic Effect: Formation of Micelles and Biological Membranes (Wiley, New York), 2nd Edition (1980).
- (13) K. A. Dill, Biochem 29 7133 (1990).
- (14) K. Lum, D. Chandler, J. Weeks, J Phys Chem B 103 4570 (1999).
- (15) H. S. Ashbaugh, T. M. Truskett, P. G. Debenedetti, J Chem Phys 116 2907 (2002).
- (16) G. Hummer, S. Garde, A. E. Garcia, A. Pohorille, L. R. Pratt, Proc Natl Acad Sci USA 93 8951 (1996).
- (17) B. Widom, P. Bhimalapuram, K. Koga, Phys Chem Chem Phys 5:3085 (2003).
- (18) Sergey V. Buldyrev, Pradeep Kumar, Pablo G. Debenedetti, Peter J. Rossky, and H. Eugene Stanley, Proc. Nat. Acad. Sci. 104 20177 (2007).
- (19) H.J.C. Berendsen, D. van der Spoel and R. van Drunen Comp. Phys. Comm. 91, 43-56 (1995).
- (20) E. Lindahl, B. Hess and D. van der Spoel J. Mol. Mod. 7, 306-317 (2001).
- (21) P. Kumar et. al., J. Comput. Chem. 13, 1011 (1992).
- (22) N. G. Van Kampen Stochastic Processes in Physics and Chemistry, Third Edition, (1981).
- (23) C. Gardiner, Stochastic Methods Springer Publications, (2009).
- (24) P. -L. Chau and A. J. Hardwick, Mol. Phys. 93 511 (1998).
- (25) J. R. Errington and P. G. Debenedetti, Nature 09, 318 (2001).
- (26) P. Kumar, S. V. Buldyrev, and H. E. Stanley, Proc. Nat. Acad. Sci. 106 22130 (2009).