The Globular Cluster/Central Black Hole Connection in Galaxies
Abstract
We explore the relation between the total globular population in a galaxy () and the mass of its central black hole (). Using a sample of 33 galaxies, twice as large as the original sample discussed by Burkert & Tremaine (2010), we find that for elliptical and spiral galaxies increases in almost precisely direct proportion to . The S0-type galaxies by contrast do not follow a clear trend, showing large scatter in at a given . After accounting for observational measurement uncertainty, we find that the mean relation defined by the E and S galaxies must also have an intrinsic or “cosmic” scatter of in either log or log . The residuals from this correlation show no trend with globular cluster specific frequency. We suggest that these two types of galaxy subsystems (central black hole and globular cluster system) may be closely correlated because they both originated at high redshift during the main epoch of hierarchical merging, and both require extremely high-density conditions for formation. Lastly, we note that roughly of the galaxies in our sample (one E, one S, two S0) deviate strongly from the main trend, all in the sense that their is at least smaller than would be predicted by the mean relation.
keywords:
globular clusters, black holes, galaxies1 Introduction
Recently Burkert & Tremaine (2010) (hereafter BT) have presented evidence that the total population of globular clusters in a galaxy is almost exactly proportional to the mass of its central supermassive black hole. In rough terms such a relationship may not, on the surface, be terribly surprising because (as BT discuss) is nearly linearly related to the luminosity or total mass of the host galaxy (e.g. Harris 1991), and scales nearly linearly with the galaxy bulge mass (Wehner & Harris, 2006; Ferrarese et al., 2006). At a more detailed level, however, the behavior of the GC population with galaxy size and type is much more complex (Brodie & Strader, 2006; Peng et al., 2008), and it is not obvious that the -correlation should be as tight and strongly defined as it is – as BT discuss, more so than is warranted by the measurement uncertainties. A potentially more surprising result they find from their sample is that the total mass contained in the globular cluster system is nearly equal to that of the central black hole.
In this paper, we investigate the vs. correlation further and discuss additional implications arising from it.
2 The Database
The BT result was based on just 16 galaxies: 11 ellipticals (E), 3 spirals (S), and 2 lenticulars (S0), and only 13 were used in deriving the numerical relation between total cluster population and central black hole mass. Given that the number of galaxies with either measured or is considerably larger than this, we chose to try and add to the sample. We carried out an independent search of the literature using galaxies included in the the databases of Gultekin et al. (2009b), Graham (2008), and Gebhardt (2004), whose globular cluster systems (GCSs) had also been studied and for which it was possible to make reasonable estimates of . As a result we now have a database of 33 galaxies: 21 E, 4 S, and 8 S0, doubling the BT sample. Many other galaxies have published measurements of either one or the other (more than 70 with and well over 200 for ), but these two types of observational studies have been carried out originally for very different purposes, so it is perhaps not suprising that the overlap between them is as yet quite limited.
In Table 1 we list the results of our compilation. Successive columns give the galaxy name, galaxy type, absolute magnitude, total cluster population and data source, specific frequency (number of clusters per unit galaxy luminosity), black hole mass and source. References for the and values are provided in the footnote. For a few of the galaxies in this list, the original GC study quoted only a value for the number of directly observed GCs and not a total cluster population. For these we reconstructed a total, correcting for spatial and magnitude incompleteness with standard methods described, for example, in Harris & van den Bergh (1981). In those cases we reference both the original GC study and this paper. In some of these cases the resulting value we believe to be accurate to only a factor of two, but these are still quite useful for the purposes of this discussion; and it should be noted that very similar uncertainties also apply to many of the black-hole masses. For a thorough recent review of the current database and analysis issues, see Gultekin et al. (2009b).
| Galaxy | Type | Source | Source | ||||
| NGC221 (M32) | E2 | 1,2 | 3 | ||||
| NGC821 | E4 | 320(45) | 4 | 1.3 | 5 | ||
| NGC1399 | E1 | 6625(1180) | 6,7 | 7.6 | 8,9 | ||
| NGC2778 | E2 | 50(30) | 1,10 | 0.7 | 5 | ||
| NGC3377 | E5 | 266(66) | 11 | 2.4 | 5 | ||
| NGC3379 (M105) | E1 | 270(68) | 12 | 1.2 | 13 | ||
| NGC4261 | E2 | 530(100) | 1,14 | 0.4 | 15 | ||
| NGC4374 (M84) | E1 | 4300(1200) | 16 | 5.2 | 17 | ||
| NGC4472 (M49) | E2 | 7800(850) | 16 | 4.9 | 18 | ||
| NGC4473 | E5 | 376(97) | 16 | 2.0 | 5 | ||
| NGC4486 (M87) | E1 | 13300(2000) | 16,19 | 11.1 | 20 | ||
| NGC4486A | E2 | 11(11) | 16 | 0.4 | 21 | ||
| NGC4486B | E0 | 4(11) | 16 | 0.4 | 22 | ||
| NGC4552 (M89) | E0 | 1200(250) | 16,19 | 3.3 | 23 | ||
| NGC4564 | E6 | 213(31) | 16 | 2.1 | 5 | ||
| NGC4621 (M59) | E5 | 800(355) | 16 | 2.4 | 23 | ||
| NGC4649 (M60) | E2 | 4745(1100) | 16 | 5.2 | 5 | ||
| NGC4697 | E6 | 229(50) | 24 | 0.9 | 5 | ||
| NGC5128 | Ep | 1300(300) | 25 | 1.9 | 26 | ||
| NGC5813 | E2 | 1650(400) | 27 | 2.4 | 23 | ||
| NGC5846 | E0 | 4700(1200) | 28 | 4.3 | 23 | ||
| NGC1023 | SB0 | 221(100) | 29 | 0.7 | 30 | ||
| NGC1316 | S0 | 647(100) | 31 | 0.5 | 32 | ||
| NGC3115 | S0 | 550(150) | 33 | 2.0 | 34,35 | ||
| NGC3585 | S0 | 300(100) | 1,36 | 0.6 | 37 | ||
| NGC4350 | S0 | 196(60) | 16 | 1.8 | 38 | ||
| NGC4382 | S0 | 1100(181) | 16 | 1.3 | 39 | ||
| NGC4459 | S0 | 218(28) | 16 | 1.7 | 40 | ||
| NGC7457 | S0 | 178(75) | 41 | 2.6 | 5 | ||
| Milky Way | Sbc | 160(20) | 42 | 0.9 | 43,44 | ||
| NGC224 (M31) | Sb | 450(100) | 45 | 0.9 | 46 | ||
| NGC3031 (M81) | Sb | 172(100) | 47 | 0.4 | 48 | ||
| NGC4594 (M104) | Sa | 1900(300) | 4 | 2.1 | 49 |
Sources: (1) This paper, (2) Lee et al. (2008), (3) Verolme et al. (2002), (4) Spitler et al. (2008), (5) Gebhardt et al. (2003), (6) Bassino et al. (2006), (7) Dirsch et al. (2003), (8) Gebhardt et al. (2007), (9) Houghton et al. (2006), (10) Gebhardt Kissler-Patig (1999), (11) Kundu & Whitmore (2001), (12) Harris & van den Bergh (1981), (13) Gebhardt et al. (2000), (14) Giordano et al. (2005), (15) Ferrarese et al. (1996), (16) Peng et al. (2008), (17) Bower et al. (1998), (18) Shen & Gebhardt (2010), (19) Tamura et al. (2006), (20) Macchato et al. (1997), (21) Nowak et al. (2007), (22) Gultekin et al. (2009b), (23) Graham (2008), (24) Jordán, A. et al. (2005), (25) Harris, G.L.H. (2010), (26) Cappellari et al. (2009), (27) Hopp et al. (1995), (28) Forbes et al. (1997), (29) Larsen & Brodie (2000), (30) Bower et al. (2001) (31) Villegas et al. (2010), (32) Nowak et al. (2008), (33) Hanes & Harris (1996), (34) Emsellem et al. (1999), (35) Tremaine et al. (2002), (36) Puzia et al. (2004), (37) Gultekin et al. (2009a), (38) Pignatelli et al. (2001), (39) Gultekin et al. (2010) (40) Sarzi et al. (2001), (41) Chomiuk et al. (2008), (42) Harris, W. E. (2010), (43) Ghez et al. (2008), (44) Gillessen et al. (2009), (45) Battistini et al. (1993), (46) Bender et al. (2005), (47) Santiago-Cortés et al. (2010), (48) Devereux et al. (2003), (49) Kormendy (1988)
The key plot of log vs. log for all galaxies in Table 1 is shown in Figure 1. If the two quantities are exactly proportional then the mean relation in this log-log graph will have unit slope, and the data do follow a trend very close to that. Thus the first conclusion to be drawn from this larger dataset is that we verify the essential result of BT, now extending over a factor of in both quantities. The main spine of the proportionality is defined primarily by the E galaxies which make up more than half the sample.
Though a trend clearly exists, it is also true that some galaxies lie well off the range of scatter defined by the majority. Particularly disparate are the points for NGC 5128, the Milky Way (MW), and the S0s NGC 4382 and NGC 7457. All have black hole masses which are at least an order of magnitude too small for their cluster populations when compared to the main trend. For the MW, both and are very well known, and we cannot arbitrarily choose to treat the cluster population in any different way from the other galaxies in the list (for example by counting only the “bulge” GCs as BT suggest). In fact, given that clusters in the central bulge are generally more difficult to detect in external galaxies, a more reasonable ‘correction’ to the MW sample would be to eliminate some fraction of the bulge clusters. But since these make up of the total population at most, any such correction would still leave the MW as an outlier in Figure 1.
For NGC 5128, the cluster population estimates have consistently been in the range of 1000-2000 and the most recent determination of 1300 (Harris, G.L.H., 2010) is now more soundly based than the GC totals for many of the other systems in Table 1. To force this galaxy back to the mean line, either would need to be smaller by a factor of at least 3 (an impossibility since more than 600 normal GCs have been individually found and confirmed; see Woodley et al. (2010b)); or the BH mass would have to be far larger (also now unlikely, as mentioned above). The dust lane has made determination of rather challenging, but it does seem that the mass used here is one of high confidence (Cappellari et al., 2009). Lastly, in the cases of NGC 4382 and NGC 7457 the BH masses are solid upper limits (Gebhardt, 2010) and their clusters would essentially all have to disappear to make these galaxies fall anywhere near the main line.
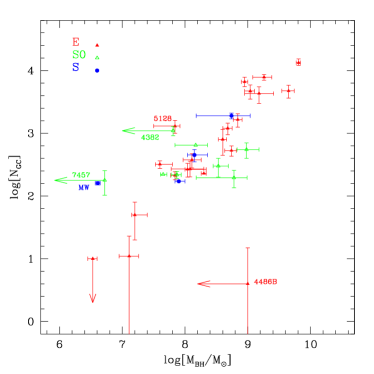
Two other objects worth special comment are the compact ellipticals M32 and NGC 4486B which have vanishingly small GC populations. Both are satellites of much larger systems (M31 and M87 respectively) and it has often been suggested that the GCs they might initially have had were removed by tidal stripping (for the outlying ones) or dynamical friction (for the ones in the core). For M32, we decided to make a fresh estimate of the number of clusters it might have by searching in the M31 cluster catalog of Lee et al. (2008). There are 9 clusters within a projected distance of 3 kpc of M32 and within km/s of its radial velocity. From the same database, to within the count statistics we find the same number of number of M31 clusters per unit area, within that velocity range and at the mean radial distance of M32; therefore we conclude that M32 has no statistically significant GC ‘signal’. We adopt a conservative upper limit . For NGC 4486B, the GC population as measured in the comprehensive deep Virgo Cluster Survey (Peng et al., 2008) is indistinguishable from zero, and the BH mass measurement is also only an upper limit, so it is not clear whether or not this galaxy falls off the mean relation. In any case, we do not use these two small ellipticals in the following analysis.
3 Analysis
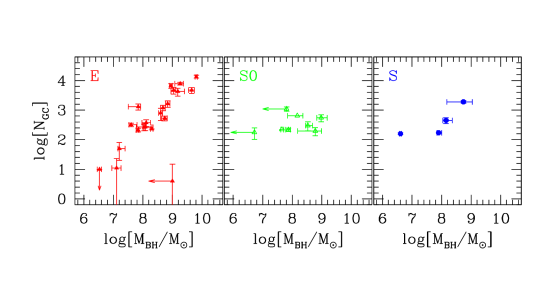
Given that the BT results were based on a sample dominated by E galaxies, which make up more than half of our list, we decided to look at the data sorted by subtype before trying to find numerical correlations. In Figure 2 we plot log vs. log as before, but with E, S, and S0 galaxies in different panels. A brief glance is enough to see that the distributions show certain differences for the three galaxy types:
-
•
The E galaxies span a range of three orders of magnitude in both and , larger than for the S0 or S types, and they show a strong correlation between log and log over that range, even in the low - part of the graph where there are only a few galaxies.
-
•
The four S galaxies cover a factor of only 10 in and 100 in . But, with the notable exception of the MW, the spirals appear to follow a trend similar to the ellipticals.
-
•
The S0 galaxies are quite different, occupying a similar range to the spirals, but a much larger one in central black hole mass. No clear trend is present. Arbitrarily increasing the central black hole mass for the two S0s with log7 would place them closer to the main group but as already discussed above, the quoted values of are upper limits for both (Gebhardt, 2010). That S0s have rather small cluster populations (that is, low specific frequencies) relative to ellipticals has long been known and can be illustrated well by examining the homogeneous ACS Virgo Cluster Survey lists of Peng et al. (2008). Their sample contains 31 galaxies identified as S0: more than half have 100 and all but two are likely to have 400 clusters.
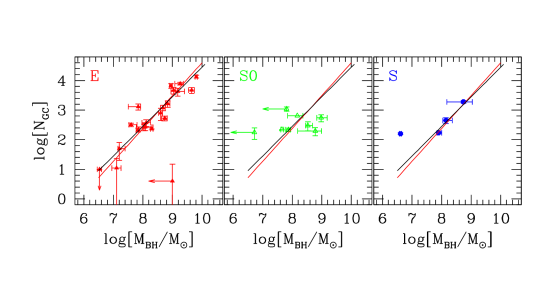
Because the E galaxies as a subclass define by far the most well determined correlation, we use them to define the baseline relation. We solved for a best-fit relation using the estimator described by Tremaine et al. (2002) which accounts for the observational measurement uncertainties in both quantities for each galaxy individually. The 18 ellipticals (excluding only M32, NGC 4486B, and NGC 5128) yield a solution
| (1) |
or, equivalently,
| (2) |
Including NGC 5128 does not change the best-fit relation significantly though it does increase the .
In short, from this larger database we find (as did BT) that the mass of the central black hole scales nearly linearly with the globular cluster population in the galaxy. If we force the slope in Equation (1) to be exactly 1.00, then the best-fit relation would become
| (3) |
or, expressed as a rule of thumb, about 250 globular clusters per black hole.
Figure 3 shows both the best-fit relation of Equation (1) and the unit-slope relation, superimposed on the separate plots for the three types of host galaxies. Plotting both of these llustrates that we have no compelling reasons to reject an exact 1:1 relation. It should be possible to improve the fit with the addition of more galaxies, particularly those with log .
The residual scatter about the mean (as indicated by the raw ) is noticeably larger than the random measurement errors would nominally permit. We have no particular reason to assume that the various carefully done studies in the literature have systematically underestimated the measurement uncertainties in either quantity, so we suggest that a real cosmic dispersion is also present. To bring the formal per degree of freedom down to 1.0 at the best-fit point, we find that we need to introduce an additional intrinsic scatter of in either log or log , or in linear terms a factor of .
For a normal Gaussian-type globular cluster luminosity function such as in the Milky Way, with a mean at and dispersion (e.g. Brodie & Strader 2006), the average cluster luminosity is . With a mean (e.g. McLaughlin & van der Marel (2005)) the mean GC mass is then , and the E-galaxy correlation becomes very roughly . To well within a factor of two the total masses in these substructures are the same.
The spiral galaxies, with the exception of the MW as discussed above, fall extremely close to the E galaxy line. In fact, adding the three ‘good’ spirals to the E-galaxy list and recalculating the solution leads to no difference from the relation given in Equation (1). The S0s are a different matter however; while a few fall nicely on or near the relationship, there are an equal number for which the - relation appears to be irrelevant.
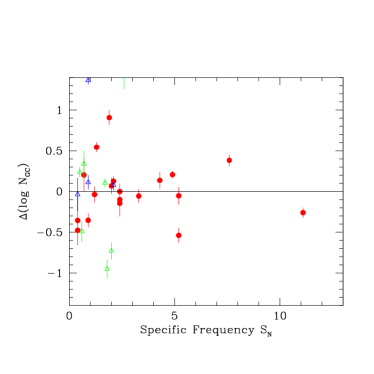
It has long been known (beginning with Harris & van den Bergh (1981)) that the GC specific frequency , i.e. the number of clusters per unit galaxy luminosity, varies with both galaxy type and environment (see also Brodie & Strader (2006); Peng et al. (2008)). Since the galaxies in the list of Table I have a large range in , we thought it would be worthwhile to ask whether any extra residual correlation of with might be present. For example, consider two elliptical galaxies with the same total but different luminosities. By definition, the higher luminosity one must then have a lower . But, we might also expect the higher-luminosity galaxy to have a higher mass if the central black hole mass is driven primarily by the host galaxy’s mass. If this argument were valid, we should then see the opposite effect - i.e. an anticorrelation of with . In Figure 4 we show the residuals in from the mean relation of Equation (1) plotted as a function of . Interestingly no trend is apparent, or at the very least, any such trend is obscured by the measurement scatter in and the small number of points at high . Of the two largest galaxies, one (M87) has a nearly “normal” and the other (NGC 1399) has a slightly lower than “normal” . In short, from the present data we see no extra correlation of central black hole mass with specific frequency.
The most sparsely populated area of the correlation is at low mass. For much less than , the presence of nuclear star clusters (NCs) may also become relevant (Graham & Spitler, 2009). Both BH and NC are part of the more general class of Central Massive Objects (CMO; see Wehner & Harris, 2006; Ferrarese et al., 2006) and, as Graham & Spitler (2009) show, for some galaxies both are present at once. For intermediate-mass galaxies there is a gradual mass transition zone such that for the NC mass tends to become dominant. Inspecting Table 1 of Graham & Spitler, we note that for the MW and NGC 7457 particularly, adding the NC mass to would bring them much closer to the mean E/S relation. For several other galaxies, however (NGC 1023, 1399, 3115, 4697), no important change would result. Additional data may help clarify whether or not the NC mass is an essential part of the picture.
As said earlier, the basic fact that the GC populations and central black hole mass should be correlated is not surprising, because in rough terms bigger galaxies should have bigger subsystems of all types. What is more intriguing is that for the E and S galaxies especially, the correlation is so tight and so nearly linear. BT suggest that mergers may be responsible for the growth of both these subcomponents of the galaxy. However, in a more general sense mergers will promote the growth of all subcomponents of the galaxy. We speculate that a more relevant link between black holes and globular clusters may be their age. Both the central BH and the majority of the GCs had their origins at high and nearly similar redshift, during the major stages of hierarchical merging. Most GCs have ages in the range Gyr, corresponding to redshifts (Marin-Franch et al., 2009; Puzia et al., 2005; Woodley et al., 2010a; Muratov & Gnedin, 2010). For large galaxies the seeds of the central black holes are in place before and grow by further gas accretion till and later (e.g. Alexander et al., 2005; Haiman et al., 2007; Volonteri et al., 2003; Tanaka & Haiman, 2009; Volonteri & Rees, 2005; Willott et al., 2010; Heckman et al., 2004; Silverman et al., 2008; Merloni et al., 2010; Kelly et al., 2010, among many others). Both types of structures clearly require formation conditions of extremely high gas density (/pc3 within small, parsec-sized volumes), which would have been easiest to generate in large numbers at very early times when gas cloud collisions and hierarchical merging events were frequent and energetic (cf. the discussions by Peng et al., 2008; Rhode et al., 2005). In this scenario, and should be closely correlated simply because they are both byproducts of similar extreme conditions at high-density locations during the main period of galaxy formation.
A less certain issue would be whether or not there is a direct causal link between them. For example, the early energy output from the dense, violent star formation conditions in the central regions of a large galaxy that might have accompanied the buildup of the massive BH might also have helped stimulate the formation of dense, massive star clusters throughout the bulge and halo regions (e.g. Harris et al., 1998; Taniguchi et al., 1999; Krause, 2002; Springel et al., 2005; Kauffmann et al., 2007).
The rough equality of total mass in the two subsystems as shown above may, however, be largely a coincidence. The reason is that it applies only to the present stage of evolution of both subsystems. The total mass in the globular cluster system has been continually decreasing since their formation epoch: during the first several years of a young massive star cluster’s life, it sheds a high fraction of its initial protocluster gas due to SNe and stellar winds, and the highest-mass stars evolve and disappear. Over the subsequent Hubble time, tidal stripping and evaporation remove most low-mass clusters, and the higher-mass ones are significantly eroded (see Vesperini, 2010, for a review). These factors combined mean that the initial mass in the GC system should have been many times larger than it is now. By contrast, the BH mass has been continually growing over the same time through gas accretion and stellar capture, though its most rapid growth stage would have been at early times (cf. the references cited above). In other words, in their early stages the total mass in the GC population must have been much larger than the initial BH mass (an order of magnitude or more). It is only now, after a Hubble time’s worth of evolution in opposite senses, that their total masses are nearly crossing.
The case of the S0 galaxies is extremely puzzling. There seems to be no obvious way in which the data for these systems is more uncertain than for the E and S galaxies, leaving us in the position of questioning the sample and/or classification. As already discussed, the two most discordant S0s have black hole masses which are upper limits and there appears to be no obvious way in which they can be moved to more closely agree with the majority of the galaxies in our sample. Interestingly, they deviate from the norm in the same sense as the MW and NGC 5128 (discussed above). The four galaxies which are the most discordant then (1 E, 1, S and 2 S0 - roughly of our sample) all deviate in the sense that their values are too small compared with ; and without the two discordant S0s, the S0 sample overall becomes less peculiar. However, all four ”discordant” galaxies have normal specific frequencies for their galaxy type - i.e. is normal when compared to the luminosity/mass of the whole galaxy. This suggests to us that the formation of GCs is more strongly correlated with overall galaxy properties, and that in some cases is a later or less rapid development.
4 Conclusions
-
1.
We have investigated the correlation between central black hole mass in a galaxy and the total globular cluster population suggested by Burkert & Tremaine (2010). By doubling the sample of galaxies and reconstructing the numbers for and from the primary literature, we find results that confirm the basic trend they presented.
-
2.
Over three orders of magnitude, the elliptical and spiral galaxies in the sample define a relation whereby , a nearly linear proportionality. By contrast, the S0 galaxies in the sample do not follow the same trend, showing much larger scatter in .
-
3.
Of 33 galaxies in the current sample, three or four (i.e. ) fall far enough from the mean relation to be considered genuinely anomalous. The Milky Way is one of these, with a central BH mass far too small for its cluster population.
-
4.
We suggest that the source of this correlation is connected with the epoch of origin of these structures. Both the central BH and the bulk of the GC population had their origins at high redshift (), both requiring extremely high gas density conditions of and above.
On observational grounds there is much room for improvement to explore this intriguing correlation further with bigger samples. Galaxies with already-known BH masses can be imaged with deep wide-field photometry to determine their cluster populations, while the cores of many nearby galaxies with well determined values can be investigated to determine new BH masses. Some dozens of new datapoints can be added to the current list. Larger samples should also allow exploration of wider ranges of galaxy environment and host galaxy type, and perhaps allow us to uncover more direct causal links between these old substructures.
Acknowledgments
We thank Nadine Neumayer, Karl Gebhardt, and Andreas Burkert for helpful discussions. The majority of this work was undertaken during a visit to ESO in Garching, sponsored by the ESO visitor programme. WEH also acknowledges financial support through a grant from the Natural Sciences and Engineering Research Council of Canada.
References
- Alexander et al. (2005) Alexander, D. M., Smail, I., Bauer, F. E., Chapman, S. C., Blain, A. W., Brandt, W. N., & Ivison, R. J. 2006, Nature, 434, 738
- Bassino et al. (2006) Bassino, L.P., Faifer, F. R., Forte, J. C., Dirsch, B., Richtler, T., Geisler, D., & Schuberth, Y. 2006, AA, 451, 798
- Battistini et al. (1993) Battistini, P., Bonoli, F., Casavecchia, M., Ciotti, L., Federici, L., & Fusi-Pecci, F. 1993, AA, 272, 77
- Bender et al. (2005) Bender, R. et al. 2005, ApJ, 631, 280
- Bower et al. (1998) Bower, G. A. et al. 1998, ApJ, 492, L111
- Bower et al. (2001) Bower, G. A. et al. 2001, ApJ, 550, 75
- Brodie & Strader (2006) Brodie, J. P., & Strader, J. 2006, ARAA, 44, 193
- Burkert & Tremaine (2010) Burkert, A. & Tremaine, S. 2010, arXiv:1004.0137 (BT)
- Cappellari et al. (2009) Cappellari, M., Neumayer, N., Reunanen, J., van der Werf, P. P., de Zeeuw, P. T. & Rix, H.-W., 2009, MNRAS, 394, 660
- Chomiuk et al. (2008) Chomiuk, S., Strader, J., & Brodie, J. P. 2008, AJ, 136, 234
- Devereux et al. (2003) Devereux, N., Ford, H., Tsvetanov, Z., & Jacoby, G. 2003, AJ, 125, 1226
- Dirsch et al. (2003) Dirsch, B., Richtler, T., Geisler, D., Forte, J. C., Bassino, L. P., & Gieren, W. P. 2003, AJ, 125, 1908
- Emsellem et al. (1999) Emsellem, E. 1999, MNRAS, 303, 495
- Ferrarese et al. (1996) Ferrarese, L., Ford, H. C., & Jaffe, W. 1996, ApJ, 470, 444
- Ferrarese et al. (2006) Ferrarese, L. et al. 2006, ApJ, 644, L21
- Forbes et al. (1997) Forbes, D. A., Brodie, J. P., & Huchra, J. 1997, AJ, 113, 887
- Gebhardt Kissler-Patig (1999) Gebhardt, K. Kissler-Patig, M. 1999, ApJ, 583, 92
- Gebhardt et al. (2000) Gebhardt, K. et al. 2000, AJ, 119, 1157
- Gebhardt et al. (2003) Gebhardt, K. et al. 2003, ApJ, 583, 92
-
Gebhardt (2004)
Gebhardt, K. 2004, Web-based catalog
(hoku.as.utexas.edu/g̃ebhardt/blackhole.html). - Gebhardt et al. (2007) Gebhardt, K. et al. 2007, ApJ, 671, 1321
- Gebhardt (2010) Gebhardt, K. 2010, private communication
- Ghez et al. (2008) Ghez, A. M. et al. 2008, ApJ, 689, 1044
- Gillessen et al. (2009) Gillessen, S., Eisenhauer, F,; Trippe, S., Alexander, T., Genzel, R., Martins, F., & Ott, T. 2009, ApJ, 692, 1075
- Giordano et al. (2005) Giordano, L., Cortese, L., Trinchieri, G., Wolter, A., Colpi, M., Gavazzi, G., & Mayer, L. 2005, ApJ, 634, 272
- Graham (2008) Graham, A. W., 2008, PASA, 25, 167
- Graham & Spitler (2009) Graham, A. W., & Spitler, L. R. 2009, MNRAS, 397, 2148
- Gultekin et al. (2009a) Gultekin, K. et al., 2009a, ApJ, 695, 1577
- Gultekin et al. (2009b) Gultekin, K. et al., 2009b, ApJ, 698, 198
- Gultekin et al. (2010) Gultekin, K. et al., 2010, AJ, submitted
- Haiman et al. (2007) Haiman, Z., Jimenez, R., & Bernardi, M. 2007, ApJ, 658, 721
- Hanes & Harris (1996) Hanes, D. A. & Harris, W. E. 1996, ApJ, 304, 599
- Harris, G.L.H. (2010) Harris, G. L. H. 2010, PASA in press (arXiv:1004.4907)
- Harris, W. E. (1999) Harris, W.E. 1991, ARAA, 29, 543
- Harris, W. E. (2010) Harris, W.E. 2010, in preparation
- Harris & van den Bergh (1981) Harris, W. E., & van den Bergh, S. 1981, AJ, 86, 1627
- Harris et al. (1998) Harris, W. E., Harris, G. L. H., & McLaughlin, D. E. 1998, AJ, 115, 1801
- Heckman et al. (2004) Heckman, T. M., Kauffmann, G., Brinchmann, J., Charlot, S., Tremonti, C., & White, Simon D. M. 2004, ApJ, 613, 109
- Hopp et al. (1995) Hopp, U. et al 1995, AA 296, 633
- Houghton et al. (2006) Houghton, R. C. W. et al. 2006, MNRAS, 367, 2
- Jordán, A. et al. (2005) Jordán, A. et al. 2005, ApJ, 634, 1002
- Kauffmann et al. (2007) Kauffmann, G. et al. 2007, ApJS, 173, 357
- Kelly et al. (2010) Kelly, B. C., Vestergaard, M., Fan, X., Hopkins, P., Hernquist, L., & Siemiginowska, A. 2010, ApJ, 719, 1315
- Kormendy (1988) Kormendy, J. 1988, ApJ, 335, 40
- Krause (2002) Krause, M. 2002, A&A, 386, L1
- Kundu & Whitmore (2001) Kundu, A. & Whitmore, B. C. 2001, AJ, 121, 2950
- Larsen & Brodie (2000) Larsen, S.S. & Brodie, J. P. 2000, AJ, 120, 2398
- Lee et al. (2008) Lee, M. G., Hwang, H. S., Kim, S. C., Park, H. S., Geisler, D., Sarajedini, A., & Harris, W. E. 2008, ApJ, 674, 886
- Macchato et al. (1997) Macchetto, F. et al. 1997, ApJ, 489, 579
- Marin-Franch et al. (2009) Marin-Franch, A. et al. 2009, ApJ, 694, 1498
- McLaughlin & van der Marel (2005) McLaughlin, D. E., & van der Marel, R. P. 2005, ApJS, 161, 304
- Merloni et al. (2010) Merloni, A. et al. 2010, ApJ, 708, 137
- Muratov & Gnedin (2010) Muratov, A. L., & Gnedin, O. Y. 2010, ApJ, 718, 1266
- Nowak et al. (2007) Nowak, N., Saglia, R. P., Thomas, J., Bender, R., Panella, M., Gebhardt, K., & Davies, R. I., 2007, MNRAS, 379, 909
- Nowak et al. (2008) Nowak, N., Saglia, R. P., Thomas, J., Bender, R., Davies, R. I., & Gebhardt, K. 2008, MNRAS, 391, 1629
- Pignatelli et al. (2001) Pignatelli, E., Salucci, P., & Danese, L. 2001, MNRAS, 320, 124
- Peng et al. (2008) Peng, E. W. et al. 2008, ApJ, 681, 197
- Puzia et al. (2004) Puzia, T. H. et al. 2004, A&A, 415, 123
- Puzia et al. (2005) Puzia, T. H., Kissler-Patig, M., Thomas, D., Maraston, C., Saglia, R. P., Bender, R., Goudfrooij, P., & Hempel, M. 2005, A&A, 439, 997
- Rhode et al. (2005) Rhode, K., Zepf, S. E., & Santos, M. R. 2005, ApJ, 630, L21
- Santiago-Cortés et al. (2010) Santiago-Cortés, M., Mayya, Y. D., & Rosa-González, D. 2010, MNRAS, 405, 1293
- Sarzi et al. (2001) Sarzi, M., Rix, H.-W., Shields, J. C., Rudnick, G., Ho, L. C., McIntosh, D. H., Filippenko, A. V., & Sargent, W. L. W. 2001, ApJ, 550, 65
- Shen & Gebhardt (2010) Shen, J. & Gebhardt, K. 2010, ApJ, 711, 484
- Silverman et al. (2008) Silverman, J. D. et al. 2008, ApJ, 679, 118
- Spitler et al. (2008) Spitler, L. R., Forbes, D. A., Strader, J., Brodie, J. P., & Gallagher, J. S. 2008, MNRAS, 385, 361
- Springel et al. (2005) Springel, V., Di Matteo, T., & Hernquist, L. 2005, ApJ, 620, L79
- Tamura et al. (2006) Tamura, N., Sharples, R. M., Arimoto, N., Onodera, M., Ohta, K., & Yamada, Y. 2006, MNRAS, 373, 588
- Tanaka & Haiman (2009) Tanaka, T., & Haiman, Z. 2009, ApJ, 696, 179
- Taniguchi et al. (1999) Taniguchi, Y., Trentham, N., & Ikeuchi, S. 1999, ApJ, 526, L13
- Tremaine et al. (2002) Tremaine, S. et al. 2002, ApJ, 574, 740
- Vesperini (2010) Vesperini, E. 2010, Phil.Trans.Roy.Soc., 368, 829
- Villegas et al. (2010) Villegas, D. et al. 2010, ApJ, 717, 603
- Verolme et al. (2002) Verolme, E. K. et al. 2002, MNRAS, 335, 517
- Volonteri et al. (2003) Volonteri, M., Haardt, F., & Madau, P. 2003, ApJ, 582, 559
- Volonteri & Rees (2005) Volonteri, M., & Rees, M. J. 2005, ApJ, 633, 624
- Wehner & Harris (2006) Wehner, E.H., & Harris, W.E. 2006, ApJ, 644, L17
- Willott et al. (2010) Willott, C. J. et al. 2010, AJ, 140, 546
- Woodley et al. (2010a) Woodley, K. A., Harris, W. E., Puzia, T. H., Gómez, M., Harris, G. L. H., & Geisler, D. 2010a, ApJ, 708, 1335
- Woodley et al. (2010b) Woodley, K. A., Gómez, M., Harris, W. E., Geisler, D., & Harris, G. L. H. 2010b, AJ, 139, 1871