Temporal variability of active region outflows
Abstract
Recent observations from the Extreme-ultraviolet Imaging Spectrometer (EIS) on board Hinode have shown that low density areas on the periphery of active regions are characterized by strong blue-shifts at 1 MK. These Doppler shifts have been associated with outward propagating disturbances observed with Extreme-ultraviolet and soft X-ray imagers. Since these instruments can have broad temperature responses we investigate these intensity fluctuations using the monochromatic imaging capabilities of EIS and confirm their 1 MK nature. We also find that the Fe XII 195.119 Å blue shifted spectral profiles at their footpoints exhibit transient blue wing enhancements on timescales as short as the 5 minute cadence. We have also looked at the fan peripheral loops observed at 0.6 MK in Si VII 275.368 Å in those regions and find no sign of the recurrent outward propagating disturbances with velocities of 40 – 130 seen in Fe XII. We do observe downward trends (15 – 20 ) consistent with the characteristic red-shifts measured at their footpoints. We, therefore, find no evidence that the structures at these two temperatures and the intensity fluctuations they exhibit are related to one another.
Subject headings:
Sun: corona, Sun: transition region, Sun: atmosphere1. Introduction
At the periphery of solar active regions, rooted in strong flux concentrations, there are cool loops with temperatures of 1 MK (Schrijver et al., 1999) and under, with footpoints that often adopt fan-like geometries; the so-called “fan loops”. High cadence EUV movies of these loops reveal upward propagating motions with projected velocities of 50 – 150 (Berghmans & Clette, 1999; Schrijver et al., 1999; Sakao et al., 2007; McIntosh & De Pontieu, 2009) that have been interpreted as flows, but also waves (De Moortel et al., 2002a, b; Wang et al., 2009). Spectroscopic analyses show that these loops have temperatures of 0.6 – 1 MK and densities comparable to those of the core loops, and emit particularly strongly in Mg VI, Mg VII, Si VII and Fe VIII lines (Del Zanna, 2003; Del Zanna & Mason, 2003; Young et al., 2007), which have an ionization equilibrium temperature K. Perhaps in contradiction to the upward propagating disturbances, the emission of these lines is consistently red-shifted (Winebarger et al., 2002; Marsch et al., 2004; Del Zanna, 2008; Warren et al., 2010a). This is also consistent with the downflowing plasma that has been observed off-limb in high cadence monochromatic imaging (e.g. Ugarte-Urra et al., 2009). The fans can live for hours and days (Schrijver et al., 1999), but the individual structures evolve on timescales of the order of tens of minutes.
Also at the periphery, there are low density areas at 1 – 2 MK, that are hardly noticeable in emission when compared to the core loops. In fact, only recent spectral measurements from the Extreme-ultraviolet Imaging Spectrometer (EIS) on board Hinode have revealed that these areas are very distinct in Doppler maps for their characteristic strong blue-shifts and enhanced broadening of Fe XII – Fe XV lines (Doschek et al., 2008; Harra et al., 2008; Del Zanna, 2008). The shifts in the spectral line profiles are up to 50 , but asymmetries in the blue wings expose contributions from plasma at 100 – 200 (McIntosh & De Pontieu, 2009; Bryans et al., 2010), indicative of outflows that often persist for many days. These regions lie over or near magnetic flux concentrations of a single polarity (Doschek et al., 2008).
McIntosh & De Pontieu (2009) have argued that these persistent blue-shifts in the outskirts of active regions are the spectral signature of the disturbances observed by EUV imagers in the 1 MK loops and suggest that the upflows are related to spicule activity.
In this paper, we find short timescale variability in the blue wing enhancements in the Fe XII 195.119 Å line, supportive of the transient nature of the disturbances precursors. We do not, however, find any obvious relationship between the temporal response of the low density plasma at 1 MK and the evolution of the high density 0.6 MK loops. We do observe disturbances propagating out in the Fe XII 195.119 Å monochromatic imaging, which is qualitatively consistent with the blue-shifts, but no outward disturbances are detected in the Si VII 275.368 Å line. Time sequences in this line show downward propagating trends that are consistent with the red-shifted emission of the line.
2. Observations
We present results from two active region data sets obtained with the Extreme-ultraviolet Imaging Spectrometer (Culhane et al., 2007) on board Hinode (Kosugi et al., 2007). The EIS instrument is a high spatial (1″ or 2″ per pixel) and spectral (22 mÅ) resolution imaging spectrograph. It observes coronal and transition region spectral lines in two wavelength ranges: 170 – 210 Å and 245 – 290 Å. Users can opt between narrow slit spectroscopy (1″ and 2″ slits) or wide slit imaging (40″ and 266″ slits).
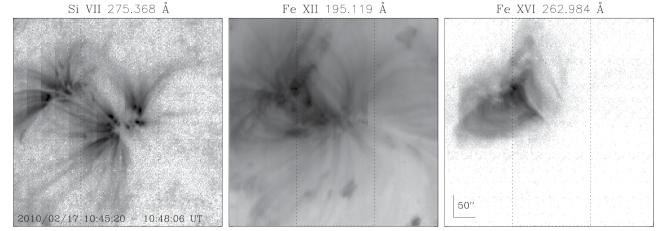
EIS observed Active Region (AR) 11048 on 2010 February 17. The observing sequence (10:45 – 15:27 UT) consisted of images made out of fifteen consecutive 10 s exposures at adjacent solar positions, resulting in a 3 minute cadence. Despite the fact that the full spectral range is exposed on the detector, only a limited number of spectral windows is retrieved. We will discuss here in more detail images from two spectral lines: Si VII 275.368 Å and Fe XII Å 195.119 Å. The spectral purity of these images is 0.9 Å. The imaging sequence was preceded and followed by two narrow slit (1″) rasters. The rasters are sparsely sampled: the slit takes 3″ steps between every exposure (50 s), which allows a faster scanning of the target. The rasters serve as a spectral diagnostics reference, in particular for the line-of-sight velocity. Top panels in Fig. 1 show slot images of the active region for the two lines of interest, plus Fe XVI 262.98 Å. The dotted line encloses the field-of-view of the rasters. They are located over the low density Fe XII regions at the periphery of the active region. Notice that in Si VII that region shows also bright high density loops. Some of the spectral properties of this AR were also discussed by Warren et al. (2010a).
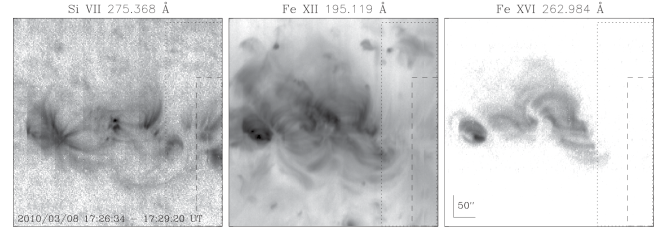
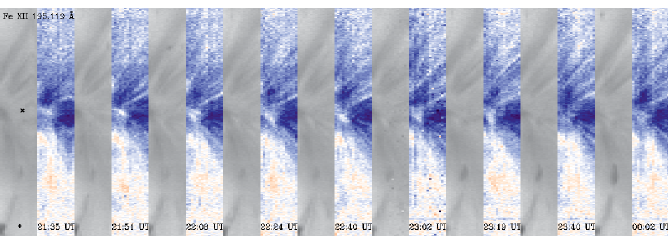
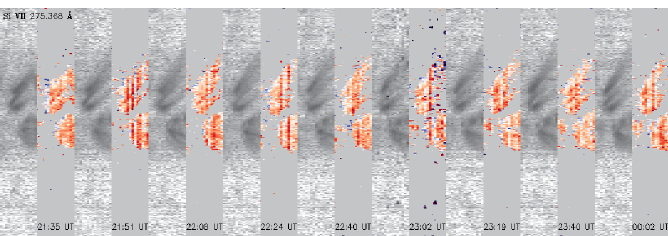
On 2010 March 8 EIS observed the decaying AR 11045. The observing sequence starts with a context fully sampled raster (1″ slit, 60 s exposures), followed by the 3 minute cadence slot imaging (17:23 – 20:55 UT). To investigate the short term variability of the spectral signatures, the sequence is followed by a set of sparsely sampled rasters (2″ slit, 4″ steps) that cover a area in 6 minutes from 21:41 UT until 00:03 UT. The bottom panels of Fig. 1 show a view of the active region and the different fields-of-view. The electronic version of the manuscript contains movies of both datasets.
Data were processed using standard EIS software. This involves subtraction of the dark current and correction of artifacts like cosmic rays and warm and hot pixels. Images were co-aligned using standard cross-correlation techniques. This removes both the spacecraft jitter and the displacement of the slot images along the wavelength direction on the detector due to the orbital changes in temperature (Brown et al., 2007).
3. Results
Investigations of apparent motions in active region peripheral loops have been presented before. The novelty of this work is two-fold. Firstly, we provide the first look at the motions with relatively high cadence (3 minute) monochromatic (0.9 Å) imaging, which should clarify any ambiguities from line blending that is present in EUV imagers. Secondly, we present the first analysis of the short timescale spectral variability of the blue-shifted low density regions. Prior to these results we will discuss the morphological relationship between the bright red-shifted Si VII loops and the dim blue-shifted Fe XII loops.
3.1. Morphology
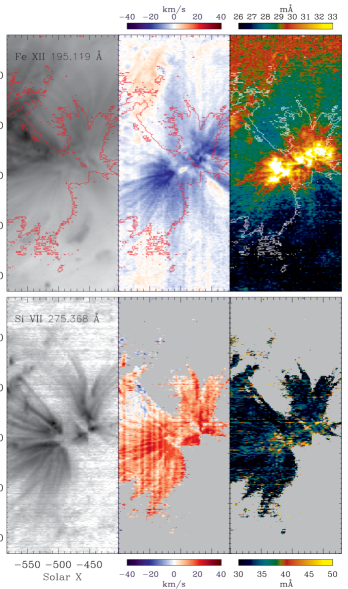
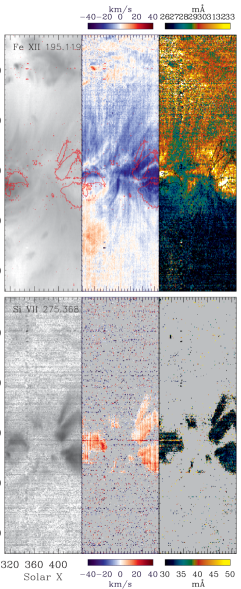
Fig. 2 shows the rastered areas of both active regions outlined with dotted lines in Fig. 1. The first column is the radiance, followed by Doppler velocities and line widths. These quantities correspond to the Gaussian fit of the spectral profiles, a two Gaussian fit in the case of the Fe XII 195.119 Å to account for the blend with the Fe XII 195.179 Å line (Young et al., 2009). Contours of the Si VII emission have been put on top of the Fe XII maps for reference. Note that the intensity scaling is the same as in Fig. 1.
There are several difficulties with measuring Doppler velocities with EIS and Warren et al. (2010a) describe them in some detail. First, we need to correct for the orbital drift of the spectrum on the detector and then we have to assume a reference wavelength as our zero velocity. We use 195.119 Å and 275.368 Å , as suggested by Warren et al. (2010a)
The blue-shifts and width enhancements are located in regions that are dim compared to the core of the active region. This is now well known from EIS spectra (Doschek et al., 2008; Harra et al., 2008; Del Zanna, 2008). The Si VII line is weak outside the clearly defined loops, so the Doppler velocities and widths are only shown for the areas with high signal-to-noise (). As discussed by Warren et al. (2010a) these cool loops are consistently red-shifted. Width enhancements can also be detected in the March 8 dataset. They mostly correspond to the dim areas in between the bright loop footpoints.
In general, Fig. 2 suggests that the bright Si VII loops are co-spatial with the Fe XII blue-shifts. There are differences, however, when we look at the details. Extended loop structures in Fe XII have a correspondence in Si VII in the February 17 dataset, but not as much on March 8. Some of the Fe XII outward propagating motions, that will be discussed in the next section, occur in areas where no sizable Si VII emission can be seen, for instance the South West corner of the February 17 dataset. An explanation could be that at this location only the footpoints of the loops hosting the disturbances have a cooler signature. That is what Movie 1, available in the electronic version, shows. The March 8 dataset, however, shows significant areas of the field-of-view that have dim Fe XII emission and strong blue-shifts with no noticeable signatures in the cooler line, e.g., around [385″,490″]. Movie 2 confirms this and rules out the possibility of a time dependent origin for the discrepancy. What we can not completely rule out is that the absence of a cooler plasma counterpart in these areas is just due to the instrument’s sensitivity.
3.2. Time-dependent imaging
Movie 1 and Movie 2, available in the electronic version of the manuscript, show the variability of the two active regions’ peripheral loops for the two spectral lines, Si VII 275.368 Å and Fe XII 195.119 Å, side by side. The February 17 dataset shows Fe XII disturbances propagating radially out from the blue-shifted area presented in Fig. 2. This also occurs in the March 8 observations. These apparent motions are comparable to the ones observed with TRACE and XRT/Hinode (McIntosh & De Pontieu, 2009; Sakao et al., 2007). Our observations therefore confirm that the phenomenon is observable at 1 MK: the EIS wide slit images isolate a very narrow (0.9 Å) and blend free spectral region around the line (e.g., Ugarte-Urra et al., 2009). TRACE 171 Å and 195 Å passbands can be ambiguous in this respect because both bands have significant contributions from plasma at 0.6 MK, namely Fe VIII and Fe IX lines (Del Zanna & Mason, 2003), precisely the lines in which the cool peripheral loops manifest themselves. An analogous argument can be made about the broad temperature response of XRT filters.
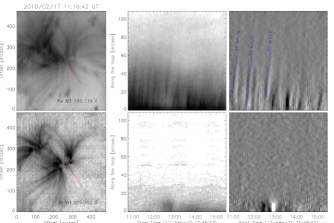
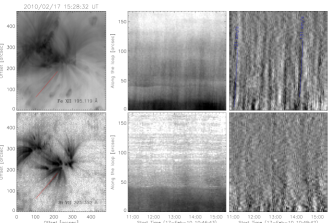
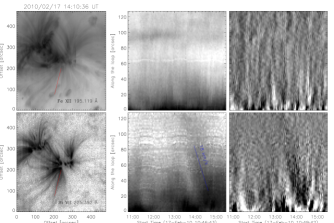
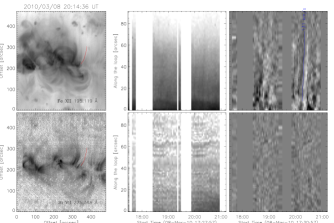
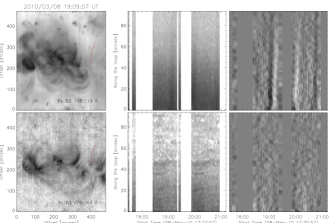
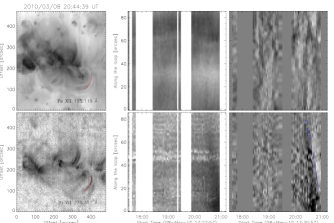
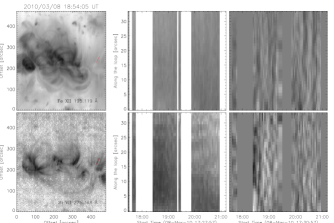
These outward propagating disturbances are not observed in the Si VII images. Fig. 3 and Fig. 4 show examples of time distance plots for various representative locations in both active regions. Each figure compares the time dependent intensity fluctuations of Fe XII and Si VII along four loop segments. The time-distance plots were constructed in the following manner. Following Warren et al. (2010b) we first manually selected the points along the segment. The points were used as spline knots to define a loop coordinate system (,) where goes along the loop’s axis and perpendicular to it. From this interpolated straightened loop segment we extracted the intensity along the axis (1″ across) and plotted it as function of time. This is shown in logarithmic scale in the middle panel. To its right we also show the running difference, i.e. the difference between two consecutive intensity values at a particular location. The running difference time-distance plots have been smoothed (boxcar of three pixels) to increase the signal-to-noise.
The loops are shown as a solid red line. The top two loops were selected based on the propagating lanes followed by the disturbances. The bottom two outline clearly defined loops in the Si VII images. The time-distance plots in Fe XII show features very similar to ones seen by TRACE and XRT: recurrent inclined ridges that represent intensity fluctuations propagating along the loops as function of time. The velocity of propagation ranges between 40 – 130, as the reference solid blue lines show. These are propagation velocities on the plane-of-the-sky and therefore only lower limits. Therefore, for Fe XII, we find qualitative consistency between the spectral blue-shifts and the upward apparent motions in the imaging.
The Si VII time-distance plots of the top two loops do not exhibit any distinct variability. In particular, most of the emission of this line at the South West corner of the image’s field-of-view is noise. The bottom loops do experience some variability. We observe downward propagating intensity changes at lower speeds 15 – 20, qualitatively consistent with the spectral redshifts measured in the rasters. Similar downflows in Si VII loops have also been observed off-limb (Ugarte-Urra et al., 2009). If this is a manifestation of cooling loops, we do not see any evidence of them in the hotter line. The picture, however, can be more complicated than just downflows, as the last panel in Fig. 3 shows, where the ridges show oppositely directed trends. Schrijver et al. (1999) already pointed out the rather complex evolution of these fan loops comparing them to “rippling curtains”. Ultimately, what seems clear from the comparison of the time-distance plots is that there is no evidence that the structures and the intensity fluctuations they exhibit in Fe XII (1.3 MK) and Si VII (0.6 MK) are related to one another. As stated before, sensitivity can be an issue in the case of the cooler and weaker line, however, it does not explain why we do not see the Si VII downward trends in Fe XII.
The time-distance plots of the March 8 dataset may appear less compelling due to the data gaps. Movies 1 and Movie 2 show, however, that both examples portray the same phenomenom. This is important, because the March 8 dataset allows us to look into the time-dependent spectroscopic properties.
3.3. Time-dependent spectroscopy
We have confirmed that there are outward propagating disturbances at 1 MK that originate in blue shifted areas at the periphery of active regions. The time-distance plots clearly show that the perturbations are discrete in nature, but spectroscopically we only know that they can persist for days (Bryans et al., 2010).
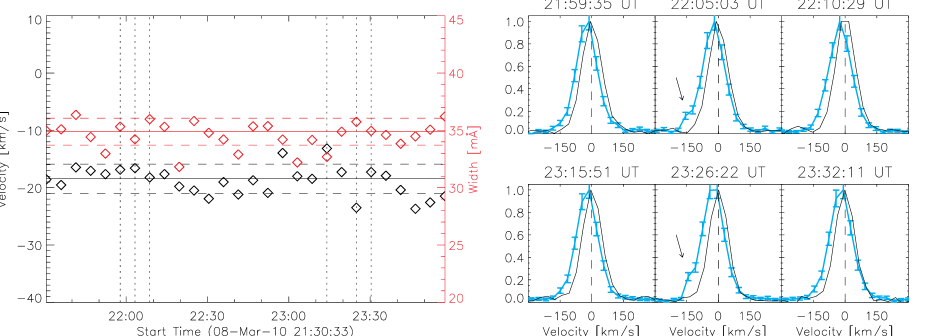
We investigate therefore the variability of the Doppler shifts in short timescales to determine whether that transient nature is also reflected in the line profiles. Fig. 5 shows a sequence of radiances and Doppler shifts for the two spectral lines in the March 8 dataset. The field-of-view corresponds to the dashed line in Fig. 1. The rasters, consisting of fifteen 20 s exposures with 4″ steps in between, result in a 5 minute cadence. We only show a third of that cadence in the figure. It confirms that Fe XII and Si VII are consistently blue and red shifted.
Fig. 6 shows in its left panel the Doppler shift and width variations of the Fe XII line at one particular location. While the changes observed in the main component of the line are small, within the standard deviation (dashed lines), we do detect asymmetric wing enhancements in the blue side of the line profiles, on timescales as short as the 5 minute cadence (see right panels in Fig. 6). The enhancements occur at velocities of . This result confirms the suspicion that the reported asymmetric profiles discussed by Bryans et al. (2010) and McIntosh & De Pontieu (2009) can have a short term nature, which favors an association with the discrete outward propagating intensity disturbances. The spectral line, however, is dominated by emission that exhibits a rather constant line-of-sight velocity of .
4. Conclusions
We have investigated the time dependent spectral properties of areas at the periphery of active region cores. In Fe XII 195.119 Å (1.3 MK) we find recurrent intensity disturbances originating in low density regions that propagate outwards along loop structures at projected velocities of 40 – 130 . This is consistent with the characteristic blue-shifted emission measured along the line-of-sight at their footpoints. The spectral profiles are dominated by small and constant shifts () in the main component of the spectral line, but reveal transient intensity enhancements in the blue wing at velocities of , on timescales as short as the available cadence: 5 minutes. This is supportive of the interpretations of the fluctuations as a result of transient events (McIntosh & De Pontieu, 2009), although we have not been able to establish a connection with the cooler temperatures.
In Si VII 275.368 Å (0.6 MK) the same areas alternate apparent voids with high density bright loops characterized by emission which is consistently red-shifted. No sign of the recurrent outward propagating disturbances is detected, but when trends are present they are generally downward at velocities of , qualitatively consistent with the spectral measurements at the footpoints. We find therefore no evidence that the structures and the intensity fluctuations visible at 1 MK and 0.6 MK are inter-related.
Given that TRACE 195 Å images can be contaminated by the emission of 0.6 MK cool lines (Del Zanna & Mason, 2003), this is the first confirmation that the outward propagating disturbances take place at 1 MK temperatures. Outward propagating perturbations have also been observed by TRACE in its 171 Å filter images, which are mostly dominated by emission from Fe IX-X lines. We do not observe those perturbations in the Si VII fan loops, which suggests either that the EIS instrument is not sensitive enough to detect them or that the perturbations observed on the 171 Å fan loops are coronal in nature and a result of the broader temperature response. New coordinated observations of EIS and AIA/SDO, with similar filters, should shed some light on this issue.
References
- Berghmans & Clette (1999) Berghmans, D., & Clette, F. 1999, Sol. Phys., 186, 207
- Brown et al. (2007) Brown, C. M., et al. 2007, PASJ, 59, 865
- Bryans et al. (2010) Bryans, P., Young, P. R., & Doschek, G. 2010, ApJ, 715, 1012
- Culhane et al. (2007) Culhane, J. L., et al. 2007, Sol. Phys., 243, 19
- De Moortel et al. (2002a) De Moortel, I., Hood, A., Ireland, J., & Walsh, R. 2002a, Sol. Phys., 209, 89
- De Moortel et al. (2002b) De Moortel, I., Ireland, J., Walsh, R., & Hood, A. 2002b, Sol. Phys., 209, 61
- Del Zanna (2003) Del Zanna, G. 2003, A&A, 406, 5
- Del Zanna (2008) —. 2008, A&A, 481, 49
- Del Zanna & Mason (2003) Del Zanna, G., & Mason, H. 2003, A&A, 406, 1089
- Doschek et al. (2008) Doschek, G., Warren, H., Mariska, J. T., & Muglach, K. 2008, ApJ, 686, 1362
- Harra et al. (2008) Harra, L. K., Sakao, T., Mandrini, C. H., Hara, H., Imada, S., Young, P. R., Van Driel-Gesztelyi, L., & Baker, D. 2008, ApJ, 676, L147
- Kosugi et al. (2007) Kosugi, T., et al. 2007, Sol. Phys., 243, 3
- Marsch et al. (2004) Marsch, E., Wiegelmann, T., & Xia, L. 2004, A&A, 428, 629
- McIntosh & De Pontieu (2009) McIntosh, S. W., & De Pontieu, B. 2009, ApJ, 706, L80
- Sakao et al. (2007) Sakao, T., et al. 2007, Science, 318, 1585
- Schrijver et al. (1999) Schrijver, C. J., et al. 1999, Sol. Phys., 187, 261
- Ugarte-Urra et al. (2009) Ugarte-Urra, I., Warren, H. P., & Brooks, D. H. 2009, ApJ, 695, 642
- Wang et al. (2009) Wang, T. J., Ofman, L., Davila, J. M., & Mariska, J. T. 2009, A&A, 503, L25
- Warren et al. (2010a) Warren, H., Ugarte-Urra, I., Young, P., & G. 2010a, Arxiv preprint arXiv:, 1
- Warren et al. (2010b) Warren, H. P., Kim, D. M., DeGiorgi, A. M., & Ugarte-Urra, I. 2010b, ApJ, 713, 1095
- Winebarger et al. (2002) Winebarger, A. R., Warren, H. P., van Ballegooijen, A., Deluca, E. E., & Golub, L. 2002, ApJ, 567, L89
- Young et al. (2007) Young, P. R., Del Zanna, G., Mason, H., Doschek, G., Culhane, L., & Hara, H. 2007, PASJ, 59, 727
- Young et al. (2009) Young, P. R., Watanabe, T., Hara, & Mariska, J. T. 2009, A&A, 606, 587