Space Velocities of Southern Globular Clusters. VI. Nine Clusters in the Inner Milky Way
Abstract
We have measured the absolute proper motions of nine low-latitude, inner Galaxy globular clusters, namely NGC 6273 (M 19), NGC 6284, NGC 6287, NGC 6293, NGC 6333 (M 9), NGC 6342, NGC 6356, NGC 6388 and NGC 6441. These are the first determinations ever made for these clusters. The proper motions are on the International Celestial Reference System via . The proper-motion errors range between 0.4 and 0.9 mas yr-1 and are dominated by the number of measurable cluster members in these regions which are very crowded by the bulge/bar and the thick disk. This sample contains five metal poor ([Fe/H] ) and four metal rich ([Fe/H] ) clusters; seven clusters are located within kpc from the Galactic center, while the remaining two, namely NGC 6356 and NGC 6284 are in the background of the bulge at kpc from the Galactic center.
By combining proper motions with radial velocities and distances from the literature we derive 3D velocities. In a number of cases, distance uncertainties make the kinematical classification ambiguous. For the metal-poor group of clusters, we obtain that three clusters, namely NGC 6273, NGC 6287 and NGC 6293 are members of a kinematically hot system, the inner halo. As for the remaining two metal poor clusters, NGC 6284 is located at kpc from the Galactic center and kinematically belongs to the thick disk, while NGC 6333, located in the inner kpc, has an uncertain membership (between halo and thick disk) due to the distance uncertainty.
Within the metal rich group of clusters, NGC 6356 and NGC 6342 have velocities compatible with membership in the thick disk; however, velocity uncertainties do not allow us to rule out their belonging to a hotter system. NGC 6342 is within kpc from the Galactic center, and thus it may belong to the bulge. NGC 6356 is at kpc from the Galactic center and thus its metallicity, kinematics and location argue together in favor of thick-disk membership.
The remaining two metal rich clusters, NGC 6388 and NGC 6441 have velocities incompatible with membership in the thick disk or the bar of the Milky Way. They can be thought of as members of a kinematically hot system in the inner Galaxy. Curiously, both clusters have similar velocity components. Together with their similar Galactic location, and peculiar but similar stellar-population characteristics, these two clusters may share a common origin. Their velocities are also very low indicating that the two clusters are now at apocenter, i.e., they will not leave the inner kpc of the Galaxy.
Subject headings:
globular clusters: individual (NGC 6273, NGC 6284, NGC 6287, NGC 6293, NGC 6333, NGC 6342, NGC 6356, NGC 6388, NGC 6441) — astrometry — Galaxy: structure — Galaxy: bulge — Galaxy: disk1. Introduction
Substantial progress has been made in recent years in our understanding of the bulge region of our Galaxy thanks to large-area near infrared photometric surveys as well as spectroscopic surveys that have provided radial velocities and detailed chemical abundances for large samples of stars (Zoccali 2009). Yet, due to the complexity of this region, we are now confronted with many details, but not a comprehensive, self-consistent picture. Recent kinematical evidence by Howard et al. (2009) combined with information from COBE/DIRBE observations, as well as starcounts, show the bulge to have a boxy morphology with cylindrical rotation (see review by Freeman 2008) consistent with its formation via a disk instability.
Alternatively, the bulge could form via early mergers and end up as a merger remnant with a spherical distribution and be rather hot kinematically. Indeed this is what is seen when one analyzes radial velocities of massive (), metal rich ([Fe/H] ) clusters in the inner ( kpc) Galaxy (Burkert & Smith 1997, Côté 1999). These studies show however that low-mass, metal-rich clusters have kinematics consistent with bar membership. Since the kinematical properties are derived only from radial velocities, the overall geometry and other assumptions, the distinction between these groups is not clear-cut. Likely thick disk cluster members confuse the picture as well. To the rescue come tangential velocities which enable us to build a clearer picture of the inner Galaxy as inferred from its globular clusters. It is important to see whether globular clusters resemble the field stellar population of the bulge and to what degree, if we wish to have a comprehensive formation picture of the bulge.
Here, we continue our previous work on absolute proper motions of globular clusters based on Southern Proper Motion Program data. We describe the measurements in Section 2, the derivation of the absolute proper motions in Section 3, and that of the velocities in Section 4. We discuss our results in Section 5.
2. Measurements
We continue our program to measure absolute proper motions of globular clusters as a part of the overall Southern Proper Motion Program (SPM) described in a series of papers: Platais et al. (1998), Girard et al. (1998), Girard et al. (2004, 2010).
The cluster part of the SPM provided measurements for 25 clusters reported in a series of papers: Dinescu et al. (1997, 1999ab, 2003) and Casetti-Dinescu et al. (2007), named Papers I through V, respectively. Together with the sample presented here, the SPM has measured 34 clusters, which represents of the total number of clusters with such measurements111An updated version of the list of all globular clusters with absolute proper motions can be found at www.astro.yale.edu/dana/gc.html.
The first-epoch SPM survey was taken from 1965 to 1979, and is entirely photographic. The SPM second-epoch survey is approximately one third photographic (taken from 1988 to 1998) and two thirds CCD-based (taken from 2003 through 2008). The main survey CCD data started with a two-fold overlap of the frames (see below). Later, single coverage was used, when it was found that a single CCD exposure was already astrometrically superior to the first-epoch plate material. For the clusters, apart from the main survey, we take additional frames centered on each cluster. In Table 1 we list the SPM field centers, and the photographic and CCD material used in the reductions, together with the epochs of the observations.
In three of our four fields presented here, the second-epoch positions are CCD-based. In the remaining field (SPM #436, cluster NGC 6441), the second-epoch positions are predominantly photographic, supplemented by six CCD exposures taken on the cluster itself. The three fields with no second-epoch photographic material lacked a small portion of CCD coverage from the main SPM survey. These areas consist of a declination band for field amounting to of the entire area, two corners of field amounting to of the entire area, and about for around the edges of the field (see Table 1). For these limited areas, the second-epoch positions are taken from , Tycho-2 (Perryman et al. 1997), UCAC2 (Zacharias et al. 2000) and 2MASS point source catalog (Cutri et al. 2003). Given the construction of the input list of objects to be measured, these positions are predominantly from 2MASS.
The program clusters are at low Galactic latitude and toward the bulge direction. Since extinction is high in these directions, we used stars to tie to an inertial reference system rather than extragalactic objects. Thus the proper motions are on the International Celestial Reference System via . Proper-motion units throughout the paper are mas yr-1.
2.1. Photographic Measurements
The SPM plates were taken with the 51-cm double astrograph at Cesco Observatory in two passbands: blue (103a-O, no filter) and visual (103a-G + OG515 filter). The plate scale is 55.1”/mm, and each field covers . The plates contain two exposures: one of 2 hours that reaches and an offset of 2 minutes. During both exposures, an objective grating is used which produces a series of diffraction images on either side of the central, zero-order images. The multiple sets of images for bright stars (for , there are only long exposure, zero-order images) allow us to detect and model magnitude-dependent systematics that affect positions and consequently proper motions. The method has been described and thoroughly tested by Girard et al. (1998), and it shows that stars with and faint cluster stars () can be placed on a system that is largely free of systematics. For very bright magnitudes (, the corrections are large and likewise their uncertainties; thus it is possible that residual magnitude equation is left at the very bright end, and for this reason, the very bright stars are not used. Since the magnitude correction is made independently for each plate, and there are multiple same-epoch plates (from 2 to 4) in each field, residual magnitude equation errors will show up as scatter in the multiple-plate data and contribute to the formal proper-motion uncertainties derived from positional scatter (see Section 3).
The plates are measured with the Yale PDS microdensitometer in an object-by-object mode with a pixel size of 12.7 m. For each SPM field, we measure a preselected set of stars (see also Papers IV and V). This set consists of all stars (typically 100 per field), a set of Tycho-2 stars (Perryman et al. 1997), another set of bright () UCAC2 stars (Zacharias et al. 2000), reference stars and cluster-region stars. Reference and cluster stars are selected from UCAC2 and 2MASS (Cutri et al. 2003) catalogs. Cluster-region stars are selected to reside within a radius from the cluster center. Reference stars consist of two subsets: one set uniformly distributed over the entire field, the other as a ring around each cluster with radius . Within the ring and cluster area, all objects found in UCAC2 or 2MASS are selected for the input list. For the uniformly distributed reference stars over the entire field, we select a fraction of UCAC2 ans 2MASS stars imposed by the time limitation of the PDS scans. For instance, for field where there are four clusters, we had a total input number of stars for the uniformly distributed reference stars, for the ring stars, and stars for cluster-region stars. For field , where there is one cluster, we had a total input number of stars for the randomly distributed reference stars, for the ring stars, and for the cluster-region stars.
The bright stars in the input catalog assure an appropriate magnitude range of various diffraction orders with which to model magnitude-dependent systematics. Only stars are used to determine the correction to absolute proper motions. The reference stars (ring and entire field) are used to map plate positions into one another as well as CCD positions into the photographic positions.
For one field, , we had a slightly different input catalog, as this field was measured early on, together with our Paper IV clusters, since both epoch plates existed. However, at that time, we realized that although we can obtain a reliable correction for the absolute proper motion for this field, the motion of cluster NGC 6441 was unreliable. This cluster is more distant, and the time baseline for the plates is only 22 years (Tab. 1). So, we took several CCD frames centered on the cluster in 2007 to improve the mean motion of the cluster. The strategy used to make the input catalog was similar to the one presented above; however instead of UCAC2 and 2MASS, we used the Guide Star Catalog (GSC) 1.1 (Lasker et al. 1990) and the USNO-A2.0 catalog (Monet et al. 1998). For cluster stars, we derived a catalog based on a coarse scan centered on the cluster of the deepest SPM plate.
During these long PDS scans (up to 24 hours) we monitor a set of 8 to 10 stars that are used to correct for thermal drift. Positions, instrumental magnitudes and other image parameters are derived with the Yale centering routines that fit a two-dimensional Gaussian function to the image profile (Lee & van Altena 1983).
2.2. CCD Measurements
The CCD system mounted on the double astrograph consists of two main cameras: a 4K x 4K PixelVision (PV) camera (15 micron pixel) in the focal plane of the yellow lens and an Apogee 1K x 1K (24 micron pixel) camera in the focal plane of the blue lens. Later, the Apogee camera was replaced with an Apogee Alta 2K x 2K (12 micron pixel) camera. The PV’s field of view is with a scale of 0.83”/pix. The Apogee Alta camera covers a area with a scale of 0.74”/pix. The PV data were used for both astrometry and photometry, while the Apogee data were used only for photometry. The observations are taken with the diffraction grating oriented at , thus ensuring a dynamical range of 10 mag (i.e., 6 from the CCD plus 4 from the grating). Exposure times are 120 sec, reaching the same depth as the first-epoch plates. Between 3 and 6 frames are taken on each cluster in addition to the survey CCD frames taken for each SPM field (Tab. 1). These have exposures of 30, 60 and 120 sec. The astrometric reduction of the CCD data is thoroughly described in Paper V; here we briefly mention only the steps applied.
The CCD data are corrected for bias, dark (only in the case of the Apogee frames is it significant) and flat fielding. SExtractor (Bertin & Arnouts 1996) is used for object detections, aperture photometry and preliminary x,y centers. Final x,y centers are derived by fitting two-dimensional elliptical Gaussian functions to image intensities. These image centers have a positional precision of mas per single image, for . Two other corrections of the CCD positions are applied per frame. The first is a correction for the optical field angle distortion (OFAD). This correction is determined from stacked residuals into UCAC2, and is applied as a mask to the CCD data (see Paper V). The second correction refers to the positions of different grating-order images that must be placed on a common system with those of the central-order images. We found offsets between the average position of symmetric image orders and the position of the central order, but these offsets are not related to the magnitude of the object (as is the case for photographic plates). Therefore these offsets were corrected as such, a simple offset between different image order systems (see also Paper V).
The next step is to link all of the CCD frames for a given SPM field from the main survey to produce a CCD pseudo-plate. This is different from our procedure adopted in Paper V, where each individual CCD frame was mapped into a master first-epoch plate. The linking of the CCD frames was developed for the construction of the SPM4 catalog and is described in Girard et al. (2010). In brief, the mask-corrected CCD x,y positions of each frame are transformed onto the system of the UCAC2 to facilitate pasting together the roughly 50 to 100 frames (depending on whether the field had two-fold or single coverage) that comprise a SPM field. An iterative overlap method is employed to perform this task using Tycho2 stars as an external reference system to ensure that systematics from the individual frame overlaps do not accumulate. In this manner, an artificial ”pseudo-plate” is built up from CCD frames. The CCD frames that contribute to any one field’s pseudo-plate may actually span two to three years’ range in epoch whereas an actual plate has a single epoch. For this reason, once preliminary proper motions are determined from a second-epoch pseudo-plate, an improved pseudo-plate is constructed, one that incorporates the preliminary proper motions prior to pasting the frames together in a new overlap solution. This single-epoch pseudo-plate can then be treated the same as a real second-epoch plate in the reduction process to yield final proper-motion determinations.
The CCD photometry is derived from aperture photometry calibrated into Tycho2 (corrected to the Johnson system) and several other external catalogs such as the Guide Star Photometric Catalog II (Bucciarelli et al. 2001). When no CCD photometry is available, we use photographic photometry from the first-epoch plates calibrated on Tycho2. For our purposes in this paper, we use however 2MASS photometry.
3. Proper Motions
To obtain proper motions we use the central-plate overlap method described for instance by Girard et al. (1989). Thus, we transform all measurements — CCD pseudo-plate, on-cluster CCD frames, photographic positions of various image grating-order systems — into one master photographic plate list which is chosen to be a visual plate with the central-order image. This transformation is a polynomial function of x,y coordinates of up to 5th order, and it uses stars with magnitudes between and 17 distributed uniformly over the field and with a higher density in a ring around each cluster. The number of reference stars for different epoch measurements ranges between 500 and 6000 stars, with a mean average magnitude roughly between and 16. A linear least-squares fit of positions as a function of time gives the proper motion of each object. Measurements that differ by more than from the best fit line are rejected as outliers. The formal proper-motion error is given by the scatter around the best-fit line.
For field we have applied a different procedure. The photographic based motions are derived from each plate pair: i.e. blue second-epoch into blue first-epoch, and likewise for the visual plate pair. This ensured proper motions for stars over the entire field, and provided the correction to absolute proper motions via stars. For the cluster, we have applied a central-plate overlap method to include the CCD frames taken on-cluster. We have selected reference stars in the same magnitude range for the cluster solution as was used in the plate-pair, entire-field solution. In this way we can apply the correction to absolute as an offset, assuming that the reference stars belong to a kinematically similar population.
3.1. Correction to Absolute Proper Motions
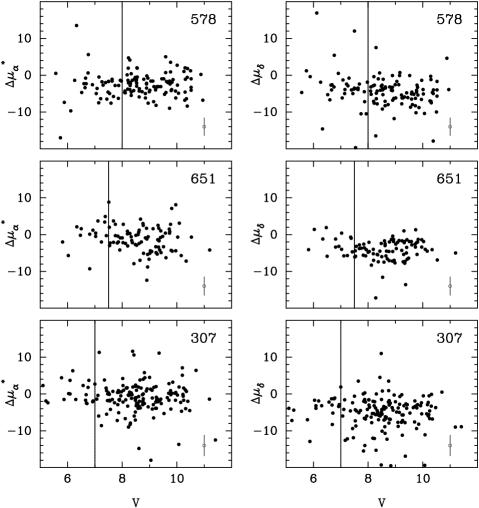
The correction to absolute proper motion is determined directly from the difference between the proper motion and our relative proper motion. These differences also serve to check for various systematics as a function of magnitude and position on the plate. In Figure 1 we show the proper-motion difference in each celestial coordinate as a function of magnitude for the three fields that had only CCD data as second epoch. In what follows we use the notation . From Fig. 1 it can be seen that at the bright end, the magnitude equation is not entirely corrected. For this reason, we eliminate the bright stars; the bright magnitude limit is indicated with a vertical line. Formal SPM errors in the proper-motion are between 2.1 and 2.6 mas yr-1 for these stars, and are represented with a gray symbol in Fig. 1.
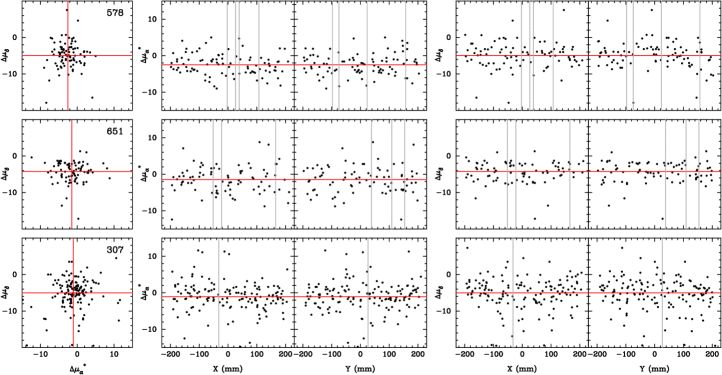
In Figure 2 we show the proper-motion differences in both coordinates in a vector-point diagram (VPD) (left panels), and as a function of position on the plate (middle and right panels). Cluster locations are marked with a gray vertical line. In general, there are no significant trends with position, except toward the edges of the field in some cases. The final correction to absolute proper motion — also referred to as zero point correction — per field is determined using probability plots (Hamaker 1978) trimmed at at each side. These values are listed in Table 2, and represented with a cross in Fig. 2. In Table 2 we also include a column with the clusters in each field.
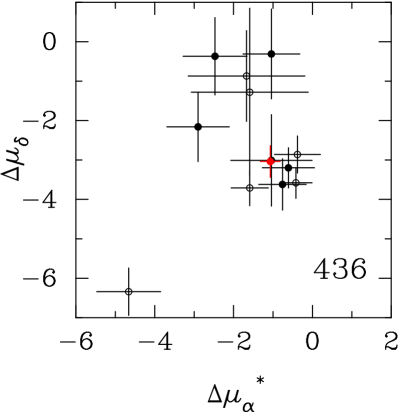
For field , we show the values of the correction to absolute proper motion obtained from two plate pairs and from various image orders in Figure 3. There are three image-order solutions for the long exposure and three for the short exposure, thus six in all per plate pair. Open symbols show the visual plate solutions, filled the blue plate solutions. Here too we used only stars that are not affected by residual magnitude equation, i.e. . The mean values for each solution are obtained using probability plots trimmed at on each side. The one deviant point is the central order of the visual plate pair, and we exclude it from the final mean. The final mean value for the field is the error-weighted mean of the eleven determinations, and it is represented with a red symbol in Fig. 3. Its error is given by the scatter of the individual solutions.
3.2. Cluster Proper Motions
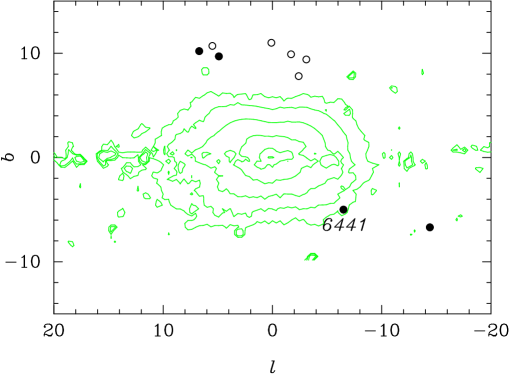
The most challenging part of the measurements presented here is the appropriate choice of cluster members. The clusters lie in regions strongly contaminated by the Milky Way bulge, bar and disk. In Figure 4 we show the location of the clusters in Galactic coordinates, together with the 2.2 m surface brightness data from Launhardt et al. (2002) presented in their Figure 5. Note the particular location of NGC 6441 which is discussed further, later on. It presented a particularly difficult case of contamination.
One way to minimize this contamination is to work with a small area centered on the cluster. If however we restrict our candidate cluster stars to a small area centered on the cluster (of radius ) we face the problem of crowding and thus poor astrometric precision. Within of a cluster center our photographic plates are essentially unusable, and thus we are left with rather few well-measured cluster stars, especially for less massive clusters. To overcome this problem, we first work only with visual plates which have a tighter PSF than the blue plates, and second we select candidate cluster members from 2MASS color-magnitude diagrams (CMDs). For five clusters we use as a guideline the ridge line of the giant branch determined in the same passbands as 2MASS by Valenti et al. (2007); in some cases we use their photometry as well as a guide to select 2MASS-based members. The Valenti et al. (2007)222the database is at www.bo.astro.it/ GC/ir-archive study provides accurate infrared photometry for bulge-region clusters, and it therefore has better photometry than 2MASS in the cluster region. However we could not use only this photometry since it covers a box centered on the cluster. Our cluster area is within of the cluster center, except NGC 6441 where we used a box centered on the cluster. These choices have to do with the construction of the input catalogs (see Section 2.1).
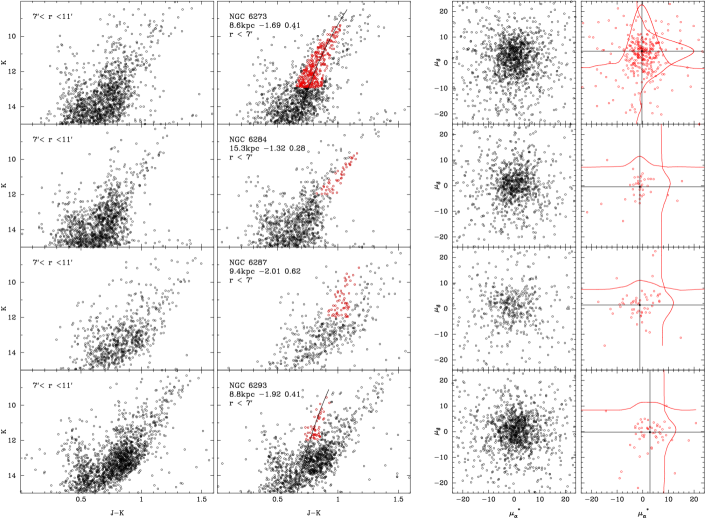
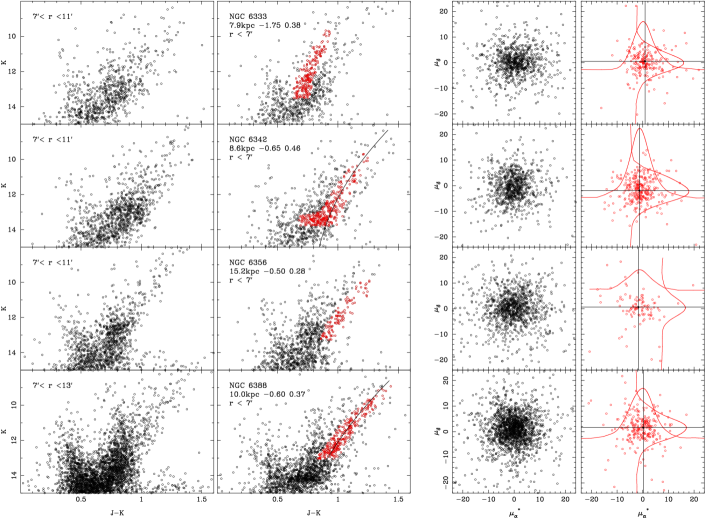
In Figure 5 we show the CMDs for the ring region (first column from the left) and for the cluster region (second column). The radius range of these regions is specified in each panel. Each row represents one cluster labeled in the panels of the second column. Here we also indicate the cluster distance, metallicity and reddening as listed in the 2003 update of the Harris catalog (Harris 1996, hereafter H03). The CMDs show objects with measured proper motions (rather than the complete 2MASS catalog in the given region). In red we show our selection of red giant cluster candidates. The ridge line from Valenti et al. (2007) is shown with a black line. The cluster sequence is visible as an overdensity of stars in the cluster-region selected samples, compared to the ring region. The third column of Fig. 5 shows the relative proper motion VPD for all objects in the cluster-region sample (i.e., in the CMD from the second column). The fourth column shows the VPD of CMD-selected cluster candidates. The proper-motion marginal distribution in each coordinate is overplotted. The black cross-hairs indicate the value of the adopted mean relative cluster motion. Figure 6 is similar to Fig. 5, but for the next set of four clusters. The faint limit of the samples is imposed by the morphology of the giant branch of the cluster in relation to the field population. Clearly, at faint magnitudes there is more overlap with the field population than at bright magnitudes. Also, we do not use stars fainter than as these are at the faint limit of the proper-motion data, where errors are large.
For these eight clusters, we have adopted two different ways to estimate the mean relative proper motion according to the size of the CMD-selected cluster candidates. First, we eliminate high proper-motion stars, i.e., with mas yr-1. Then, for small samples we use probability plots trimmed at on each side. This implies that in the CMD-selected sample only of the stars are cluster stars, and the rest are treated as contaminants. We have also estimated this contamination by using the CMD from the ring area, scaled to the cluster-region area, and we found that contamination is a realistic value. The results are insensitive to different trimming fractions (between 5 and 15%).
For larger samples — which are mainly those of rich, massive clusters — we fit the sum of two Gaussian functions to the proper-motion distributions in each coordinate: one representing the field, the other the cluster population (see e.g., Girard et al. 1989). The error in the mean motion is determined from the width of the cluster distribution divided by the square root of the number of cluster stars, both given by the fit. From the fits of each coordinate, we adopt the more conservative error, i.e. the larger in size.
In Table 3 we list the mean relative proper motion obtained for each cluster, together with the faint -band magnitude limit of the CMD selected sample, the number of stars in the sample and the method adopted to derive the mean. Numerous tests have been done for each cluster with the CMD-selected sample (i.e. fainter magnitude limits), radius-selected sample (i.e., smaller than ), and with the means estimated using more severely trimmed probability plots, to finally arrive at the solutions adopted in Table 3, which we regard as robust within the quoted errors.
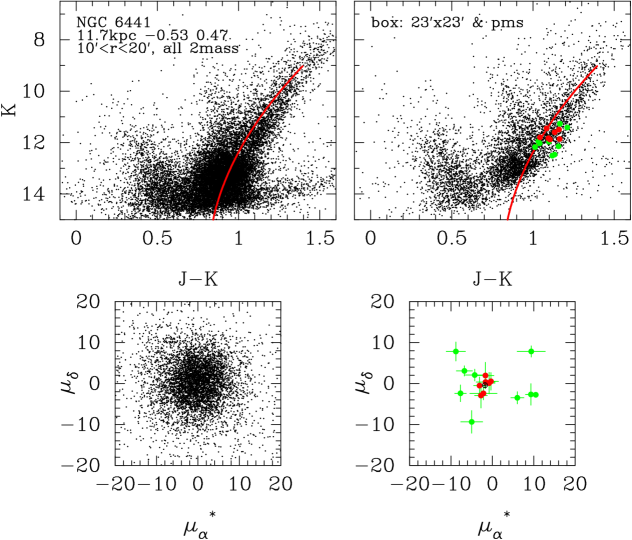
A more difficult case is NGC 6441, that lies in a complex Galactic region. In Figure 7 we show the data for NGC 6441. The top left panel shows the CMD of a large ring region centered on the cluster () as given by the entire 2MASS catalog in this region. With a red line we show the giant-branch ridge line determined by Valenti et al. (2007). This plot shows a rather well-defined giant branch which is displaced from the ridge line defined by the cluster. At a given magnitude, it is slightly redder than the cluster ridge line, and extends to brighter magnitudes. Since it is a rather narrow feature, we suspect that the majority of the stars in this structure are at a given distance which is roughly similar to that of the cluster. Likewise, the shape of the giant branch argues for a metallicity somewhat similar to that of the cluster. Since NGC 6441 is at a distance of 11.7 kpc from the Sun, it is unlikely that this giant branch belongs to the concentration of stars at the Galactic center, or “nominal” bulge stars from a spherical distribution with its peak at the Galactic center. Examining the location of NGC 6441 with respect to the Galactic bar (with parameters as summarized by Gerhard 2002, see also Fig. 4 and Section 5), it appears that the cluster is located near the far end of the bar, with a geometry where the line of sight from the Sun toward the cluster crosses the tip of the far end of the bar. That this is the case, can also be gleaned from the work of Babusiaux & Gilmore (2005), where they trace the bar out to longitudes of by studying red clump stars from a near-infrared photometric study. Their field located at clearly detects the far side of the bar at a galactocentric radius of kpc, or a distance from the Sun of 9.9 kpc. This field is near the location of NGC 6441 (see Tab. 4), only closer to the Galactic plane (). Babusiaux & Gilmore (2005) also note that their detection at has a distance inconsistent with the continuation of the bar at these longitudes, and they attribute this detection and its distance to the signature of the end of the bar which is circumscribed by an inner ring.
Therefore this well-defined giant branch is likely due to the far end of the bar, (or to a ring) located in the foreground of the cluster (if we adopt the geometry from Babusiaux & Gilmore 2005). Given that it lies under the ridge line of NGC 6441, it is probably more metal rich than NGC 6441.
This structure makes our choice of cluster members very difficult. In the top right panel of Fig. 6 we show the CMD of a smaller area centered on the cluster for stars with proper motions. The giant branch seen in the previous plot is present here too, lying on top of the cluster giant branch. Because of this confusion we seek other criteria to select cluster members. Fortunately, NGC 6441 has been observed spectroscopically more recently by Gratton et al. (2007) where cluster giants are selected based on the CMD, radial velocity and distance from cluster center criteria. They present a set of 25 likely members; of these, 16 stars have proper motions. These stars are shown with filled symbols in Fig. 7 top-right panel. The stars used for the mean proper motion of the cluster are shown with red filled symbols. The bottom-left panel of Fig. 7 shows the relative proper-motion VPD for stars in the cluster area (those shown in the top right CMD). The bottom-right panel shows our proper motions for the cluster members from Gratton et al. (2007). A proper-motion clump is apparent with a scatter comparable with the formal errors. To determine the mean proper motion, we use stars with four or more plate/CCD measurements, and eliminate stars with deviant proper motions from the mean: the stars contributing to the mean are shown with red symbols. The dark circle marks the adopted mean which is a simple average of the proper motions of seven stars. The error of the mean is determined from the proper-motion scatter of the seven points.
Absolute proper motions are obtained by applying the correction from Tab. 2 to each cluster as an offset. The error is derived from the quadrature sum of the relative proper-motion error and that of the zero-point error. We present in Table 4, the absolute proper motions and their errors, the Galactic coordinates, distances and radial velocities of the clusters. The radial velocities are from H03. There are two distance values: the adopted distance is the one from H03, the alternative one is a value given for clusters that may be on the far or near side of the bulge (where the Galactic center is taken to be at 8.0 kpc from the Sun), according to likely distance uncertainties. For these clusters, the change in distance is such that they flip their location with respect to the Galactic center (from near to far and opposite). This alters the velocity components in cylindrical coordinates and by more than their formal error. Essentially they can change sign, and/or interchange their values. One example of the uncertainty in distance is NGC 6287. While H03 provides a distance of 9.3 kpc, Lee et al. (2001) determine a distance of 7.4 kpc. For NGC 6287, we will adopt the Lee et al. (2001) distance estimate as an alternative value. For the rest of the clusters, we simply adopt a value that will place them on the opposite side of the Galactic center than that given by the H03 distance, and is within reasonable distance errors (or the order of ).
4. Velocities
Velocities are derived from the absolute proper motions, distances and radial velocities listed in Tab 4. We assume that the Sun is at kpc, the Local Standard of Rest (LSR) velocity is km s-1, and the Sun peculiar motion is km s-1 (Dehnen & Binney 1998). Velocity errors are determined from the formal errors in the proper motions, radial velocities and a distance error.
In Table 5 we list the velocity components in a Galactic restframe, along with directions defined by the location of the LSR, and along () directions in a cylindrical coordinate system. is along the radial direction from the Galactic center to the cluster location projected on to the Galactic plane, and positive outward from the Galactic center, while is perpendicular to the radial direction and positive toward Galactic rotation. Together with the velocity components we list the cluster location in coordinates, where , the cluster metallicity and integrated absolute magnitude () (H03). For clusters within 4 kpc from the Galactic center, we also provide the velocity of the bar at the location of the cluster, assuming the bar rotates as a solid body with an angular velocity of 60 km s-1 kpc-1 (Gerhard 2002 and references therein). This velocity is to be compared with the component. Table 6 is similar to Table 5, only for the subsample of clusters with alternative distances.
5. Discussion
In Figure 8 we show the cluster locations and their velocities; to the right it is shown a zoomed-in version of the left panels with clusters labeled for easier identification. There are two projections in Fig 8: in the Galactic plane (top), and perpendicular to the Galactic plane in the plane (bottom). Metal rich ([Fe/H]) clusters are shown with filled symbols, metal poor with open symbols. The LSR is also shown with a square symbol together with its 220 km s-1 velocity vector. The ellipse represents the bar which is drawn here at a orientation from the Sun-Galactic center direction, a semimajor axis of 3.0 kpc, and an axis ratio of 10:3:3. These values are chosen from the bar parameters summarized in Gerhard (2002), although he gives smaller values for the semimajor axis in agreement with studies based on scale lengths determinations from starcounts. However, Bissantz et al. (2003) built a model of the inner Galaxy based on COBE/DIRBE data and red clump stars, and constrain the corotation radius to be kpc; this radius is known to constrain the maximum radius of the bar. Babusiaux & Gilmore (2005) determine that the bar radius is between 2.5 and 3.0 kpc. Therefore, here we adopt a 3.0 kpc semimajor axis. The dotted lines indicate a 3.4-kpc circle representing the corotation radius, and the solar circle radius of 8 kpc. In this discussion we do not consider the long bar, recently found by Benjamin et al. (2009), which has a much thinner configuration than the traditional bar, i.e., a scale height of 100 pc, while our clusters are at distances of 1 kpc or more from the plane.
In what follows we describe the halo as a population with means in each velocity component equal to 0 km s-1 and dispersions km s-1 (e.g. Smith et al. 2009, Carollo et al. 2010). For the thick disk we adopt the means in and equal to 0 km s-1 and km s-1, where is the distance from the Galactic plane in kpc. The thick disk dispersions adopted are km s-1 (Girard et al. 2006, Carollo et al. 2010).
The two clusters located far from the bulge region, NGC 6284 and NGC 6356 both have velocities consistent with thick-disk membership: low and components and high . Based on kinematics alone, NGC 6356 has only a higher chance to belong to the thick disk than to the halo. However, taken together with the high metallicity, this cluster is better classified as a thick-disk cluster.
While NGC 6356 is a metal rich cluster, and therefore expected to belong to the thick disk, NGC 6284 is a mildly metal poor cluster. We therefore add one more cluster to the sample of metal-poor ([Fe/H] ) clusters with thick-disk like orbits: NGC 6626 (M 28) - Cudworth & Hanson 1993, NGC 6752 - Paper I, NGC 6266 (M 62) - Paper IV, and possibly NGC 6254 (M10) and NGC 6171 - Paper III.
For all clusters within kpc, the distance ambiguity makes their velocity interpretation somewhat difficult. It appears safe to say that two metal poor clusters, NGC 6273 and NGC 6293 have velocities consistent with halo membership under both distance estimates (Tab. 5 and 6) due to their high velocity components. NGC 6342, a metal rich cluster, has velocities consistent with the thick disk or a “nominal” bulge described as a spheroid with a rotation velocity of km s-1 and a dispersion of km s-1 (Côté 1999, see also Section 5.1).
NGC 6287, another metal poor cluster has velocity components that argue in favor of membership to the bar (Tab. 5 and 6). However its location 1.4 kpc (Tab. 6) above the Galactic plane makes this association less likely. Therefore, we associate this cluster with the halo. The last inner 2-kpc, metal-poor cluster, NGC 6333 has velocities consistent with thick disk membership; however, the distance uncertainty, makes this membership less evident, with a non-negligible chance to belong to the halo.
5.1. The Case of NGC 6388 and NGC 6441
Clusters NGC 6388 and NGC 6441 are known to have bimodal horizontal branches as well as very extended blue horizontal branches (EHB) in spite of their high, thick-disk like metallicity (Rich et al. 1997, Piotto et al. 2002, Busso et al. 2007). They are also very massive: the third and fifth in rank after clusters Cen, M 54 (at the center of Sagittarius dwarf galaxy) and NGC 2419 (H03, Yoon et al. 2008). Thus their properties fit the picture proposed by Lee et al. (2007) where EHB clusters are predominantly massive clusters with double or multiple populations, of which at least one is enriched in He. Recently, HST photometry has unambiguously shown that the EHB clusters observed have multiple main sequences and subgiant branches (e.g., Piotto 2008 and references therein), and there is a growing body of evidence that He enrichment is responsible for the extended blue part of the horizontal branch as well as for the blue main sequences (Piotto 2008). For NGC 6388, Piotto (2008) shows that it has a double subgiant branch, but there is no clear evidence that NGC 6388 and 6441 have populations with multiple metallicities as is the case of Cen. At any rate, the existence of a He-rich population is best explained by self enrichment of the system from a previous generation of 5 to 10 M⊙ stars (Renzini 2008 and references therein). As discussed by Renzini (2008), the major problem with self enrichment is that the first-generation population currently seen in the cluster can not produce sufficient He to account for the existing He-rich, second-generation population seen in the same cluster. Thus one has to invoke additional material brought in from an originally much more massive system than the present-day cluster (e.g. Bekki & Norris 2006). Also, in the case of Cen, Gnedin et al. (2002) show that the self-enrichment scenario is at odds with the present-day orbit that implies many disk crossings that would strip the cluster of its gas produced, for instance, by AGB stars. This may also be the case for NGC 6338 and NGC 6441, with their low energy, in plane orbits as suggested by their velocities. The above arguments naturally imply the existence of these type of clusters at the bottom of a deep potential well, a system resembling more a dwarf galaxy, rather than a cluster. Lee et al. (2007) as well as Bekki & Norris (2006) proposed that these EHB clusters are of extragalactic origin, formed probably as nuclei in dwarf satellites that were accreted by the Milky Way, with Cen being the prototype.
The kinematical evidence from the present work clearly shows that these two clusters are not members of the thick disk despite their high metallicity. Also, the low velocity components indicate that NGC 6388 and NGC 6441 are at or near apocenter. Thus they are confined to the inner kpc of the Galaxy. However, their velocity components and for NGC 6388, its location too, clearly show that they do not belong to the bar (Fig. 7).
As such, they can be classified as members of a kinematically hotter system than the thick disk, a “nominal” bulge with a spherical distribution that peaks at the Galactic center. Metal-rich globular clusters within kpc from the Galactic center appear to be consistent with such a picture (Minniti 1995, Côté 1999, Bica et al. 2006), although some metal-rich globular clusters — those of low luminosity — may belong to the bar (Côté 1999, Burkert & Smith 1997). The existence of such a system distinct from the well-known bar mentioned above is still a matter of debate (see e.g. Howard et al. 2009). Nevertheless, assuming such a system exists, we adopt its kinematic properties from Côté (1999) who, based on radial velocities, distance and geometry, determines a mean rotation and velocity dispersion for a sample of 19 metal rich clusters within 4 kpc from the Galactic center. He obtains a rotation velocity of km s-1 and a dispersion of km s-1. Using our components and their errors, and the mean rotation and the dispersion from Côté (1999), we obtain that both NGC 6388 and NGC 6441 are consistent with membership in this system (within and from the mean respectively).
Their very similar velocity components and similar Galactic locations imply similar orbits. Motivated by this similarity, as well as by the similarity of their peculiar physical properties which here we parametrize only by the integrated absolute magnitude and metallicity, we perform a statistical experiment to quantify the chance of spatial and velocity coincidence. First, we choose a representative Galactocentric radius interval for the two clusters. Under the assumption that the error in the distance is of the distance, NGC 6388 is located within kpc from the Galactic center, while NGC 6441 is within kpc. Thus the representative Galactocentric radius interval is chosen to be from 2.5 to 5.0 kpc. In this interval there are only 5 globular clusters with [Fe/H] , and (H03). The magnitude limit is taken from the analysis of Lee et al. (2007), which shows that the majority of EHB clusters are brighter than this limit. We also assume that bright, massive clusters are not missing from our sample due to foreground extinction. We will therefore look for the spatial and velocity separation for a set of five clusters in a distribution that resembles the metal-rich globular-cluster distribution in the inner Galaxy, and compare with the same quantities for NGC 6388 and NGC 6441. The spatial separation between NGC 6388 and NGC 6441 is kpc, while the velocity separation is km s-1. We generate a spatial distribution that obeys a density law of the form (Bica et al. 2006), and is located between 2.5 and 5.0 kpc. To each point, velocity components are assigned from Gaussian velocity distributions with means km s-1 and dispersions km s-1 that resembles the Côté (1999) description of bulge clusters. From this population we extract 5 points and calculate their spatial and velocity separations. We retain only the smallest spatial separation and its corresponding velocity separation. Then we repeat this experiment 20000 times. We obtain that there is a chance to obtain lower spatial and velocity separations than those of the two clusters. If we consider a uncertainty in the clusters’ velocity separation, then this chance is . While this is a non-negligible chance coincidence, it is however rather low, and makes the issue of a common dynamical origin of the two clusters an intriguing possibility.
6. Conclusions
Using SPM photographic and CCD data, we determine the absolute proper motions of nine globular clusters: five metal poor ([Fe/H] ) and four metal rich clusters. Seven clusters are located within kpc from the Galactic center, and two are located at a distance of kpc from the Galactic center, in the background of the bulge.
We determine 3D velocities by combining our proper motion data with radial velocities and distances from the literature. From the five metal poor clusters, three clusters — NGC 6273, NGC 6287 and NGC 6293 — appear to belong to a kinematically hot system, the inner halo. From the remaining two metal poor clusters, NGC 6284 belongs to the thick disk, while NGC 6333 has an ambiguous membership (between halo and thick disk) due to the distance uncertainty.
From the metal rich clusters, NGC 6388 and NGC 6441 have kinematics clearly inconsistent with thick disk membership; they can be thought of as members of a “nominal” bulge (not the bar), i.e., a spheroid with low rotation and high velocity dispersion. More interestingly, the two clusters have very similar velocity components. This taken together with their close spatial location and peculiar but similar physical properties argue in favor of a common dynamical origin of the two clusters. The remaining two metal rich clusters NGC 6356 and NGC 6342 have kinematics consistent with thick disk membership, but velocity uncertainties stemming from distance and proper-motion uncertainties do not allow us to rule out their membership to a hotter system. While NGC 6342 is within 2 kpc from the Galactic center, and thus can be part of the bulge, NGC 6356 is located outside the bulge region. Thus its location, metalicity and velocities combined argue in favor of thick-disk membership.
References
- (1) Allen, C., Moreno, E., & Pichardo, B. 2008, ApJ, 674, 237
- (2) Babusiaux, C. & Gilmore, G. 2005, MNRAS, 358,1309
- (3) Bekki, K. & Norris, J. E. 2006, ApJ, 637, L43
- (4) Benjamin, R. A. et al. 2009, ApJ, 630, L149
- (5) Bertin, E. & Arnouts, S. 1996, A&AS, 117, 393
- (6) Bica, E., Bonatto, C., Barbuy, B. & Ortolani, S. 2006, A&A, 450, 105
- (7) Bissantz, N., Englmaier, P., & Gerhard, O. 2003, MNRAS, 340, 949
- (8) Bucciarelli, B. et al. 2001, A&A, 368, 335
- (9) Busso, G., Cassisi, S. Piotto, G., Castellani, M., Romaniello, M., Catelan, M., Djorgovski, S. G., Recio Blanco, A., Renzini, A., Rich, M. R., Sweigart, A. V., & Zoccali, M. 2007, A&A, 474, 105
- (10) Burkert, A. & Smith, G. H. 1997, ApJ, 474, L15
- (11) Carollo, D., Beers, T. C., Chiba, M., Norris, J. E., Freeman, K. C., Lee, Y. S., Ivezić, Z., Rockosi, C. M. & Yanny, B. 2010, ApJ, 712, 692
- (12) Casetti-Dinescu, D. I., Girard, T. M., Herrera, D., van Altena, W. F., López, C. E., & Castillo, D. J. 2007, AJ, 134, 195 (Paper V)
- (13) Côté, P. 1999, AJ, 118, 406
- (14) Cudworth, K. M., & Hanson, R. B. 1993, AJ, 109, 2533
- (15) Cutri, R. M. et al. 2003, The IRSA 2MASS All-Sky Point Source Catalog, NASA/IPAC Infrared Science Archive
- (16) Dehnen, W. & Binney, J. 1998, MNRAS, 294, 429
- (17) Dinescu, D. I., Girard, T. M., van Altena, W. F., Méndez, R., & López, C. E. 1997, AJ, 114, 1014 (Paper I)
- (18) Dinescu, D. I., van Altena, W. F., Girard, T. M., López, C. E. 1999, AJ, 117, 277 (Paper II)
- (19) Dinescu, D. I., Girard, T. M., & van Altena, W. F. 1999, AJ, 117, 1792 (Paper III)
- (20) Dinescu, D. I., Girard, T. M., van Altena, W. F. & López, C. E. 2003, AJ, 125, 1373 (Paper IV)
- (21) Freeman, K. C. 2008 in “Formation and Evolution of Galactic Bulges” IAU Symp. Vol. 245, p. 3
- (22) Gerhard, O. 2002, in ASP Conf. Ser. Vol 273, p. 73, ”The Dynamics, Structure and History of Galaxies”, ed. G. S. DaCosta and H. Jerjen
- (23) Girard, T. M., Grundy, W., López, C. E. & van Altena, W. F. 1989, AJ, 98, 227
- (24) Girard, T. M., Platais, I., Kozhurina-Platais, V., van Altena, W. F., & López, C. E. 1998, AJ115, 855
- (25) Girard, T. M., Dinescu, D. I., van Altena, W. F., Platais, I., Monet, D. G., & López, C. E. 2004, AJ 127, 3060
- (26) Girard, T. M., Korchagin, V. I., Casetti-Dinescu, D. I., van Altena, W. F., López, C. E. & Monet, D. G. 2006, AJ, 132, 1768
- (27) Gnedin, O., Zhao, H-S., Pringle, J. E., Fall, S. M., Livio, M., & Meylan, G. 2002, ApJ, 568, L23
- (28) Gratton, R. et al. 2007, A&A, 464, 953
- (29) Hamaker, H. C. 1978, Applied Statistics, 27, 7
- (30) Harris, W. E. 1996, AJ, 112, 1487, (H03)
- (31) Johnston, K. V., Spergel, D. N., & Hernquist, L. 1995, ApJ, 451, 598
- (32) Lasker, B. M., Sturch, C. R., McLean, B. J., Russell, J. L., Jenker, H. & Shara, M. 1990, AJ, 99, 2019
- (33) Launhardt, R., Zylka, R., & Mezger, P. G. 2002, A&A, 384, 112
- (34) Lee, J.-F. & van Altena, W. F. 1983, AJ, 88, 1683
- (35) Lee, J.-W., Carney, B. W., Fullton, L. K., & Stetson, P. B. 2001, AJ, 122, 3136
- (36) Lee, Y.-W., Hansung, B. G. & Casetti-Dinescu, D. I. 2007, ApJ, 661, L49
- (37) Minniti, D. 1995, AJ, 109, 1663
- (38) Monet, D. et al. 1998, The USNO-A2.0 Catalog (Washington: US Naval Obs.)
- (39) Perryman, M. A. C. et al. 1997, The and Tycho Catalogues (ESA SP-1200: Noordwijk: ESA)
- (40) Piotto, G., King, I. R., Djorgovski, S. G., Sosin, C., Zoccali, M., Saviane, I., De Angeli, F., Riello, M., Recio Blanco, A., Rich, R. M., Meylan, G., & Renzini, A. 2002, A&A, 391, 945
- (41) Piotto, G. 2008, in “Dynamical Evolution of Dense Stellar Systems, IAU Symp. Vol. 246, p. 141
- (42) Platais, I., Girard, T. M., Kozhurina-Platais, V., van Altena, W. F., López, C. E., Méndez, R., Ma, W.-S., Yang, T,-G., MacGillivray, H. T., & Yentis, D. J. 1998, AJ, 116, 2556
- (43) Renzini, A. 2008, MNRAS, 391, 354
- (44) Rich, R. M., Sosin, C., Djorgovski, S. G., Piotto, G., King, I. R., Renzini, A., Phinney, E. S., Dorman, B., Liebert, J., & Meylan, G. 1009, ApJ, 484, L25
- (45) Smith, M. C, Evans, N. W., Belokurov, V., Hewett, P. C., Bramich, D. M., Gilmore, G., Irwin, M. J., Vidrih, S., & Zucker, D. B. 2009, MNRAS, 399, 1223
- (46) Valenti, E., Ferraro, F.R., & Origlia, L. 2007, AJ, 133, 1287
- (47) Yoon, S.-J., Joo, S.-J, Ree, C. H., Han, S.-I., Kim, D.-G., & Lee, Y.-W. 2008, ApJ, 677, 1080
- (48) Zacharias, N. et al. 2000, AJ, 120, 2131
- (49) Zoccali, M. 2009, in “Chemical Abundances in the Universe: Connecting First Stars to Planets”, IAU Symp. No. 265, p. 119
| SPM | R.A. | Dec. | l | b | Photographic Plates | SPM CCDa | Otherb |
| (B1950) | () | Pairs Epoch | Epoch | (% area) | |||
| 578 | 255 | -25 | 357.9 | 10.0 | 2(BY) 1967.45, 1969.36 | 23 | |
| 651 | 260 | -20 | 4.7 | 9.1 | 1(BY) 1973.50 | 1 | |
| 307 | 264 | -45 | 345.6 | -7.4 | 2(BY) 1968.41, 1969.63 | 4 | |
| 436 | 265 | -35 | 354.6 | -2.8 | 2(BY) 1967.36, 1989.42 | 0 | |
| Number of frames taken by the main survey () and on clusters (). | |||||||
| 2nd epoch positions from HIPPARCOS, TYCHO2, UCAC2, or 2MASS. | |||||||
| SPM | (H-SPM) | (H-SPM) | Nc | Clusters |
| (mas yr-1) | (mas yr-1) | |||
| 578 | -2.54(0.33) | -4.95(0.36) | 92 | NGC 6273, 6284, 6287, 6293 |
| 651 | -1.46(0.43) | -4.26(0.33) | 84 | NGC 6333, 6342, 6356 |
| 307 | -1.08(0.30) | -5.02(0.38) | 152 | NGC 6388 |
| 436 | -1.07(0.25) | -3.04(0.40) | 56 - 101 | NGC 6441 |
| for SPM field 436, we show the range of stars used for all image orders | ||||
| and plate-pair solutions. | ||||
| NGC | Method | ||||
|---|---|---|---|---|---|
| (mas yr-1) | (mas yr-1) | ||||
| 6273/M 19 | -0.33(0.36) | 4.50(0.36) | 13.0 | 301 | 2G fit |
| 6284 | -1.13(0.55) | -0.44(0.75) | 12.0 | 39 | pplot |
| 6287 | -1.15(0.82) | 1.41(0.59) | 12.0 | 52 | pplot |
| 6293 | 2.78(0.78) | -0.19(0.61) | 12.0 | 49 | pplot |
| 6333/M 9 | 0.89(0.37) | 0.56(0.37) | 13.5 | 201 | 2G fit |
| 6342 | -1.31(0.56) | -1.88(0.56) | 13.7 | 296 | 2G fit |
| 6356 | -1.68(0.53) | 0.61(0.41) | 13.2 | 97 | pplot |
| 6388 | 0.18(0.34) | 1.59(0.34) | 13.0 | 240 | 2G fit |
| 6441 | -1.79(0.37) | -0.41(0.65) | 12.0 | 7 | ave |
| NGC | |||||||
|---|---|---|---|---|---|---|---|
| (mas yr-1) | (mas yr-1) | (kpc) | (kpc) | (km s-1) | |||
| 6273 | -2.86(0.49) | -0.45(0.51) | -3.1 | 9.4 | 8.6 | 7.6 | 135.0(4.0) |
| 6284 | -3.66(0.64) | -5.39(0.83) | -1.7 | 9.9 | 15.3 | … | 27.6(1.7) |
| 6287 | -3.68(0.88) | -3.54(0.69) | 0.1 | 11.0 | 9.3 | 7.4 | -288.8(3.5) |
| 6293 | 0.26(0.85) | -5.14(0.71) | -2.4 | 7.8 | 8.8 | 7.8 | -146.2(1.7) |
| 6333 | -0.57(0.57) | -3.70(0.50) | 5.5 | 10.7 | 7.9 | 8.9 | 229.1(7.0) |
| 6342 | -2.77(0.71) | -5.84(0.65) | 4.9 | 9.7 | 8.6 | 7.6 | 116.2(1.6) |
| 6356 | -3.14(0.68) | -3.65(0.53) | 6.7 | 10.2 | 15.2 | … | 27.0(4.3) |
| 6388 | -1.90(0.45) | -3.83(0.51) | -14.4 | -6.7 | 10.0 | … | 81.2(1.2) |
| 6441 | -2.86(0.45) | -3.45(0.76) | -6.5 | -5.0 | 11.7 | … | 16.4(1.2) |
| NGC | [Fe/H] | |||||||||
|---|---|---|---|---|---|---|---|---|---|---|
| (kpc) | (km s-1) | (km s-1) | ||||||||
| 6273 | -1.68 | -9.18 | 1.4 | 0.7 | -125(06) | 134(22) | 110(22) | -5(16) | -183(16) | 42 |
| 6284 | -1.32 | -7.97 | 2.6 | 7.1 | -27(09) | -248(72) | -7(51) | 42(10) | 245(72) | … |
| 6287 | -2.05 | -7.36 | 1.8 | 1.1 | 280(08) | 3(40) | -10(36) | -280(08) | -8(40) | 66 |
| 6293 | -1.92 | -7.77 | 1.2 | 0.8 | 123(05) | 64(36) | -146(36) | -139(17) | -1(32) | 48 |
| 6333 | -1.75 | -7.94 | 1.5 | 0.8 | -257(08) | 122(23) | -9(21) | 26(22) | 283(11) | 48 |
| 6342 | -0.65 | -6.44 | 1.5 | 0.8 | -153(06) | -24(39) | -11(28) | 60(33) | 143(21) | 48 |
| 6356 | -0.50 | -8.52 | 2.7 | 7.1 | -69(11) | -114(53) | 56(46) | 38(17) | 128(52) | … |
| 6388 | -0.60 | -9.42 | -1.2 | 3.0 | -35(08) | 11(30) | -23(22) | 11(26) | -35(18) | 180 |
| 6441 | -0.53 | -9.64 | -1.0 | 3.8 | -2(06) | -21(46) | 44(31) | 9(17) | 19(43) | 228 |
| NGC | [Fe/H] | |||||||||
|---|---|---|---|---|---|---|---|---|---|---|
| (kpc) | (km s-1) | (km s-1) | ||||||||
| 6273 | -1.68 | -9.18 | 1.2 | 0.7 | -127(05) | 144(20) | 101(19) | -189(13) | 33(16) | 42 |
| 6287 | -1.32 | -7.36 | 1.4 | 0.7 | 279(07) | 48(32) | -18(28) | 280(07) | 42(32) | 42 |
| 6293 | -1.92 | -7.77 | 1.1 | 0.4 | 125(05) | 83(32) | -131(32) | 20(24) | 148(21) | 24 |
| 6333 | -1.75 | -7.94 | 1.7 | 1.1 | -260(09) | 106(26) | -16(24) | 248(21) | 132(18) | 66 |
| 6342 | -0.65 | -6.44 | 1.3 | 0.8 | -150(06) | 6(34) | -7(25) | -92(26) | 118(22) | 48 |