The origin of peculiar molecular bands in cool DQ white dwarfs
Abstract
Aims. The DQ white dwarfs are stars whose atmosphere is enriched with carbon, which for cool stars () is indicated by the Swan bands of in the optical part of their spectra. With decreasing effective temperature these molecular bands undergo a significant blueshift (). The origin of this phenomenon has been disputed over the last two decades and has remained unknown. We attempt to address this problem by investigating the impact of dense helium on the spectroscopic properties of molecular carbon, the electronic Swan band transition energy and the vibrational frequency , under the physical conditions encountered inside helium-rich, fluid-like atmospheres of cool DQ white dwarfs.
Methods. In our investigation we use a density functional theory based quantum mechanical approach.
Results. The electronic transition energy increases monotonically with the helium density (). This causes the Swan absorption to occur at shorter wavelengths compared with unperturbed . On the other hand the pressure-induced increase in the vibrational frequency is insufficient to account for the observed Swan bands shifts. Our findings are in line with the shape of the distorted molecular bands observed in DQp stars, but the predicted photospheric density required to reproduce these spectral features is one order of magnitude lower than the one predicted by the current models. This indicates pollution by hydrogen or reflects incomplete knowledge of the properties of fluid-like atmospheres of these stars.
Conclusions. Our work shows that at the physical conditions encountered in the fluid-like atmospheres of cool DQ white dwarfs the strong interactions between and helium atoms cause an increase in , which should produce a blueward shift of the Swan bands. This is consistent with the observations and indicates that the observed Swan-like molecular bands are most likely the pressure-shifted bands of
Key Words.:
atomic processes – dense matter – stars: atmospheres – stars: white dwarfs1 Introduction
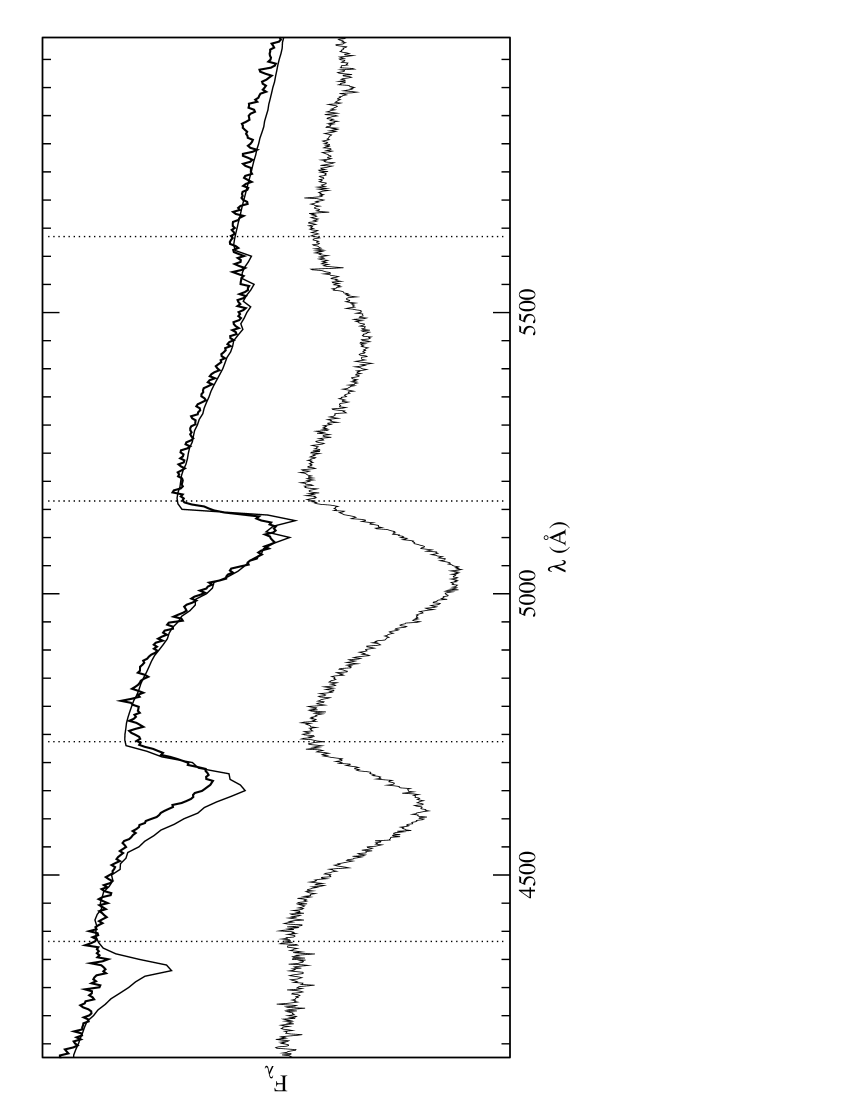
A DQ white dwarf is a star with a helium-dominated atmosphere enriched with carbon, which is believed to be dredged-up from the core by the deep helium convection zone (Pelletier et al.,, 1986). In the cool DQ white dwarfs () carbon shows its presence by the Swan bands in the optical spectrum. The two until now unexplained phenomena are observed in the local samples of these stars. There is a cutoff in their cooling sequence at (Dufour et al.,, 2005; Koester & Knist,, 2008) and an appearance of ”peculiar” DQ stars (following Hall & Maxwell, (2008) we call them DQp white dwarfs) at lower temperatures. These peculiar stars show Swan-like bands that are blueshifted by 100 to 300 (Schmidt et al.,, 1995; Bergeron et al.,, 1997; Hall & Maxwell,, 2008). The representative spectra of normal and peculiar cool DQ stars are given in Fig. 1. In the detailed analysis of DQp stars Schmidt et al., (1995, 1999) and Hall & Maxwell, (2008) doubt the possibility that the shifts of the Swan bands observed in spectra of these stars are solely due to a strong magnetic field, which is not observed to be stronger than in “normal” DQ stars. Observing identical shifts of the bands in all at that time known DQp stars, Schmidt et al., (1995) concluded that a different molecular species could produce the observed bands. Analyzing the abundances of chemical species in the H/He/C mixture under the physical conditions found in the atmospheres of helium-rich stars, they proposed the molecule as a source of the optical spectral features in the DQp stars. The idea that hydrogen is responsible for the spectra of DQp stars is consistent with two findings regarding the chemical evolution of cool white dwarf atmospheres. The already mentioned observation of DQDQp transition indicates some sort of transformation of the physical or chemical properties of the atmospheres of these stars. Also the analyses of the local populations of white dwarfs by improved atmosphere models, which account for physics and chemistry of dense media, show the decrease in number of the helium-rich atmosphere stars with (Bergeron et al.,, 1997, 2001; Kowalski & Saumon,, 2006) and the appearance of white dwarfs with atmospheres highly enriched in hydrogen (Kowalski & Saumon,, 2006; Kilic et al.,, 2008; Kilic et al., 2009a, ; Kilic et al., 2009b, ). Subsequent work on the coolest stars indicates that the stars at the end of the white dwarf cooling sequence posses pure hydrogen atmospheres (Hall et al.,, 2008; Kilic et al.,, 2010). Both these findings indicate that the accretion of hydrogen from the interstellar medium may change the composition of a helium-dominated atmosphere into a hydrogen-rich one, and shows that the appearance of DQp stars may be somehow connected to this process. However, in the recent work of Hall & Maxwell, (2008) the authors ruled out the possibility that molecule or other carbon and hydrogen bearing species are responsible for the absorption in the optical spectra of DQp stars and concluded that itself is a reasonable candidate for producing the observed features. This claim is supported by matching of the long-wavelength edges of the observed bands in DQ and DQp stars, as indicated in Fig. 1. Hall & Maxwell, (2008) postulate that the Swan bands distortion could be produced by the high pressure or the high excitation of the rotational states of . This claim is however purely speculative and is not based on strong theoretical or experimental evidence.
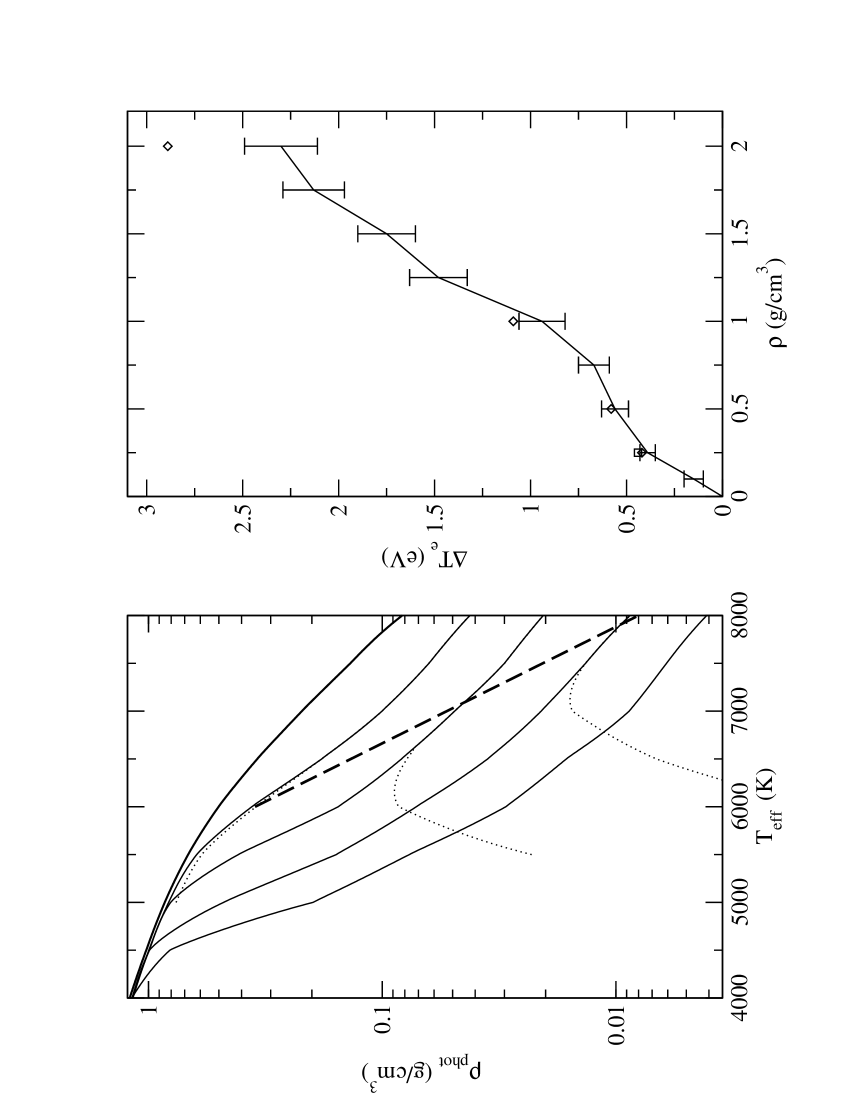
The majority of DQ star atmospheres are highly depleted with hydrogen, and the dominant constituent species is helium. With cooling, an atmosphere of a helium white dwarf becomes more charge-neutral, less opaque and more dense at the photosphere. Also the amount of carbon, which significantly contributes to the opacity by delivering free electrons, diminishes with the effective temperature (Dufour et al., (2005); Koester & Knist, (2008)), causing an increase in the photospheric density. The photospheric densities as a function of effective temperature for DQ white dwarfs with representative amounts of carbon are given in Fig. 2. The atmospheres of these cool stars () posses extreme densities (as high as few ) and represent a dense fluid, in which strong inter-particle interactions affect the chemistry and physics (Bergeron et al.,, 1995; Kowalski & Saumon,, 2004; Kowalski,, 2006; Kowalski et al.,, 2007). Plotting the photospheric densities of a DQ star cooling sequence in Fig. 2, which is based on the carbon abundances derived by Dufour et al., (2005), we see that the atmospheres of DQ stars reach fluid-like densities and therefore high pressures at the temperatures of the observed DQDQp transition. This suggests the pressure effects as a good candidate to be responsible for the spectral distortions observed in DQp stars.
In order to understand the origin of the spectral features observed in DQp stars, we investigate the impact of dense helium fluid on the spectroscopically important properties of molecule. We performed ab initio calculations of in dense helium, looking for changes in quantities that shape the optical spectrum of , the electronic transition energy , and the vibrational frequency .
2 Computational approach
The most widely used method for the quantum mechanical treatment of dense, extended many-particle systems is the density functional theory (DFT, Koch & Holthausen, (2000)). Over the last decade DFT methods proved to be very useful in calculations of various chemical and physical properties of atoms, molecules, solid states and matter under high compression. In our work we used one of the most common DFT version, the generalized gradient approximation (GGA) with PBE exchange-correlation functional (Perdew,, 1996). The calculations were performed by the plane-wave DFT ABINIT code (Gonze et al.,, 2002) with the ultra-soft pseudopotentials (Vanderbilt,, 1990) (PAW method and the energy cutoff of ). In order to obtain the distributions of helium atoms around we derived the interaction potential using a combined DFT, molecular dynamics, and classical theory of fluids approach. First we performed Car-Parrinello simulations (Car & Parrinello,, 1985) of emerged in dense helium at density of and the temperature of (equiv. of ). The periodically repeated simulation box contained one molecule and 64 He atoms. As the ABINIT code is not well suited for these calculations, they were performed with the CPMD code (Car & Parrinello,, 1985; Marx & Hutter,, 2000), keeping the same psuedopotentials, DFT functional and energy cutoff. We checked that using the same computational setups both DFT codes give the same answers for the total energies (within ). A trajectory of one million configurations was generated ( long). The interaction potential was derived by solving the Ornstein-Zernike equation in the Percus-Yevick approximation (Martynov,, 1992), taking as input the pair-distribution function obtained from the simulation. In order to calculate the energies of in dense helium in and states, which constitute the Swan band transition, for a given and we calculated the ground state energies of a set of ionic configurations obtained from the classical Monte Carlo simulations of helium fluid with one molecule, performed using Allen & Tildesley, (1987) Monte Carlo code with the derived interaction potential and interaction of Ross & Young, (1986). We used this approach because an explicit quantum molecular dynamics (QMD) simulations would be computationally much more demanding, and be undoable for extended systems with hundreds of atoms. The relevant and states are constructed according to the electronic configurations given by Ballik & Ramsay, (1963). The symmetries of the five lowest KS orbitals of molecule are: ,,,,, in agreement with Ballik & Ramsay, (1963). The lower state () is obtained by fixing the occupation of spin-up orbitals as 11100 and spin-down 11111. The upper state () is obtained by fixing the occupation of spin-up orbitals as 10101 and spin-down 11111. Then the Swan Band electronic transition energy is given as the difference of these two calculations. The obtained equilibrium separations for these two states, , and the electronic transition energy agree well with the experimental values (, and respectively, Ballik & Ramsay, (1963)), which justifies the usage of DFT.
The impact of dense helium on the vibrational frequencies of was investigated by computing the vibrational density of states by the Fourier transform of the velocity autocorrelation function (Egelstaff,, 1994) derived from the velocities obtained from Car-Parrinello molecular dynamic runs for selected densities and in a ground state.
In order to compute the atmosphere models we used our own stellar atmosphere code that accounts for various dense medium effects such as refraction, the non-ideal equation of state, and chemical equilibrium. The internal partition functions of carbon molecule is that of Irwin, (1981). For the carbon atom and ion we set the values. This approximation is justified because the electronic excitation energies of both carbon species are high, and for temperatures of a few thousand degrees the populations of the electronic excited levels are extremely small. Hydrocarbon species are not considered.
3 Results and discussion
It is well known that in helium fluid the interaction energies at the considered densities can be significant and may reach values of (for instance the internal energy of atoms in dense helium is 0.5 eV/atom at and ). The interaction energy should in principle be higher for the species in the higher excited states, because their electronic charge is located farther away from the center of the atom/molecule. This should lead to an increase in an electronic transition energy. We computed the electronic transition energy of the Swan transition in that emerged in dense He at different densities and representative for the atmospheres of DQp stars temperature . The obtained shift in the electronic transition energy, is given in Fig. 2. With the increase in the density of helium, increases and the increase for densities up to is linear and given by . This increase shows the smaller slope at densities between 0.5 and and a similar increase at higher densities. The increase in the electronic transition energy should produce a blueshift in the Swan band spectrum, which is qualitatively consistent with the shifts observed for DQp stars. Positions of the band minima in the spectra of DQp stars imply a shift of . This indicates that the bands form at a density of , which is one order of magnitude smaller than the predicted photospheric densities in the models of these stars (, Fig. 2).
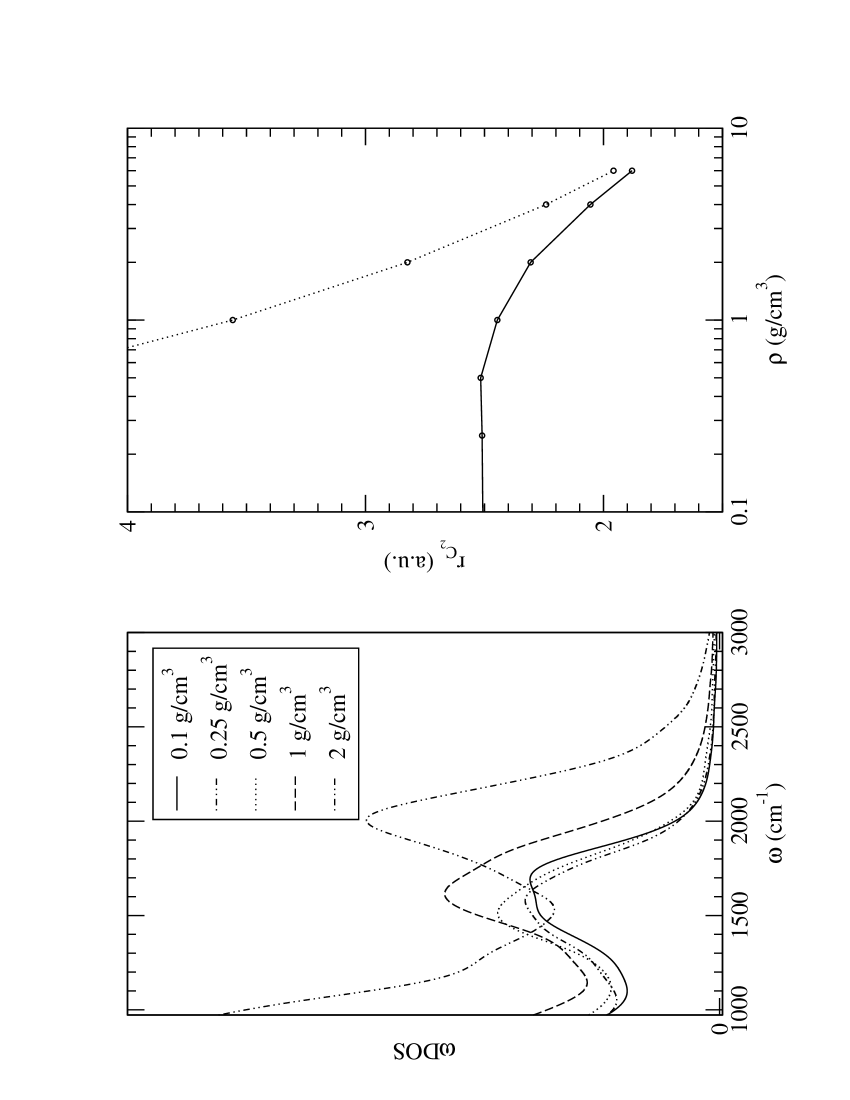
On the other hand the change in the vibrational frequency is prominent, but appears at significantly higher densities. The result in terms of the vibrational density of states of in state is given in Fig. 3. The vibrational frequency is barely affected up to a density of and shifts toward higher frequencies at higher densities. This can be explained looking at the impact of compression on the mean inter-atomic separation in . In Fig. 3 we present the variation of this value as a function of density together with the mean inter-particle separation in the fluid helium. The distance between carbon atoms that constitute the molecule remains unaffected up to a density of , and decreases slowly at higher densities. The decrease is correlated with the mean inter-particle distance in fluid helium. The weak density-dependence of the inter-particle distance in (for considered densities) justifies the usage of fixed inter-particle distance in the molecule in the calculations of . We also notice that to reproduce the observed shifts by the increase in the vibrational frequency, the difference in this increase should be at least (), which could occur at densities higher than . Potential rotational excitation, as proposed by Hall & Maxwell, (2008) for the reason of the shifts, is difficult to explain, because this is a temperature effect and should be stronger at higher temperatures, which is opposite to the temperature trend of the DQDQp transition. Therefore, we conclude that the dynamical motion of carbon atoms is unlikely to be responsible for the distortion of Swan bands. Our results show that the distortion of the bands in DQp stars is caused by the pressure-induced increase in .
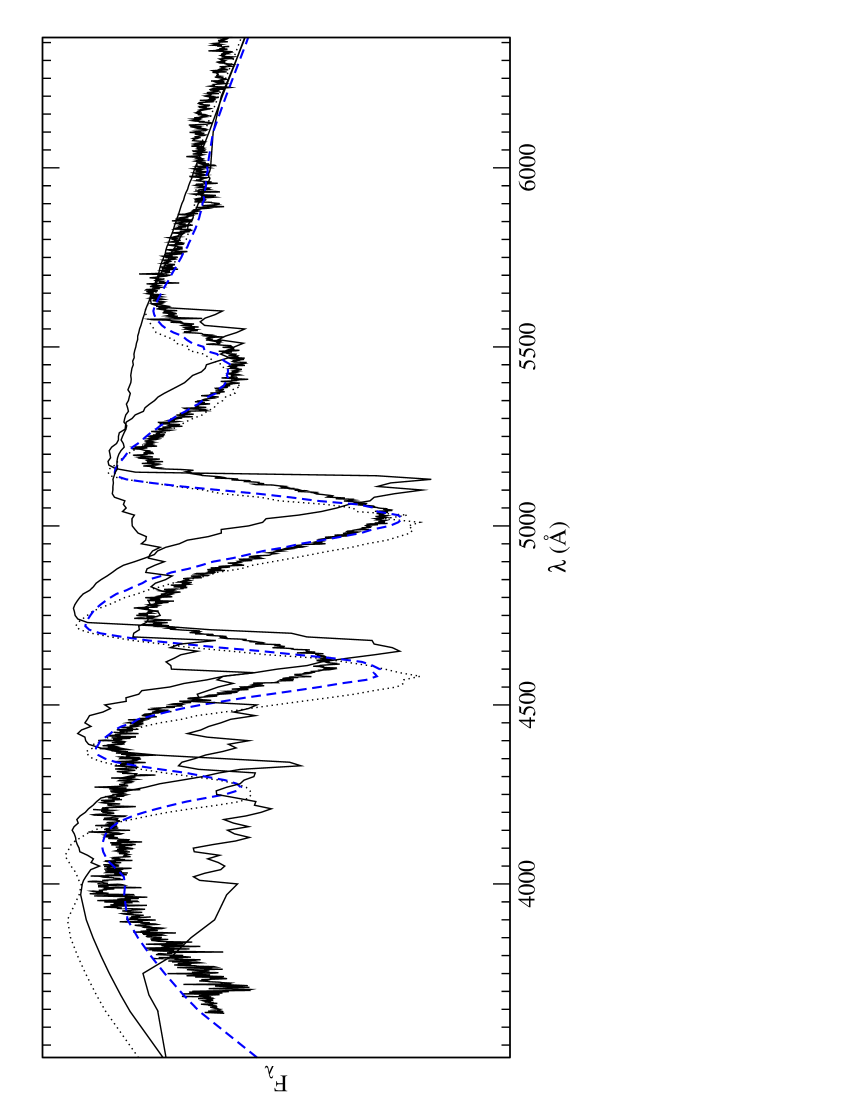
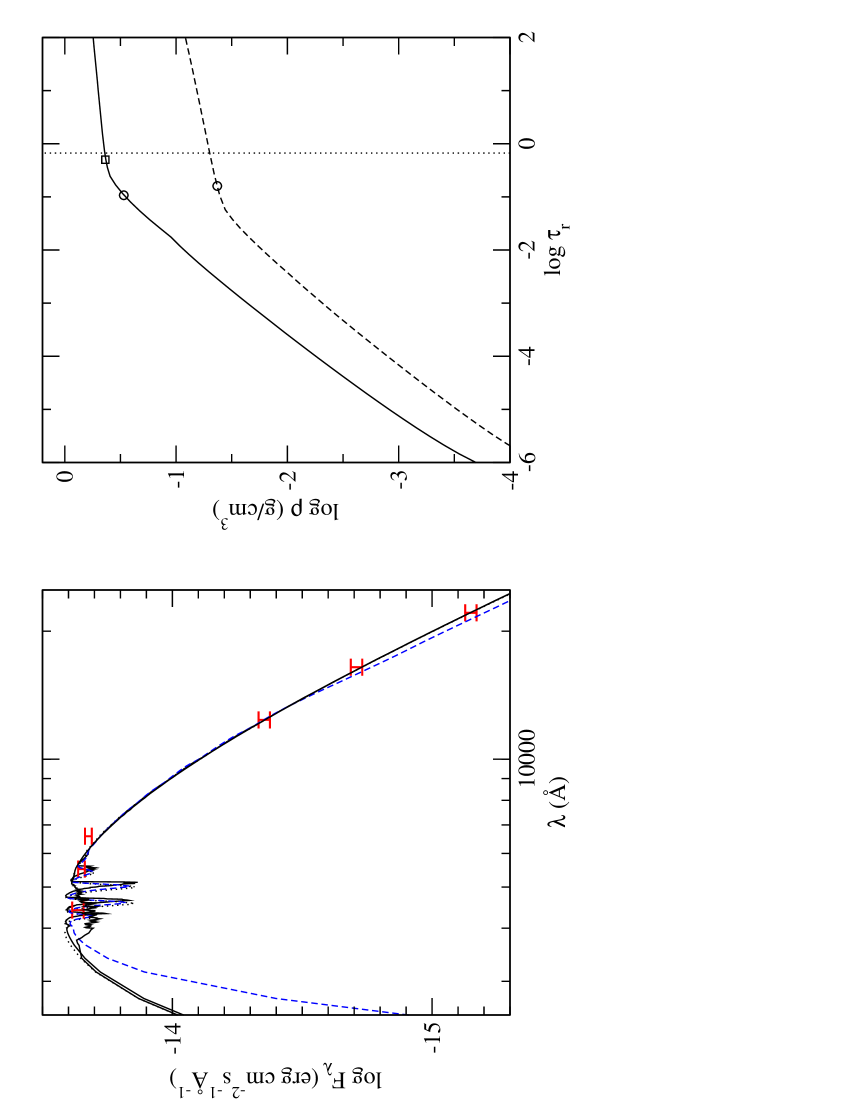
After computing the shifts in the electronic transition energy for the Swan band transition we attempted to reproduce the spectrum of a DQp star. We did this by using the standard Swan band spectrum, shifted at a given atmospheric level by the derived value of . We note that although this is a quantitatively meaningful approximation, its validation would require the modeling of the absorption by in dense helium, which is a complex task, restricted by the limited applicability of quantum methods beyond DFT to many particle systems. In Fig. 4 we show the optical spectrum of the cool DQp white dwarf LHS290 (Bergeron et al.,, 1997) together with a set of synthetic spectra. The overall spectral energy distribution of that star is best reproduced by models with (Fig. 5), and we assume this temperature in our analysis and fix the gravity at . The C/He and H/He abundances are fitted to best reproduce the peaks of the bands. Assuming pure He atmosphere the strength of the Swan bands is reproduced with , but with the computed correction for the spectrum is far too distorted111We note that it resembles the spectrum observed for a star G240-72 in Bergeron et al., (1997), Fig. 30, which opens the possibility that this star (, Bergeron et al., (1997)) is not only magnetic, but also shows the extremely pressure-shifted Swan bands.. The observed spectrum can be fairly well reproduced by a model with photospheric density , or assuming that the dependence on the density is weaker, . The first case is realized by the addition of hydrogen to the atmosphere, which increases the opacity and lowers the photospheric density. The required amount of hydrogen is . In both cases the observed spectrum is fairly well reproduced. The minima of the bands are blueshifted, as most of the absorption occurs close to the photosphere (Fig. 5). The long-wavelength parts of the bands resemble those of the standard Swan absorption, because part of the absorption occurs in the less dense upper atmospheric layers, where is unperturbed. We notice that the abundances of molecular carbon and the resulting strength of its molecular bands could also be affected by high density, which could eventually impact the reported carbon abundances.
4 Conclusions
The so-called DQp stars represent a puzzle in the understanding of evolution of cool, helium-dominated white dwarf atmospheres. The DQ stars disappear at , and few stars with apparently distorted Swan bands were detected at lower effective temperatures. All explanation through the formation of different species, like , magnetic fields, or roto-vibrational excitations failed to explain the spectral features of these stars or definitely assign them as the distorted bands of . We show that the distortion of Swan bands originates in the pressure-induced increase in the electronic transition energy between states involved in the transition. This results in a blueshift of the molecular bands minima, and explains why the red edges of the bands match the spectra of normal DQ stars (Swan bands). Our results, when applied to the current atmosphere models, predict Swan bands shifts that are too large compared with the observed ones. This indicates that the density at the photosphere of DQp stars does not excess , and the input physics in the models or the understanding of the atmospheres of these stars, especially the pollution by hydrogen, requires further improvements.
Acknowledgements.
I thank Sandy Leggett for providing me with the spectra of DQ and DQp stars, Didier Saumon for comments on the manuscript, the referee Patrick Dufour for constractive comments, suggestions and sharing the details of his DQ white dwarf atmosphere models, and Richard Freedman for providing opacities.References
- Allen & Tildesley, (1987) Allen, M. P., & Tildesley, D., Computer simulation of liquids, (Clarendon Press, Oxford, 1987)
- Ballik & Ramsay, (1963) Ballik, E. A., & Ramsay, D. A. 1963, ApJ, 137, 84
- Bergeron et al., (1995) Bergeron, P., Saumon, D., & Wesemael, F. 1995, ApJ, 443, 764
- Bergeron et al., (1997) Bergeron, P., Ruiz, M. T., & Leggett, S. K. 1997, ApJ, 108, 339
- Bergeron et al., (2001) Bergeron, P., Leggett, S. K., & Ruiz, M. T. 2001, ApJSuppl., 133, 413
- Car & Parrinello, (1985) Car, R., & Parrinello, M. 1985, Phys. Rev. Lett. 55, 2471
- Dufour et al., (2005) Dufour, P., Bergeron, P., & Fontaine, G. 2005, ApJ, 627, 404
- Egelstaff, (1994) Egelstaff, P. A. An Introduction to the Liquid State, (Clarendon Press, Oxford, 1994) , Chap. 12
- Gonze et al., (2002) Gonze, X. et al. 2002, Computational Materials Science 25, 478; Gonze, X. et al., 2005, Zeit. Kristallogr., 220, 55; www.abinit.org (2010)
- Hall & Maxwell, (2008) Hall, P. B., & Maxwell, A. J. 2008, ApJ, 678, 1292
- Hall et al., (2008) Hall, P. B. et al. 2008, AJ, 136, 76
- Irwin, (1981) Irwin, A. W. 1981, ApJS, 45, 621
- Kilic et al., (2008) Kilic, M., Kowalski, P. M., Mullally, F., Reach, W. T., & von Hippel, T. 2008, ApJ, 678, 1298
- (14) Kilic, M., Kowalski, P. M., & von Hippel, T. 2009, AJ, 138, 102
- (15) Kilic, M., Kowalski, P. M., Reach, W. T., & von Hippel, T. 2009, ApJ, 696, 2094
- Kilic et al., (2010) Kilic, M. et al. 2010 ApJ, 715, L21
- Koch & Holthausen, (2000) Koch, W., & Holthausen, M. C. A chemist’s guide to density functional theory, (Wiley-VCH, Weinheim, 2000)
- Koester & Knist, (2008) Koester, D., & Knist, S. 2006, A&A, 454, 951
- Kowalski, (2006) Kowalski, P. M. 2006, ApJ, 641, 488
- Kowalski & Saumon, (2006) Kowalski, P. M., & Saumon, D. 2006, ApJ, 651, L137
- Kowalski & Saumon, (2004) Kowalski, P. M., & Saumon, D. 2004, ApJ, 607, 970
- Kowalski et al., (2007) Kowalski, P. M., Mazevet, S., Saumon, D., & Challacombe, M. 2007, Phys. Rev. B, 76, 075112
- Martynov, (1992) Martynov, G. A. 1992, Fundamental theory of liquids (Bristol: Adam Hilger), Chap. 5, 6 and 10
- Marx & Hutter, (2000) Marx, D., & Hutter, J. in: Modern Methods and Algorithms of Quantum Chemistry, edited by J. Grotendorst, NIC, FZ Jülich, p. 301 (2000); www.cpmd.org
- Pelletier et al., (1986) Pelletier, C., Fontaine, G., Wesemael, F., Michaud, G., & Wegner, G. 1986, ApJ, 307, 242
- Perdew, (1996) Perdew, J. P., Burke, K., & Ernzerhof, M. 1996, Phys. Rev. Lett., 77, 3865; Erratum: 1997, Phys. Rev. Lett. 78, 1396.
- Ross & Young, (1986) Ross, M., & Young, D. A. 1986, Phys. Lett. A, 118, 463
- Schmidt et al., (1995) Schmidt, G. D., Bergeron, P., & Fegley, B. 1995, ApJ, 443, 274
- Schmidt et al., (1999) Schmidt, G. D., Liebert, J., Harris, H. C., Dahn, C. C., & Leggett, S. K. 1999, ApJ, 512, 916
- Vanderbilt, (1990) Vanderbilt, D. 1990, Phys. Rev. B 41, 7892.