11email: bergeron@iap.fr 22institutetext: Canadian Institute for Theoretical Astrophysics, University of Toronto, 60 St. George Street, Toronto, Ontario, M55 3H8, Canada
Incidence of Mg ii absorbers towards Blazars
and the GRB/QSO puzzle††thanks: Based on observations collected at the European Southern Observatory, ESO, the VLT/Kueyen telescope, Paranal, Chile, in the framework of programs 080.A-0276 and 081.A-0193.
In order to investigate the origin of the excess of strong Mg ii systems towards GRB afterglows as compared to QSO sightlines, we have measured the incidence of Mg ii absorbers towards a third class of objects: the Blazars. This class includes the BL Lac object population for which a tentative excess of Mg ii systems had already been reported. We observed with FORS1 at the ESO-VLT 42 Blazars with an emission redshift , to which we added the three high northern objects belonging to the 1Jy BL Lac sample. We detect 32 Mg ii absorbers in the redshift range 0.35-1.45, leading to an excess in the incidence of Mg ii absorbers compared to that measured towards QSOs by a factor , detected at 3. The amplitude of the effect is similar to that found along GRB sightlines. Our analysis provides a new piece of evidence that the observed incidence of Mg ii absorbers might depend on the type of background source. In front of Blazars, the excess is apparent for both ’strong’ ((2796) Å) and weaker ((2796) Å) Mg ii systems. The dependence on velocity separation with respect to the background Blazars indicates, at the level, a potential excess for . We show that biases involving dust extinction or gravitational amplification are not likely to notably affect the incidence of Mg ii systems towards Blazars. Finally we discuss the physical conditions required for these absorbers to be gas entrained by the powerful Blazar jets. More realistic numerical modelling of jet-ambient gas interaction is required to reach any firm conclusions as well as repeat observations at high spectral resolution of strong Mg ii absorbers towards Blazars in both high and low states.
Key Words.:
BL Lacertae objects: general – quasars: absorption lines1 Introduction
In the 1980’s, the observation of large QSO samples allowed Young et al. (young (1982)) and a decade later Steidel & Sargent (steidel (1992)) to establish that C iv and Mg ii absorption systems arise in intervening material, randomly distributed along the QSO sightlines. This conclusion was based on two main arguments: i) the number of systems detected in individual sightlines is Poissonian; ii) the distribution of systems with respect to comoving coordinates is uniform. Their Mg ii sample did not reveal any cosmological evolution.
To firmly establish the nature of the lower redshift Mg ii absorption systems, searches for galaxies associated with these absorptions have been conducted since the late 1980’s. For Mg ii systems at , results of these identification surveys revealed that normal field galaxies with luminosities are all potentially Mg ii absorbers, and the mean extent of their gaseous halos is 65 kpc, assuming km s-1 Mpc-1 (Bergeron & Boissé bergeron91 (1991); Steidel et al. steidel94 (1994); Steidel steidel95 (1995)). The conclusion of these searches was that in studying Mg ii systems, we get information on the cosmic history of normal field galaxies (metallicity, dust content, dynamics, star formation).
Our current understanding of absorption line systems thus implicitly assumes that their properties do not depend on the nature of the background sources used as probes (except at ). However, Prochter et al. (2006a ) recently reported an excess of strong (rest equivalent width (Mg ii2796) Å) Mg ii absorbers towards gamma-ray bursts (GRBs) with respect to the incidence measured in QSO spectra. These authors found that nearly every GRB sightline exhibits at least one absorber () whereas the incidence of strong Mg ii QSO absorbers is about four times smaller. This excess is confirmed by Sudilovsky et al. (sudilovsky (2007)) for a small, homogeneous sample of GRB VLT-UVES high-resolution spectra, and more recently by Tejos et al. (tejos09 (2009)) and Vergani et al. (vergani (2009)). Based on their improved statistics, these latter authors find the excess to be smaller than initially reported, by a factor of instead of 4. There is no such excess for the higher redshift C iv absorbers (small overlapping samples of Sudilovsky et al. sudilovsky (2007) and Tejos et al. tejos07 (2007)), which trace more diffuse and hotter gas than Mg ii, have larger cross-sections and, therefore, largely probe a different population than strong Mg ii absorbers.
Studies of systems towards GRBs naturally focused on the strongest systems, the only ones that could be easily detected and thus for which homogeneous results could be obtained (since they fade away rapidly, GRB afterglows are generally faint when observed at good spectral resolution). Initially, the incidence of strong Mg ii systems in QSO spectra was poorly known because their number density rapidly decreases with increasing (Mg ii) (e.g. Steidel & Sargent steidel (1992)), and only the SDSS data releases provided a robust measurement to be used for the purpose of comparison with the GRB results. As time elapsed, the number of afterglows observed at a resolution and signal-to-noise ratio (S/N) sufficient to detect weaker systems increased, allowing Vergani et al. (vergani (2009)) to measure the incidence of Mg ii systems with (Mg ii2796) Å and to show that the latter do not display an excess towards GRBs as compared to QSOs. Thus the GRB excess is only significant for strong Mg ii systems.
Several physical effects have been proposed to explain the GRB-QSO absorber discrepancy: 1) obscuration by dust of background QSOs, 2) intrinsic nature of the GRB absorbing gas, 3) gravitational lensing of GRBs by Mg ii absorbers, 4) absorbers with small cores of a similar size as GRB and QSO beam sizes (Prochter et al. 2006a ; Frank et al. frank (2007); Hao et al. hao (2007)).
In their study, Prochter et al. (2006a ) mention a possible excess of the same kind for strong Mg ii systems towards BL Lac objects, as inferred by Stocke & Rector (stocke (1997)). BL Lac objects can be of great interest in our context because these targets are mainly radio-selected and thus should not suffer from any extinction bias. Furthermore, the timescale and amplitude of their optical variations is intermediate as compared to those of QSOs and GRBs. Finally, relativistic boosting is thought to be present in BL Lac objects, as in GRBs.
Since the result obtained by Stocke & Rector was based on relatively few BL Lac spectra, not all with good S/N, and thus of poor statistical significance, we have undertaken an observational programme devoted to the measurement of towards Blazars for strong and weak Mg ii systems. Indeed BL Lacs belong to the broader Blazar class characterized by violent variability, a compact flat-spectrum radio source, and a smooth optical-near infrared continuum. Since the available data on absorption systems in BL Lac objects with the appropriate resolution and S/N has been limited so far, our survey can also provide valuable results on systems with an intrinsic nature, to be compared with the detailed information provided by the SDSS data on associated systems in QSO spectra. One might expect for instance differences related to the nature of the host galaxies or to the presence of interstellar gas entrained by the jet.
The paper is organised as follows. In Sect. 2, we describe how targets were selected. We present the observations and raw results in Sect. 3. Results on the incidence of intervening and associated Mg ii systems are given in Sect. 4. In Sect. 5, we compare our results with those obtained for GRBs and QSOs and investigate possible interpretations of the excess of Mg ii Blazar absorption systems. We give our summary in Sect. 6.
| target | class | coordinates | grism | ||
| common name | 2000 | min | |||
| PKS 0057338 | BL | 010009.0333730 | 0.875 | B600 | 120/3 |
| PKS 0208512 γ | BL | 021046.2510101 | 1.003 | B600 | 80/2 |
| PKS 0215015PGγC | BL | 021748.9014449 | 1.715 | V600 | 60/2 |
| 2QZ | opt | 023405.5301519 | 1.690 | V600 | 80/2 |
| PKS 0235164RSγC | BL | 023838.9163659 | 0.940 | B600 | 60/3 |
| SDSS | opt | 024156.4004351 | 0.989 | B600 | 120/3 |
| PKS 0256075 | BL | 025927.0074739 | 0.893 | B600 | 80/2 |
| PKS 0332403 γ | BL | 033413.6400825 | 1.351N | V600 | 115/3 |
| PKS 0420014 γC | FS | 042315.8012033 | 0.915 | B600 | 80/3 |
| PKS 0426380RSγ | BL | 042840.4375619 | 1.110 | B600 | 80/2 |
| PKS 0454234 γC | BL | 045703.1232452 | 1.003 | B600 | 90/3 |
| PKS 0537441RSγC | BL | 053850.3440508 | 0.890 | B600 | 20/4 |
| PKS 0743006 | FS | 074554.0004417 | 0.994 | B600 | 100/3 |
| PKS 0808019PGC | BL | 081126.7014652 | 1.145 | B600 | 80/2 |
| PKS 0823223PGγ | BL | 082601.5223027 | 0.910a | B600 | 20/2 |
| PKS 0906015 | FS | 090910.1012135 | 1.022 | B600 | 25/1 |
| SDSS | BL | 094257.8004705 | 1.362 | V600 | 80/2 |
| B600 | 40/1 | ||||
| SDSSPl | BL | 094827.0083940 | 1.489 | V600 | 80/2 |
| SDSS | BL | 100959.6014533 | 1.085a | V600 | 120/3 |
| PKS 1008013 | BL | 101115.6010642 | 1.275N | V600 | 80/2 |
| PKS 1130008 | BL | 113245.6003427 | 1.234 | V600 | 60/2 |
| PKS 1144379RSγ | BL | 114701.3381211 | 1.049 | B600 | 40/2 |
| SDSS | BL | 124533.7022825 | 1.096a | B600 | 80/2 |
| V600 | 80/2 | ||||
| PKS 1250330PG | BL | 125258.3331959 | 0.856 | B600 | 120/3 |
| FIRSTPl | BL | 133859.0115316 | 1.589b | V600 | 80/2 |
| PKS 1406076 γC | FS | 140856.4075226 | 1.500 | V600 | 80/2 |
| PKS 1407022PG | BL | 141004.6020306 | 1.253N | V600 | 80/2 |
| SDSS | BL | 141927.4044513 | 1.684a | V600 | 80/2 |
| R600 | 30/1 | ||||
| PKS 1424418 γ | FS | 142756.2420619 | 1.522 | V600 | 57/2 |
| PKS 1519273RS | BL | 152237.6273010 | 1.294 | V600 | 115/3 |
| SDSS | BL | 154515.7003235 | 1.051 | V600 | 80/2 |
| PKS 1741038 γC | FS | 174358.8035004 | 1.054 | B600 | 80/2 |
| PKS 1953325 | FS | 195659.4322546 | 1.242 | V600 | 120/3 |
| PKS 2012017PG | BL | 201515.1013732 | 0.940c | B600 | 80/2 |
| PKS 2029121RS | BL | 203155.0121941 | 1.215 | V600 | 80/2 |
| PKS 2131021RSC | BL | 213410.3015317 | 1.285 | V600 | 80/2 |
| MH 2133449PG | BL | 213618.3444348 | 0.980c | B600 | 120/3 |
| EQ 2207.3004PG | BL | 220719.7004157 | 1.892 | V600 | 80/2 |
| 2QZ | opt | 221450.1293225 | 1.636 | V600 | 80/2 |
| PKS 2223114PG | BL | 222543.7111341 | 0.997 | V600 | 80/2 |
| PKS 2223052C | BL | 222547.2045701 | 1.404 | V600 | 80/2 |
| PKS 2308109 | BL | 231116.9103849 | 1.529 | V600 | 80/2 |
| B2 021835RSγ | BL | 022105.4355615 | 0.944 | N/A | N/A |
| S5 0454844RS | BL | 050842.4843204 | 1.340 | N/A | N/A |
| B2 130832RSγC | BL | 131028.7322044 | 0.997 | N/A | N/A |
| class - BL: BL Lac object, opt: optical BL Lac candidate, FS: Flat | |||||
| Spectrum Radio QSO (FSRQ). | |||||
| Number of exposures. | |||||
| RS In the 1 Jy sample of Rector & Stocke (2001). | |||||
| PG In the BL Lac sample of Padovani & Giommi (1995) and not in RS. | |||||
| Pl In the BL Lac list kindly provided by R. Plotkin prior to publication. | |||||
| γ Gamma-ray emitter. | |||||
| C Superluminal motions. | |||||
| N New emission redshift. | |||||
| a Upper limit derived from Mg ii absorption. | |||||
| b Upper limit derived from C iv absorption. | |||||
| c Upper limit derived from lack of Ca ii absorption from the host | |||||
| galaxy. | |||||
2 The sample
We aim at measuring for Mg ii intervening absorption systems towards BL Lac objects with both strong and weak rest equivalent width, in order to check whether the excess, if real, depends on the strength of the Mg ii absorption doublet. This is not an easy task for several reasons. First, our project requires targets with known emission redshifts to properly estimate the redshift interval probed. Second, BL Lacs and more generally Blazars exhibit large, unpredictible magnitude fluctuations, making it difficult to obtain a homogeneous data set. As in previous studies, we shall consider for our statistical analyses that systems with a relative velocity km s-1 from the source are of intervening nature while the others are considered as associated.
2.1 Target selection
Since, at low redshift (), there is a strong cosmic evolution of the number density of QSO Mg ii absorbers with (Mg ii2796) Å (Nestor et al. nestor (2005); Prochter et al. 2006b ), we selected targets with an emission redshift to optimize the efficiency of our spectroscopic observations. This also yields a redshift range comparable to that investigated for GRBs by Prochter et al. (2006a ). We restricted further the redshift range to due to the paucity and faintness of Blazars at higher redshift.
Our sample comprises the seven 1 Jy BL Lacs of Rector & Stocke (rector (2001)) at and DEC to: 1) confirm the strength of the Mg ii absorption lines for spectra of low S/N, 2) detect weaker Mg ii, 3) complement the available information on emission redshifts. The same selection criteria were applied to the BL Lac sample of Padovani & Giommi (padovani95 (1995)) (nine additional targets). We have taken into account recent emission redshift measurements, including upper limits (Sbarufatti et al. sbarufatti5 (2005) & sbarufatti6 (2006)). The latter are derived from either the Mg ii absorption system of highest redshift or the absence of the Ca ii absorption doublet from the host galaxy in the BL Lac spectrum. We have re-observed almost all the BL Lacs studied by these authors, since the Mg ii absorption doublets are not resolved in their low resolution FORS1 data (FWHM = 15-20 Å with the 300V+I grism).
To increase our sample, we searched for targets, at and DEC , of the Blazar class in the SIMBAD and NED databases. In addition to BL Lacs, the Blazar class also includes Flat Spectrum Radio QSOs (FSRQs) which exhibit broad emission signatures (Angel & Stockman angel (1980)). Blazars are thought to have jets pointing towards us with associated emission beamed by relativistic motions. When in high state, the optical emission can be highly polarized (e.g. Impey & Tapia impey8 (1988) & impey9 (1990)). When in low state, the isotropic thermal emission from the active nucleus and its associated broad emission line region can be detectable or even dominate over the Doppler boosted emission from the jet. The magnitudes given in SIMBAD only reflect the state of the object at a given epoch; nevertheless, we introduced a V magnitude cut of 21.0 to exclude (not always successfully) very faint sources.
This SIMBAD and NED searches provided most of the remaining targets of our sample. It includes optically selected BL Lacs among the 2DF AAT QSO redshift survey and the SDSS (Londish et al. londish (2002) & londish7 (2007); Collinge et al. collinge (2005)). Some of the SDSS BL Lacs have high optical polarization which confirms the synchroton nature of the optical emission (Smith et al. smith (2007)).
Finally, we considered information kindly provided by Plotkin on seven ’southern’ high-redshift BL Lacs prior to publication (Plotkin et al. plotkin (2008)) of their BL Lac sample selected from a combination of the SDSS Data Release 5 (DR5) and the VLA FIRST survey. Only two of them, at , were not already in our SIMBAD/NED list (see Table 1); both were observed. The upper limit on for one of them is derived from a C iv absorption doublet detected in the SDSS spectrum.
The resulting sample comprises 51 sources for our observations with FORS1 scheduled in November 2007 and May 2008. Due to crowding in right ascension (RA) around 11- 12h, we could only observe 42 of them; these were chosen according to their RA and DEC only, disregarding any previously available information on absorption systems. To consistently take into account all the 1 Jy sources of Rector & Stocke (rector (2001)) at , we included the three northern sources which have published, reliable spectroscopic information on the presence or lack of strong Mg ii systems (Miller et al. miller (1978); Stocke & Rector stocke (1997); Cohen et al. cohen (2003)).
Thus, there are 45 sources at in our final sample of which ten BL Lacs from the 1 Jy sources of Rector & Stocke (rector (2001)). Our sample comprises 35 BL Lacs, 7 FSRQs and 3 optical BL Lac candidates. Among the radio-loud Blazars, there are 15 gamma-ray sources, this emission being an important component of the relaticistic jet (Mukherjee et al. mukherjee (1997); Abdo et al. abdo (2009)). Superluminal motions are detected in 11 radio Blazars (Piner et al. piner (2006), piner07 (2007); Fan et al. fan09 (2009)) and, of those, eight are indeed also known gamma-ray emitters. Our 42 observed sources are presented in Table 1 as well as information on the three northern BL Lacs. We now discuss possible biases affecting this sample.
2.2 Potential biases
In order to obtain a reliable measurement of , one must carefully identify potential selection effects that might bias the estimate towards larger (or smaller) values.
One first difficulty is related to the fact that for some sources, no emission lines had been detected or identified at the time of our sample selection and only a lower limit on was provided by a Mg ii system. Including such systems in the statistics would clearly bias towards a too high value since they might in fact be associated instead of intervening. To avoid this bias, we discard these possibly associated Mg ii systems, if our observations do not reveal new emission lines providing a firm source redshift. For these cases, we include in the analysis only the lower redshift part of the sightline (i.e. beyond 5000 km s-1 of the absorption redshift). This is a conservative approach, since some of the ’possibly associated’ Mg ii systems could be intervening. Four of our targets have constrained by a strong Mg ii absorber, and one by a high redshift C iv absorber without associated Mg ii. On the opposite, if our spectrum provides a new firm redshift for the source, all intervening Mg ii systems are included.
A second concern involves sources for which intervening systems were already known to be present. Ideally, one should observe for our programme only sources for which no information at all was available on the presence or absence of absorption systems. Unfortunately, this would severely restrict the number of targets, which is already small. To circumvent this difficulty, we performed our selection exclusively on the basis of emission properties. If those targets with already known systems were excluded, this would bias towards lower values. Although spectra exist for sources like PKS 0235164 and PKS 0215015, we nevertheless reobserved them to obtain either a more complete wavelength coverage or a uniform (Mg ii2796) limit. Further, this offers the opportunity to investigate temporal variations in these systems over a reasonably large time interval, since some of them were initially detected at high S/N about 25 years ago (for PKS 0215015 see Bergeron & D’Odorico bergeron86d (1986); we will present our results on possible variations of Mg ii and Fe ii absorptions in a forthcoming paper).
Finally, given the broad property range of the Blazar class, it remains possible that some targets be in fact QSOs. Since our main purpose is to test whether the number density of strong Mg ii systems is larger towards Blazars, this is however not a real problem because contamination of our sample by QSOs would then lower our estimate.
3 Observations
| target | emission lines | (2796,2803)u | (2586,2600)u | associated absorptions | ||
| Å Å | Å Å | |||||
| 01003337 | 0.875 | C iii],Mg ii | 0.6810 | 0.36,0.36 | nd,nd | – |
| 02170144 | 1.715 | C iii] | 0.7557 | 0.12,0.06 | nd,nd | – |
| 0.9685 | 0.22,0.15 | nd,nd | – | |||
| 1.3439 | 1.92,1.83 | 0.75,1.39 | MgI,Fe ii, Mn ii,Zn ii,Cr ii | |||
| 02343015 | 1.690 | Al iii],C iii] | 1.2361 | 0.11,0.09 | nd,nd | – |
| 02381636 | 0.940 | C iii],Mg ii | 0.5245SR | 2.26,2.12 | 0.89,1.63 | MgI,Fe ii,Mn ii |
| 0.8522SR | 0.43,0.23 | nd,0.09 | Fe ii | |||
| 02410043 | 0.989 | C iii],Mg ii | 0.6310 | 0.27,0.18 | nd,nd | – |
| 0.7753 | 1.06,0.81 | 0.21,0.39 | Fe ii | |||
| 0.9790A | 0.64,0.38 | nd,nd | Al iii | |||
| 03344008 | 1.351N | Mg ii | 1.0791 | 0.20,0.13 | nd,nd | – |
| 1.2083 | 0.84,0.77 | 0.16,0.31 | Fe ii | |||
| 04230120 | 0.915 | C iii],Mg ii | 0.6338 | 0.88,0.70 | 0.05,0.14 | MgI, Fe ii |
| 04283756 | 1.110 | Mg ii | 0.5592 | 0.93,0.72 | 0.19,0.42 | MgI,Fe ii |
| 1.0283SR | 0.56,0.41 | nd,0.08 | Fe ii,Al iii | |||
| 04572324 | 1.003 | Mg ii | 0.8922 | 2.20,1.90 | 1.38,1,87 | MgI,Fe ii, Mn ii,Zn ii,Cr ii,Al iii |
| 05384405 | 0.890 | Mg ii | 0.6725 | 0.065,0.041a | nd,nd | – |
| 07450044 | 0.994 | C iii],Mg ii | 0.7979 | 0.095,0.056 | nd,nd | – |
| 08262230 | 0.910 | – | 0.7057 | 0.11,0.06 | nd,nd | – |
| 0.9107A? | 1.28,0.92 | 0.19,0.41 | MgI,Fe ii | |||
| 09090121 | 1.022 | C iii],Mg ii | 0.5369 | 0.41,0.31 | nd,0.14 | Fe ii |
| 09420047 | 1.362 | Mg ii,broad abs | 0.8182 | 1.58,1.28 | 0.70,0.96 | MgI,Fe ii,Mn ii,Zn ii,Cr ii |
| 1.0231 | 0.38,0.22 | nd,nd | – | |||
| 09480839 | 1.489 | C iii],Mg ii | 1.0763 | 0.76,0.63 | nd,0.26 | Fe ii |
| 1.3273 | 4.07,3.72 | 1.80,2.80 | MgI,Fe ii,Mn ii | |||
| 1.4247 | 1.08,0.62 | 0.16,0.37: | Fe ii | |||
| 10090145 | 1.085 | – | 1.0851A? | 1.23,0.90 | 0.18,0.32 | Fe ii |
| 11473812 | 1.049 | C iii],C ii],Mg ii | 0.3750 | 0.27,0.20 | – | – |
| 12450228 | 1.096 | – | 1.0116 | 0.60,0.48 | 0.26,0.44 | Fe ii |
| 1.0946A? | 2.30,2.27 | 1.82,2.04 | MgI,Fe ii,Mn ii,Zn ii, Cr ii,Al ii,Al iii,Si ii | |||
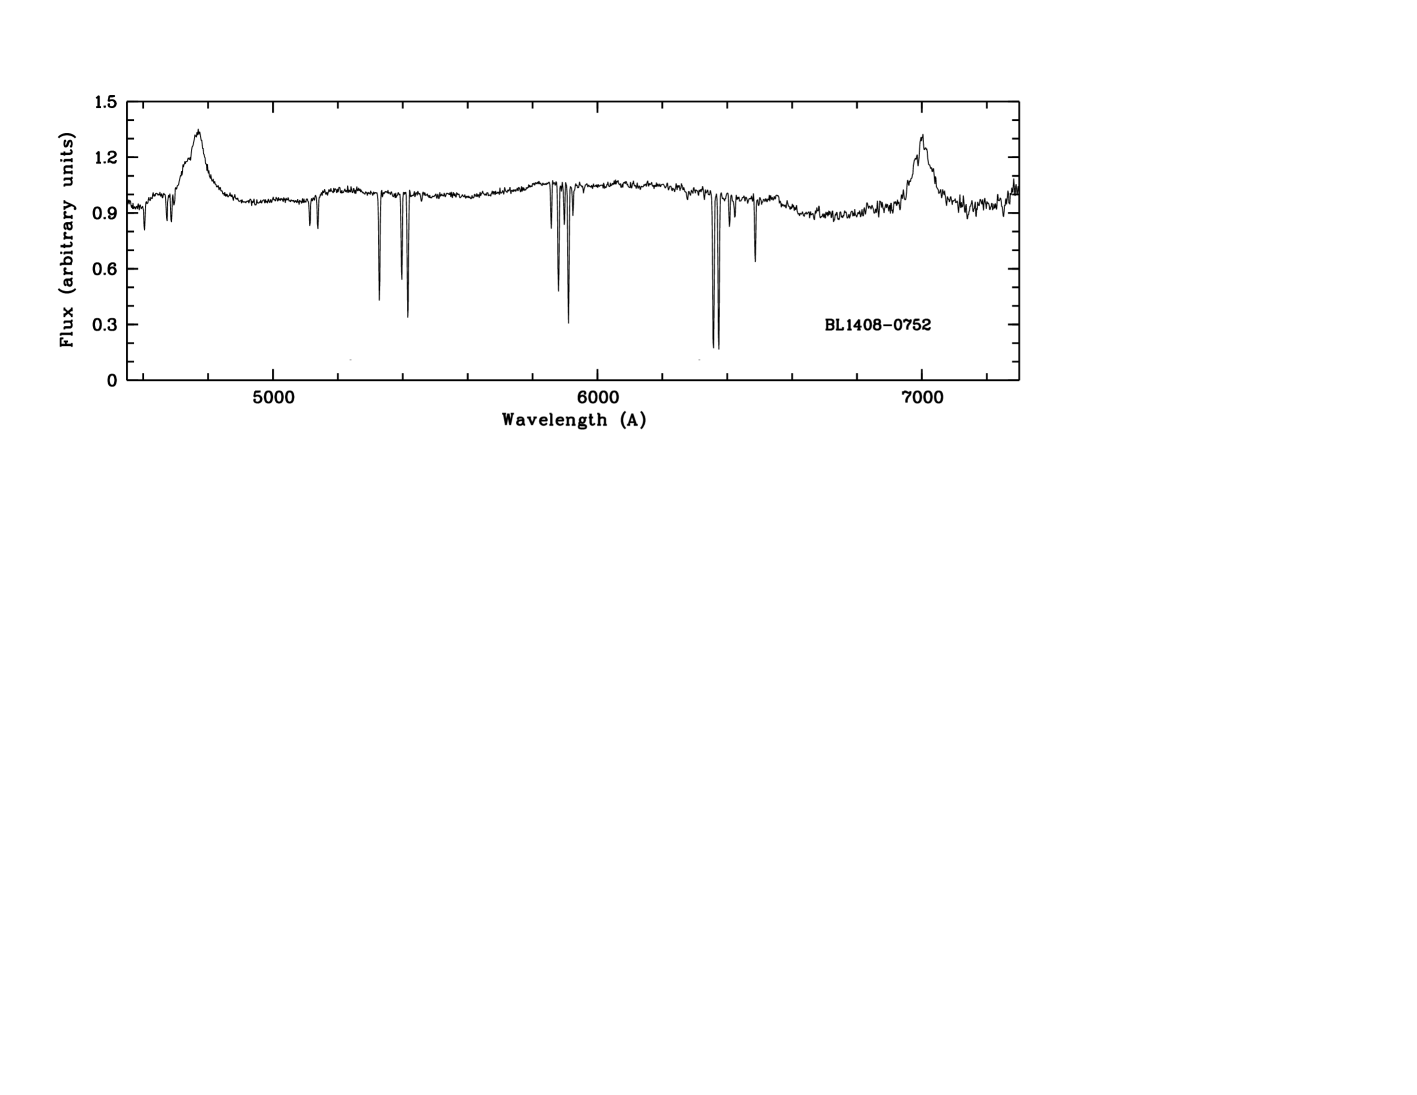
| 14080752 | 1.500 | C iii],C ii],Mg ii | 1.2753 | 2.08,1.90 | 1.17,1.53 | MgI,Fe ii,Mn ii,Zn ii,Cr ii |
| 1.2913 | 0.27,0.26 | nd,0.06: | Fe ii | |||
| 14100203 | 1.253N | C ii],Mg ii | 1.1123 | 0.79,0.56 | nd,0.08: | Fe ii |
| 14190445 | 1.684 | – | 0.8987 | 0.73,0.91b | 0.21,0.35 | Fe ii |
| 1.0849 | 0.47,0.37 | 0.13, | Fe ii | |||
| 1.1039 | 0.52,0.25 | nd,nd | – | |||
| 1.1834 | 0.12,0.09 | nd,nd | – | |||
| 1.2722 | 0.62,0.58 | ,0.49 | Fe ii | |||
| 1.6832A? | 2.60,1.89 | 0.49,0.80 | Fe ii | |||
| 14274206 | 1.522 | C iii],C ii],Mg ii | 1.0432 | 0.23,0.12: | nd,nd | – |
| 1.0907 | 0.62,0.37 | nd,0.09 | Fe ii | |||
| 15222730 | 1.294 | Mg ii | 1.2847A | 0.25,0.22 | nd,0.06 | Fe ii |
| 17430350 | 1.054 | C iii],C ii],Mg ii | 0.2527 | 0.64,0.49: | – | |
| 0.5293 | 1.05,0.80 | 0.37,0.65b | MgI,Fe ii | |||
| 0.9077 | 2.46,2.05 | 0.89,1.32 | MgI,Fe ii,Mn ii | |||
| 19563225 | 1.242 | Mg ii | 0.6236 | 0.95,0.90 | – | – |
| 1.0660 | 3.53,3.49 | 1.77,2.70 | MgIb,Fe ii,Mn ii | |||
| 20311219 | 1.215 | Mg ii | 1.1158SR | 1.29,1.16 | 0.71,1.12 | MgI,Fe ii,Mn ii |
| 21340153 | 1.285 | Mg ii | 1.2458A | 0.22,0.15 | nd,nd | – |
| 21364443 | 0.980 | – | 0.5211 | 0.51,0.39 | 0.12:,0.26 | MgI,Fe ii |
| 22142932 | 1.636 | Al iii,C iii] | 1.5070 | 0.38,0.33 | nd,0.17 | Fe ii |
| 22250457 | 1.404 | C iii],C ii],[Ne iv],Mg ii | 0.8458 | 0.54,0.43 | 0.05,0.18 | Fe ii |
| 0.9782 | 0.10,0.07 | nd,nd | – | |||
| 23111038 | 1.529 | C iii],C ii] | 1.5242A | 3.61,3.09 | 1.37,2.34 | MgI,Fe ii,Al iii |
| 02213556 | 0.944 | Mg ii | 0.6850SR | 1.78,1.72 | na,na | Fe ii,MgI |
| u Representative uncertainties are given in Sect. 3.2. | ||||||
| N New emission redshift. | ||||||
| SR Strong Mg ii system in Stocke & Rector (1997). | ||||||
| A Associated system. | ||||||
| A? Possibly associated system. | ||||||
| a Target in very bright state. The optical flux is known to vary by a factor of at least 35. | ||||||
| b Blended with an other absorption. | ||||||
| nd : not detected. | ||||||
| na : not available. | ||||||
3.1 Observations and data reduction
The observations were performed with the FOcal Reducer and low-dispersion Spectrograph (FORS1) at the ESO VLT UT2 (Kueyen) telescope in November 2007 and May 2008 (Visitor Mode). During these observing runs, the seeing was in the range 0.5 to 1.3, with an average of 0.8. In the long-slit mode, the selected B600 and V600 grisms covered the 3405-6095 Å and 4435-7390 Å spectral ranges, respectively, and yielded a spectral resolution, measured on our target spectra, of FWHM Å (or binned pixels) for our 1.0 slit width. Details on the exposure times and grisms are given in Table 1. Data reduction was performed using MIDAS (08FEBpl1.1). The double exposures for each target enabled an adequate correction of cosmic ray contamination. Standard spectroscopic stars (HILT 600, LTT 9239 and for both observing runs LTT 3218) were observed with a 5.0 slit width. The seeing although general good was nevertheless fairly variable and thus only a relative flux calibration could be performed.
3.2 Redshift and equivalent width estimates
Among the 42 Blazars observed with FORS1, we detect Mg ii and/or C iii] or C ii] emission lines in 35 sources. All the detected emission lines are given in Table 2. Some of our estimates differ from those those already published, including SDSS ones, as our spectra are of higher S/N. We could determine new emission redshift (labelled in Tables 1 and 2) for three Blazars, of which one without any Mg ii absorption system. Their spectra are presented in Appendix A.
Mg ii absorption doublets are detected in 31 Blazars observed with FORS1 plus in one of the three northern 1 Jy BL Lac. Their absorption redshift, , and rest equivalent widths are listed in Table 2. We also give the rest equivalent widths of their associated Fe ii2586,2600 doublets together with a list of all the other detected absorptions. Uncertainties on values vary depending on the spectral region and target magnitude. Representative values are in the range 0.04 - 0.12 Å (corresponding to relative uncertainties of about 2 to 10% depending on line strength) for intermediate S/N values of 50 to 100. In our estimate, we include both pixel-to-pixel noise and uncertainty in the continuum placement; the latter is dominant when the S/N is larger than about 100. In some cases, the Blazars were in a very high state with an optical flux fully dominated by synchrotron emission and we could then detect very weak Mg ii absorption doublets down to mÅ.
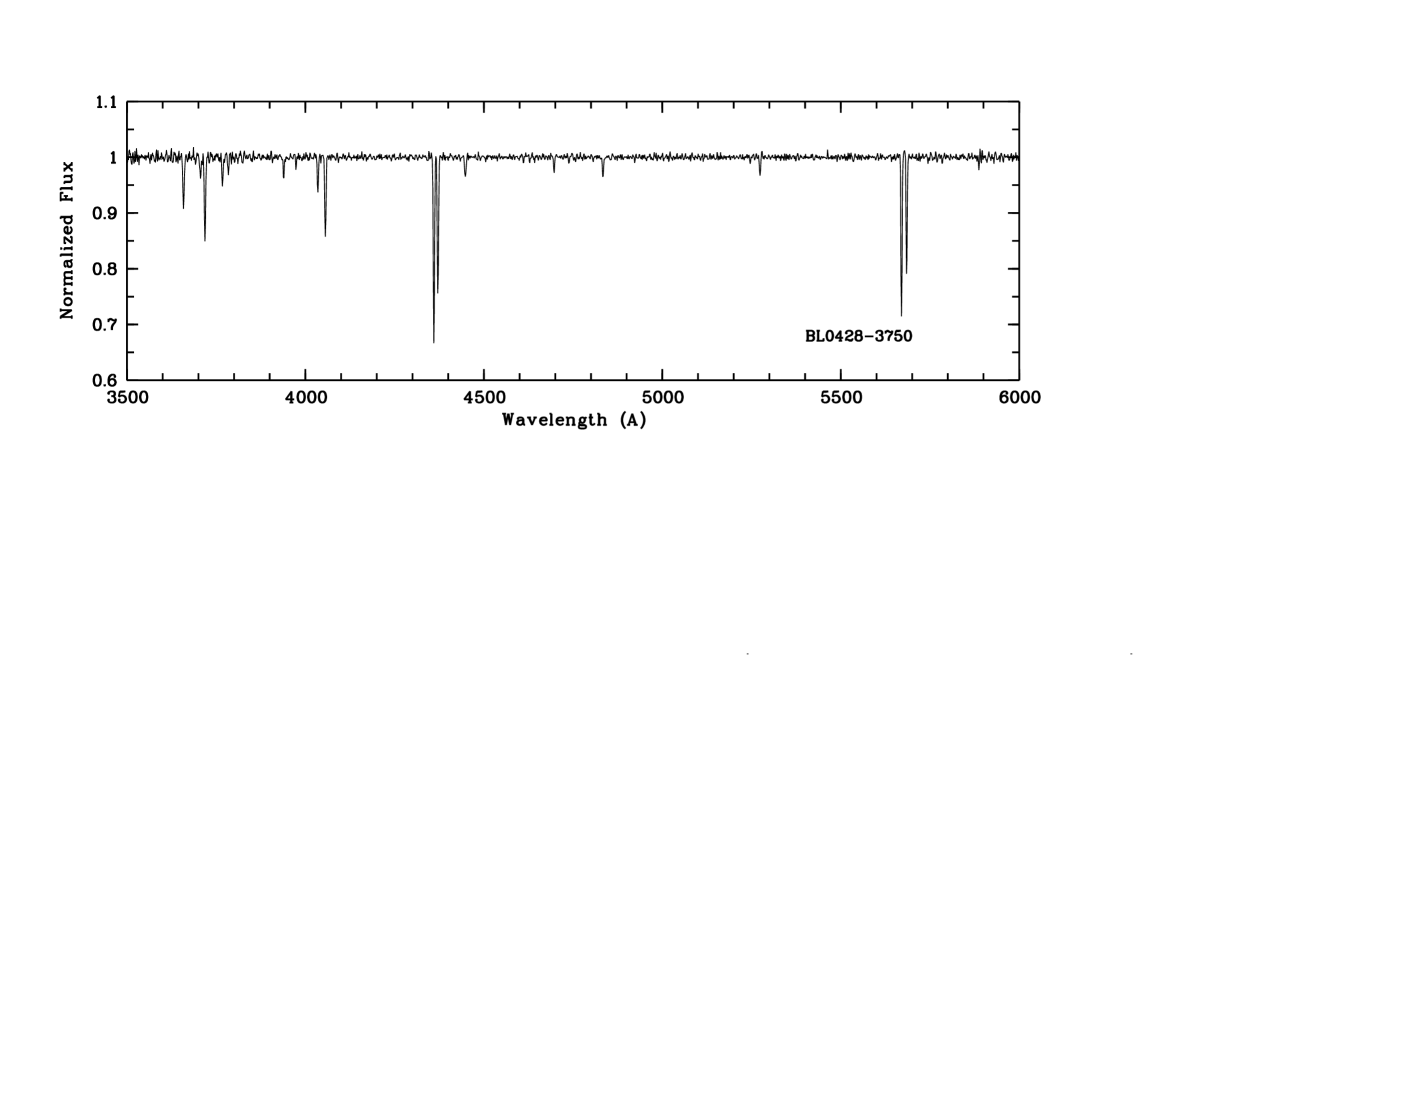
We do not confirm the large strength of the Mg ii system in PKS 0426380 from the sample of Stocke & Rector (stocke (1997)). The spectrum of this Blazar is presented in Appendix C.
In one Blazar, SDSS J094257.8004705, there is an unusual broad absorption line with a FWHM km s-1 that we identify as a highly detached Mg ii BAL at or c. More information on this system is given in Appendix B. Known and potential damped Ly systems are discussed in Appendix D.
3.3 Statistical sample definition
| target | path | path | S/N | |
| Strong | weak | |||
| 01003337 | 0.875 | 0.494 | 0.306 | 50 |
| 02105101 | 1.003 | 0.620 | 0.620 | 95 |
| 02170144 | 1.715 | 0.956 | 0.807 | 190 |
| 02343015 | 1.690 | 0.956 | 0.807 | 120 |
| 02381636 | 0.940 | 0.558 | 0.558 | 80 |
| 02410043 | 0.989 | 0.607 | 0.607 | 55 |
| 02590747 | 0.893 | 0.511 | 0.145 | 40 |
| 03344008 | 1.351 | 0.689 | 0.689 | 95 |
| 04230120 | 0.915 | 0.533 | 0.533 | 180 |
| 04283756 | 1.110 | 0.725 | 0.725 | 270 |
| 04572324 | 1.003 | 0.620 | 0.620 | 350 |
| 05384405 | 0.890 | 0.514 | 0.514 | 250 |
| 07450044 | 0.994 | 0.611 | 0.611 | 200 |
| 08110146 | 1.145 | 0.759 | 0.759 | 85 |
| 08262230 | 0.910 | 0.528 | 0.528 | 200 |
| 09090121 | 1.022 | 0.634 | 0.634 | 140 |
| 09420047 | 1.362 | 0.698 | 0.698 | 105 |
| 09480839 | 1.489 | 0.812 | 0.812 | 55 |
| 10090145 | 1.085 | 0.427 | 0.191 | 40 |
| 10110106 | 1.275 | 0.614 | 0.614 | 60 |
| 11320034 | 1.234 | 0.563 | 0.563 | 130 |
| 11473812 | 1.049 | 0.665 | 0.665 | 55 |
| 12450228 | 1.096 | 0.711 | 0.703 | 75 |
| 12523319 | 0.856 | 0.475 | 0.000 | 28 |
| 13381153 | 1.589 | 0.923 | 0.807 | 150 |
| 14080752 | 1.494 | 0.829 | 0.829 | 100 |
| 14100203 | 1.256 | 0.595 | 0.595 | 75 |
| 14190445 | 1.684 | 0.956 | 0.807 | 80 |
| 14274206 | 1.522 | 0.857 | 0.807 | 100 |
| 15222730 | 1.294 | 0.633 | 0.633 | 110 |
| 15450032 | 1.051 | 0.394 | 0.394 | 50 |
| 17430350 | 1.054 | 0.670 | 0.670 | 70 |
| 19563225 | 1.242 | 0.582 | 0.582 | 50 |
| 20150137 | 0.940 | 0.558 | 0.558 | 115 |
| 20311219 | 1.215 | 0.555 | 0.498 | 55 |
| 21340153 | 1.285 | 0.624 | 0.624 | 130 |
| 21364443 | 0.980 | 0.597 | 0.597 | 115 |
| 22070041 | 1.892 | 0.817 | 0.467 | 55 |
| 22142932 | 1.636 | 0.956 | 0.807 | 48 |
| 22251113 | 0.997 | 0.614 | 0.176 | 35 |
| 22250457 | 1.404 | 0.741 | 0.741 | 125 |
| 23111038 | 1.529 | 0.864 | 0.807 | 75 |
| 02213556 | 0.944 | 0.482 | 0.000 | N/A |
| 05088432 | 1.340 | 0.871 | 0.000 | N/A |
| 13103220 | 0.997 | 0.534 | 0.000 | N/A |
| a FWHM = 3.4 px. | ||||
Our Blazar sample comprises 45 targets. Three are northern objects without FORS1 data, but included here as they are in the 1Jy sample discussed by Stocke & Rector (stocke (1997)). The S/N of their spectra only enables the detection of strong ( Å) Mg ii doublets. For the Blazars with unknown , the lower limit on is set by the Mg ii system of highest . Associated Mg ii absorbers, within 5000 km s-1 of (or its lower limit) are excluded from our Mg ii samples.
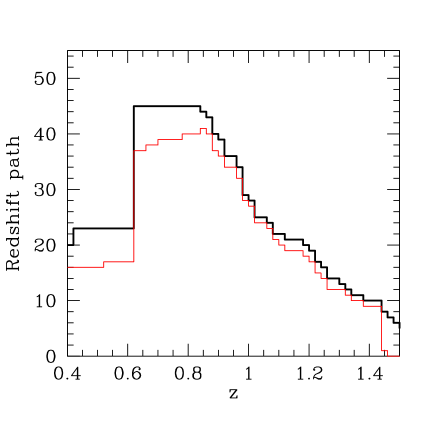
The redshift path for all the sightlines is given in Table 3 and shown in Fig. 1. For both grisms, the minimum values correspond to either the wavelengths at which the overall efficiency is half that at peak efficiency or, if larger, the redshift at which the S/N enables the 3 detection of the Mg ii doublet (with limits of either 0.3 or 1.0 Å). For the former, these values equal and 0.623 for the B600 and V600 grisms, respectively. The efficiency of the B600 grism strongly declines towards its blue end and, although one weak Mg ii system at was detected in one sightline, the statistics are too poor to include this range in our study. Similarly, the S/N decreases at the red end of the V600 grism (see Fig. A.1) due to strong sky lines which prevents detection of weak Mg ii system at for most sightlines. This value is adopted as the upper limit of our range for weak Mg ii systems (the corresponding limit for strong systems is ). Thus the weak Mg ii system at and the strong system at (special setting: R600 grism) given in Table 2 are excluded from our statistical samples.
4 Incidence of Mg ii absorbers in Blazar spectra
4.1 Global excess
We measure the incidence of Mg ii absorbers using our statistical sample of 45 Blazar sightlines. The number density per unit redshift is N, where Nobs is the number of observed absorption systems within the redshift path .
We first consider the entire Mg ii absorber sample, i.e. all systems with 0.3 Å. One of the strong system given in Table 2 is excluded (northern Blazar) since the low S/N prevents detection of weak systems. We thus get:
| (1) |
The errors are based on Poisson statistics for small numbers with limits corresponding to 1 confidence level of a Gaussian distribution as tabulated by Gehrels (gehrels (1986)) and also adopted by Tejos et al. (tejos09 (2009)). To compare this value to the incidence of Mg ii absorbers measured along QSO sight lines, we use the incidence of these systems per unit redshift derived from SDSS data. For Å the incidence measured in QSO spectra is given by Nestor from his analysis of SDSS DR4 (private communication):
| (2) |
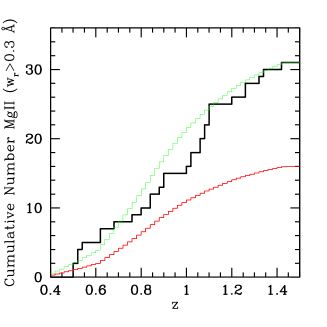
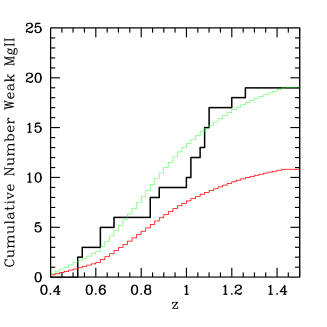
In Fig. 2 (left panel), we present the cumulative number of Mg ii Blazar systems versus redshift for the entire sample. We also plot the cumulative distribution expected for Mg ii QSO systems (computed using Eq. 2) and then adjust the normalization for comparison with Blazars. There is no evidence for a difference in functional form between Blazars and QSOs.
Assuming that the Mg ii Blazar absorbers are distributed at random along sightlines, as demonstrated for Mg ii QSO absorbers with km s-1 (Steidel & Sargent steidel (1992); Wild et al. wild (2008)), the probability distribution for N, the number of systems expected in our set of sightlines, should follow a Poisson distribution:
| (3) |
where is the mean cumulative number expected for QSO systems over the whole set of Blazar sightlines (the value is given by the endpoint of the red curve in Fig. 2). With and , we find , indicating that similar for Blazars and QSOs are ruled out at a confidence level of 99.9%.
The excess of Mg ii Blazar systems with Å equals:
| (4) |
therefore providing a new piece of evidence that the observed incidence of Mg ii absorbers depends on the type of background source. This value is similar to that reported for GRB lines-of-sight.
4.2 Dependence on rest equivalent width
In order to investigate the origin of the excess, we measure the Mg ii incidence towards Blazars for strong ( Å) Mg ii systems. We get:
| (5) |
We adopt the fit given by Prochter et al. (2006a ) from their analysis of SDSS DR4:
| (6) |
While we detect N systems, the number expected for QSO sightlines with the same coverage is only 5.88. Using Eq. 3 with and , we get , indicating that similar for Blazars and QSOs are ruled out at a confidence level of 99%.
The excess of strong Mg ii Blazar systems equals:
| (7) |
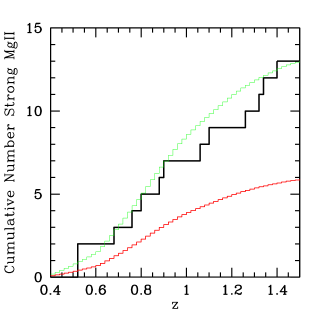
This excess is similar to that found for GRBs (Tejos et al. tejos09 (2009); Vergani et al. vergani (2009)). In Fig. 2 (center panel), we show the cumulative redshift distribution for the strong Mg ii Blazar systems. We also plot the distribution expected for Mg ii QSO systems (Prochter et al. 2006a ) and that obtained after normalization to the total number of systems observed towards Blazars.
For weak ( Å) Mg ii systems, we get:
| (8) |
Using Eq. 3 with and the number expected for QSO sightlines with the same , , we get . Thus similar for Blazars and QSOs are ruled out at a confidence level of 98.5%, lower than for strong Mg ii systems (the incidence of weak Mg ii QSO systems is given by the difference in the values of at obtained with Eqs. 2 and 6).
The excess of weak Mg ii Blazar systems then equals:
| (9) |
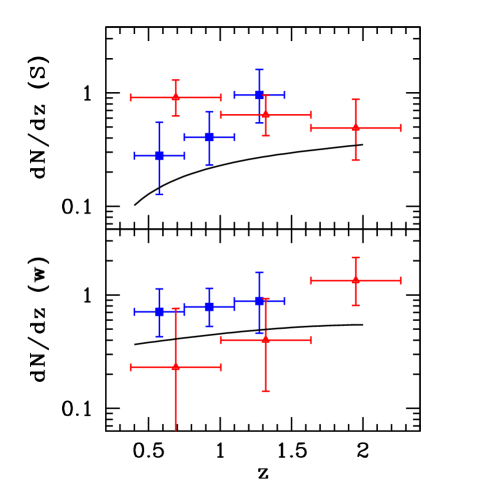
Finally we note that our analysis indicates a possible difference in the redshift evolution of the excess of Blazar and GRB strong absorbers. The excess of strong systems is higher at high along Blazar sightlines (a linear fit yields ) whereas the opposite trend is seen towards GRBs (Vergani et al. vergani (2009)). No difference is seen for weak systems. The evolutions in redshift are shown in Fig. 3 for strong and weak Mg ii systems.
4.3 Results for BL Lacs only
Since 35 out of the 45 targets in the overall Blazar sample belong to the BL Lac class, we can determine the incidence of Mg ii BL Lac systems only, with still statistically meaningfull results.
As in Sect. 4.1, we first consider the entire Mg ii absorber sample (24 systems with Å). This yields:
| (10) |
For the 10 strong ( Å) and 15 weak ( Å) Mg ii BL Lac systems separately, we get:
| (11) |
| (12) |
These results are nearly identical to those obtained for the whole Blazar samples (Eqs. 1, 5 and 8), although with larger uncertainties. We thus find no evidence for a distinct behavior of BL Lac and FSRQ sightlines, which a posteriori justifies considering the Blazar sample as a whole.
The excess of Mg ii BL Lac systems equals:
| (13) |
for the entire, strong and weak samples, respectively, while Stocke & Rector (stocke (1997)) found on the basis of ten sightlines an excess of about 4 - 5 (note that among their five strong systems one is associated and another one is not confirmed).
4.4 Relative velocity distribution
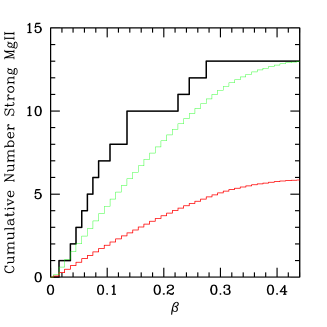
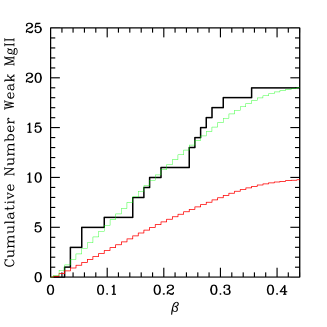
We now test whether the excess of strong Mg ii Blazar systems arises from preferential values of relative velocity between the Blazar and the absorber. We consider the cumulative distribution of Mg ii systems as a function of ,
| (14) |
where is due to the expansion of the Universe and the peculiar velocity of gas ejected by a source at .
In Fig. 4, we give the cumulative distribution for strong and weak systems respectively. For comparison, we need to compute the distribution expected in -space from the background population of intervening Mg ii absorbers. To this aim, we consider the redshift distribution adopted in Sect. 4.1 and build the distribution for each sightline (due to varying values from one target to another, the transformation is specific to each sightline). Next, for any bin, we combine all sightlines contributing to this bin. As expected, the same excess of systems as in Fig. 2 is apparent. More significantly, after scaling to the same total number of systems to assess whether the shapes of the distributions are similar, one can see that strong systems display a relative excess of low to 0.18 systems while the shapes of the QSO and Blazar distribution for weak systems are in quite good agreement. To estimate the significance of the excess of strong systems at low , we perform a KS test and find that we can reject the null hypothesis of a similar underlying distribution only at the 80% significance level. This result must then be considered only as a trend.
4.5 Associated systems
Our results allow us to compare the number of Mg ii systems at to that found for QSOs; the latter is now well constrained by studies based on SDDS data (Wild et al. wild (2008)). Associated systems in Blazars might be more numerous than in QSOs due e.g. to a richer environment or to differing jet properties.
At least two associated systems with Å are present; this is a lower limit because of the sightlines for which no emission redshift is available. The number density of Å QSO systems at is which implies an expected number of associated systems per sightline of
| (15) |
using
| (16) |
Thus, for the 41 sightlines in which we can detect systems, we expect 0.9 system. Towards radio-quiet QSOs, the fraction of Å systems at km s-1, relative to the background level, is 1.7 while this factor reaches 3.3 towards radio-loud QSOs (Wild et al. wild (2008); Wild, private communication: updated results based on the SDSS DR5 that are fairly insensitive to the limit). Thus, if Blazars have a similar excess of associated systems than radio-loud QSOs, we expect 3.3 associated systems at km s-1 in our sample whereas there are two associated and three possibly associated systems. The latter could then be truly associated systems that indeed define the BL Lac/Blazar emission redshifts.
5 Discussion
5.1 Comparison between Blazars, GRBs and QSOs
Our analysis provides a new piece of evidence that the observed incidence of Mg ii absorbers depends on the type of background source. Towards both Blazars and GRBs, Mg ii absorbers are found in excess by roughly a factor of 2 with respect to QSO sightlines. In each case, the difference is significant at the level.
The reported excesses for GRB and Blazar sightlines are similar for Mg ii absorbers with . For weak systems, comparison of the results obtained for Blazars and GRBs is less straightforward due to small number statistics for GRBs. Whereas we find an excess towards Blazars equal to 1.8 at (2.5 significance level), there is no significant excess for GRB absorbers (Vergani et al. vergani (2009)) with a value of 1.2 (using Poisson statistics for the errors) at . Nevertheless, the GRB results differ from the Blazar ones at only a 1 significance level and it can be seen in Fig. 3 that the GRB absorber excess at their highest bin follows the trend found at lower for weak Mg ii Blazar absorbers. It is thus not really possible to conclude whether or not there is a difference between the weak Mg ii Blazar and GBR absorber populations.
Our analysis also suggests a possible difference in the redshift evolution of this excess but larger samples are needed to make definite statements.
5.2 Dust and amplification biases
Dust extinction and/or gravitational magnification due to foreground matter can modify the observed density of background sources and therefore the observed incidence of intervening absorbers. Several authors already pointed out these effects as potentially responsible for (some of) the Mg ii absorber excess in GRB spectra (Porciani et al. porciani (2007)). Here we explain why these effects are unlikely to have a significant contribution in giving rise to an apparent excess of strong Mg ii absorbers both in GRB and Blazars spectra compared to the value measured with QSOs.
GRBs are preselected on the basis of their gamma-ray flux. Rapid follow-up observations of the afterglow emission allow us to observe these objects while their apparent magnitude is significantly (i.e. several magnitudes) brighter than typical limiting magnitudes. This difference is much larger than the typical levels of extinction induced by intervening Mg ii absorbers. The dust content of these systems has been quantified by Ménard et al. (menard (2008)): these authors showed that on average, Mg ii absorbers with give rise to a color excess mag. These authors estimated that about one percent of SDSS QSOs are missed due to the presence of dust in foreground Mg ii absorbers. Most BL Lac objects are identified on the basis of their radio or X-ray emission (e.g. Padovani & Giommi padovani95 (1995)) or their gamma-ray emission. This preselection is not sensitive to a dust obscuration bias (only low frequency X-rays would be affected by absorption but very large hydrogen column densities are required). The optical follow-up could be affected by such an effect. However, Blazars are variable in this wavelength range with a typical amplitude reaching about one magnitude, and for a few Blazars of our sample up to 4-5 magnitudes. Consequently, as in GRBs detection of Mg ii absorbers towards Blazars is not affected by dust extinction.
Gravitational magnification can change the density of background sources. This effect depends on the gradient of the matter over-density along the sightlines and the slope of the source number counts as a function of magnitude (Narayan nara (1989)):
| (17) |
where and are the lensed and unlensed density of sources in the sky, is the gravitational magnification along their sightline and is the slope of the source number counts as a function of magnitude. The average magnification effect induced by galaxies was detected by Scranton et al. (scran (2005)). These authors report an average magnification excess of order one percent for impact parameters of about 50 kpc. Gravitational lensing by absorbers has been theoretically addressed by a number of authors (Bartelmann & Loeb bartelmann (1996); Ménard menard05 (2005)). Given the typical impact parameters of strong Mg ii absorbers (-50 kpc) the magnification excess is expected to be small, i.e. of order a few percents. Observationally, constraints on QSO magnification by Mg ii absorbers have been reported by Ménard et al. (menard (2008)). These authors report . This method cannot be applied to the Blazar population since their number counts as a function of magnitude is ill defined due to their strong optical variability. But, the latter being far larger than any expected gravitational magnification, any significant amplification bias is most unlikely for Blazars. Finally, HST imaging surveys show that gravitational lensing appears to be unimportant to the BL Lac phenomenon (Giovannini et al. giovannini (2004)). Recently Wyithe et al. (wyithe (2010)) proposed strong lensing as an explanation for the higher incidence of Mg ii absorbers in front of GRBs. They argue that 20 to 60% of the GRBs with strong Mg ii absorbers are strongly lensed. Here we note that if this was the case, the GRB host galaxy should also be strongly lensed and appear as arcs or multiple images. So far HST imaging of GRB host galaxies have not reported such a phenomenon (Conselice et al. conselice (2005)), indicating that strong lensing is not often induced by intervening Mg ii absorbers.
Therefore, while dust extinction can lower the apparent incidence of absorbers in front of quasars and gravitational lensing can increase it in front of GRBs and Blazars, the amplitude of these effects is at least an order of magnitude lower than what would be required to explain a factor 2 change in the incidence of Mg ii absorbers.
5.3 An intrinsic origin?
We now consider whether a significant fraction of the Mg ii system excess could be intrinsic by exploring some of the physical conditions required for cold gas to be entrained at high velocities. Such a scenario is appealing in the context of Blazars since these sources are known to display relativistic jets pointing towards us. If material is present in the neighborhood (either gas surrounding the AGN, within the interstellar medium of the host galaxy, or further away within its halo) it might be swept up by the jet and accelerated to high velocities. In our sample, there is no marked accumulation of systems at thus, if such systems give a significant contribution ( 50%) to the observed Mg ii systems, ejection velocities of a few km s-1 must be involved.
Towards QSOs, outflow velocities in this range are currently observed for BAL systems. The latter are thought to arise when the line of sight intersects the wind emanating from the accretion disk with the appropriate inclination angle - typically 30 deg (see Elvis elvis (2000)) - which accounts for the large velocity dispersion found in these systems. Regarding Blazars, the inclination is supposed to be smaller (around 10 deg; Fan et al. fan09 (2009)) and as a result, the line of sight is not expected to cross the disk wind. Indeed, BAL absorption is usually not seen in Blazar spectra.
One may rather invoke material impacted by the jet along its way as the source of the absorption. This could be for instance diffuse gas located relatively close to the AGN. In such a configuration, jet material is expected to sweep up the external gas and while the corresponding column density () increases, the advance velocity of the interface () decreases (Falle falle (1991); Kaiser & Alexander kaiser (1997); Komissarov & Falle komi (1998)). If we identify the advance velocity with the apparent ejection velocity of the absorbing gas, the question is then: can we still have total column densities of swept up gas as large as cm-2 together with velocities as high as a few km s-1? Komissarov & Falle (komi (1998)) have shown that in the early phase of a relativistic jet growth while later, the dynamics of the interface follows a power-law behavior with respect to the time , with the jet length () increasing as , corresponding to a velocity decreasing as . In this regime, one can use the power-law expressions provided by Komissarov & Falle (komi (1998)) to relate directly to (by eliminating ), which leads to
| (18) |
The column density of swept up gas, , simply writes . Assuming for simplicity a pure hydrogen gas to connect and , we finally get the numerical relation:
| (19) |
This relation indicates that for reasonable jet powers and ambient gas densities, a column density as large as cm-2 can be swept up, with a relative velocity attaining . The above estimate for is an upper limit for the amount of gas effectively present at the interface because part of the swept up external gas flows away from the contact zone. However, even if only a small fraction (e.g. 0.1) remains at the interface, the column density can be large enough to induce the observed absorption systems. Note that such an intrinsic scenario does not necessarily imply a large velocity dispersion since, contrary to the case of QSO BAL systems, the absorbing material is not closely associated with the active nucleus.
6 Conclusions
Attempting to shed light on the unexplained excess of Mg ii absorbers in front of GRBs, we measured the incidence of such absorbers in front of another class of objects: the Blazars.
We observed with FORS1 at the ESO-VLT 42 Blazars with an emission redshift , to which we added the three high northern objects belonging to the 1Jy BL Lac sample. From this sample we detect 32 Mg ii absorbers in the redshift range 0.35-1.45. Our main results are as follows.
-
1.
We find an excess in the incidence of Mg ii absorbers compared to that measured towards QSOs by a factor , detected at 3. The amplitude of the effect is similar to that found along GRB sightlines.
-
2.
In front of Blazars, the excess is apparent for both ”strong”, i.e. Å, and weaker systems, with Å.
-
3.
The dependence on velocity separation with respect to the background Blazars indicates, at the level, a potential excess for .
This work brings another piece of evidence that the incidence of extragalactic absorbers systems might depend on the type of background source considered. We argue that biases involving dust extinction, weak and/or strong gravitational amplification are not likely to affect the frequency of Mg ii systems detected towards either Blazars and GRBs at a significant level. We also briefly discuss the physical conditions required for these absorber systems to be physically associated with the Blazars.
We claim that a satisfactory explanation for the apparent excess of Mg ii absorbers in front of certain types of background sources still awaits. Further investigations should be made on both theoretical and observational sides. For the former, realistic numerical modelling of the jet/ambient gas interaction should focus not only on jet properties as commonly done (see e.g. Choi et al. choi (2007)) but rather on those of the swept up gas at different stages of the jet growth. We stress in particular that taking into account the thermal behavior of the gas (heating/cooling processes) is important to properly assess its physical properties (ionisation level, spatial structure, temperature; e.g. Mellema et al. mell (2002)).
Given the lack of current theoretical understanding, more observational results might offer us some guidance, especially by exploring dependencies with source properties. A first test is to split QSOs in various sub-classes. The most straightforward one involves their radio brightness: this has been investigated by Ellison et al. (ellison (2004)) who have shown that the incidence of Mg ii absorbers does not appear to depend on the radio loudness of the background QSO. Other tests concern the size of the optical emission regions. For QSOs, Pontzen et al. (pontzen (2007)) reported a consistent Mg ii incidence measured over the continuum regions and the larger, C iii emission line regions. Such a test should also be conducted for Blazars in high and low states, when the continuum flux originates mainly either from the jet or from the accretion disk, respectively. Those Blazars from our sample displaying several systems are obvious targets for such a study. Repeat high resolution spectra would in particular constrain possible variability of various absorption lines (Mg ii, Mg i, Fe ii), thus test the intrinsic origin scenario, and yield kinematics and ionization properties of Mg ii Blazar absorbers to be compared with those of Mg ii QSO absorbers.
Acknowledgements.
We thank R. M. Plotkin for providing information prior to publication and the anonymous referee for his/her useful comments and suggestions. We are also grateful to F. Daigne and S. Falle for helpful discussions on jet models.References
- (1) Abdo, A. A., Ackermann, M., Ajello, M., et al. 2009, ApJS, 183, 46
- (2) Angel, J. R. P., & Stockman, H. S. 1980, ARAA 8, 321
- (3) Bartelmann, M., & Loeb, A. 1996, ApJ, 457, 529
- (4) Becker, R. H., White, R. L., Gregg, M. D., et al. 2000, ApJ, 538, 72
- (5) Bergeron, J., & Stasińka, G. 1986, A&A, 169, 1
- (6) Bergeron, J., & D’Odorico, S. 1986, MNRAS, 220, 833
- (7) Bergeron, J., & Boissé 1991, A&A, 243, 344
- (8) Blades, J. C., Hunstead, R. W., Murdoch, H. S., & Pettini, M. 1985, ApJ, 288, 580
- (9) Choi, E., Wiita , P. J., & Ryu, D. 2007, ApJ, 655, 769
- (10) Cohen, J. G., Lawrence, C. R., & Blandford, R. D. 2003, ApJ, 583, 67
- (11) Collinge, M. J., Strauss, M. A., Hall, P. B., et al. 2005, AJ, 129, 2542
- (12) Conselice, C. J., Vreeswilk, P. M., Fruchter, A. S., et al. 2005, ApJ, 633, 29
- (13) Drinkwater, M. J., Webster, R. L., Francis, P. J., et al. 1997, MNRAS, 284, 85
- (14) Ellison, S. L., Churchill, C. W., Rix, S. A., Pettini, M. 2004, ApJ, 615, 118
- (15) Elvis, M. 2000, ApJ, 545, 63
- (16) Falle, S. A. E. G. 1991, MNRAS, 250,581
- (17) Fan, J.-H., Hua, T.-X., Yuan, Y.-H., et al. 2006, PASJ, 58, 945
- (18) Fan, J.-H., Huang, Y., He, T.-M., et al. 2009, PASJ, 61, 639
- (19) Fragile, P. C., Murray, S. D., & Lin, D. N. C. 2004, ApJ, 604, 74
- (20) Frank, S., Bentz, M. C., Stanek, K. Z., et al. 2007, Ap&SS, 312, 325
- (21) Gehrels, N. 1986, ApJ, 303, 336
- (22) Giovannini, G., Falomo, R., Scarpa, R., Treves, A., & Urry, C. M. 2004, ApJ, 613, 747
- (23) Hall, P. B., Anderson, S. C., Strauss, M. A., et al. 2002, ApJS, 141, 267
- (24) Hao H., Stanek, K. Z., Dobrzycki, A., et al. 2007, ApJ, 659, L99
- (25) Heidt, J., Troeller, M., Nilsson, K., et al. 2004, A&A, 418, 813
- (26) Impey, C. D., & Tapia, S. 1988, ApJ, 333, 666
- (27) Impey, C. D., & Tapia, S. 1988, ApJ, 354, 124
- (28) Jannuzi, B. T., Hartig, G. F., Kirhakos, S., et al. 1996, ApJ, 470, L11
- (29) Kaiser, C. R., & Alexander, P. 1997, MNRAS, 286, 215
- (30) Kanekar, N., & Chengalur, J. N. 2001, MNRAS, 325, 631
- (31) Komissarov, S. S., & Falle, S. A. E. G. 1998, MNRAS, 297,1087
- (32) Londish, D., Croom, S. M., Boyle, B. J., et al. 2002, MNRAS, 334, 941
- (33) Londish, D., Croom, S. M., Heidt, J., et al. 2007, MNRAS, 374, 556
- (34) Mellema, G., Kurk, J. D., & Röttgering, H. J. A. 2002, A&A, 395, L13
- (35) Ménard, B. 2005, ApJ, 630, 28
- (36) Ménard, B., Nestor, D., Turnshek, D., et al. 2008, MNRAS, 385, 1053
- (37) Miller, J. S., French, H. B., & Hawley, S. A. 1978, Proceedings Pittsburgh Conference on BL Lac Objects, ed. A. Wolfe, University of Pittsburgh, p. 176
- (38) Mukherjee, R., Bertsch, D. L., Bloom, S. D. et al. 1997, ApJ, 490, 116
- (39) Narayan, R. 1989, ApJ, 339, L53
- (40) Nestor, D. B., Turnshek, D. A., & Rao, S. M. 2005, ApJ, 628, 637
- (41) Padovani, P., & Giommi, P. 1995, MNRAS, 277, 1477
- (42) Padovani, P. 2007, Ap&SS, 309, 63
- (43) Pian, E., Falomo, R., & Treves, A. 2005, MNRAS, 361, 919
- (44) Piner, B. G., Bhattarai, D., Edwards, P. G., & Jones D. L. 2006, ApJ, 640, 196
- (45) Piner, B. G., Mahmud, M., Fey, A. L., & Gospodinova, K. 2007, AJ, 133, 2357
- (46) Pontzen, A., Hewett, P., Carswell, R., & Wild, V. 2007, MNRAS, 381, L99
- (47) Plotkin, R.M., Anderson, S. F., Hall, P. B, et al. 2008, AJ, 135, 2453
- (48) Porciani, C., Viel, M., & Lilly, S. J. 2007, ApJ, 659, 21
- (49) Prochter, G. E., Prochaska, J. X., Chen, H.-W., et al. 2006a, ApJ, 648, L93
- (50) Prochter, G. E., Prochaska, J. X., & Burles, S. M. 2006b, ApJ, 639, 766
- (51) Rao, S. M., & Turnshek, D. A. 2000, ApJ,S 130, 1
- (52) Rao, S. M., Turnshek, D. A., & Nestor, D. B. 2006, ApJ, 636, 610
- (53) Rector , T. A., & Stocke, J. T. 2001, AJ, 122, 565
- (54) Sbarufatti, B., Treves, A., Falomo, R., et al. 2005, AJ, 129, 559
- (55) Sbarufatti, B., Treves, A., Falomo, R., et al. 2006, AJ, 132, 1
- (56) Scranton, R., Ménard, B., Richards, G. T., et al. 2005, ApJ, 633, 589
- (57) Smith, P. S., Williams, G. G., Schmidt, G. D., et al. 2007, ApJ, 663, 118
- (58) Steidel, C. C. & Sargent, W. L. W. 1992, ApJS, 80, 1
- (59) Steidel, C. C., Dickinson, M., & Persson, S. E. 1994, ApJ, 437, L75
- (60) Steidel, C. C. 1995, astro-ph/9509098
- (61) Stickel, M., Fried, J. W., & Kuehr, H. 1989, A&AS, 80, 103
- (62) Stocke, J. T., & Rector, T. A. 1997, ApJ, 489, L17
- (63) Sudilovsky, V., Savaglio, S., Vreeswijk, P., et al. 2007, ApJ, 669, 741
- (64) Sudilovsky, V., Smith, D., Savaglio, S. 2009, ApJ, 699, 56
- (65) Tavecchio, F. 2007, Ap&SS, 311, 247
- (66) Tejos, N., Lopez, S., Prochaska, J. X., Chen, H.-W., & Dessauges-Zavadsky, M. 2007, ApJ, 671, 622
- (67) Tejos, N., Lopez, S., Prochaska, J. X., et al. 2009, ApJ, 706, 1309
- (68) Vergani, S.D., Petitjean, P., Ledoux, C., et al. 2009, A&A, 503, 771
- (69) Wolfe, A. M., Davis, M. M., & Briggs, F.H. 1982, ApJ, 259, 495
- (70) Wyithe S., Oh S. P., & Pindor B. 2010, MNRAS, submitted, arXiv:1004.2081
- (71) Wild, V., Kauffmann, G., White, S., et al. 2008, MNRAS, 388,227
- (72) Young, P., Sargent, W. L. W. & Boksenberg, A. 1982, ApJS, 48, 455
Appendix A New emission redshifts
The spectra of three Blazars show very weak emission lines yielding new emission redshifts. They are presented in Fig. 5.
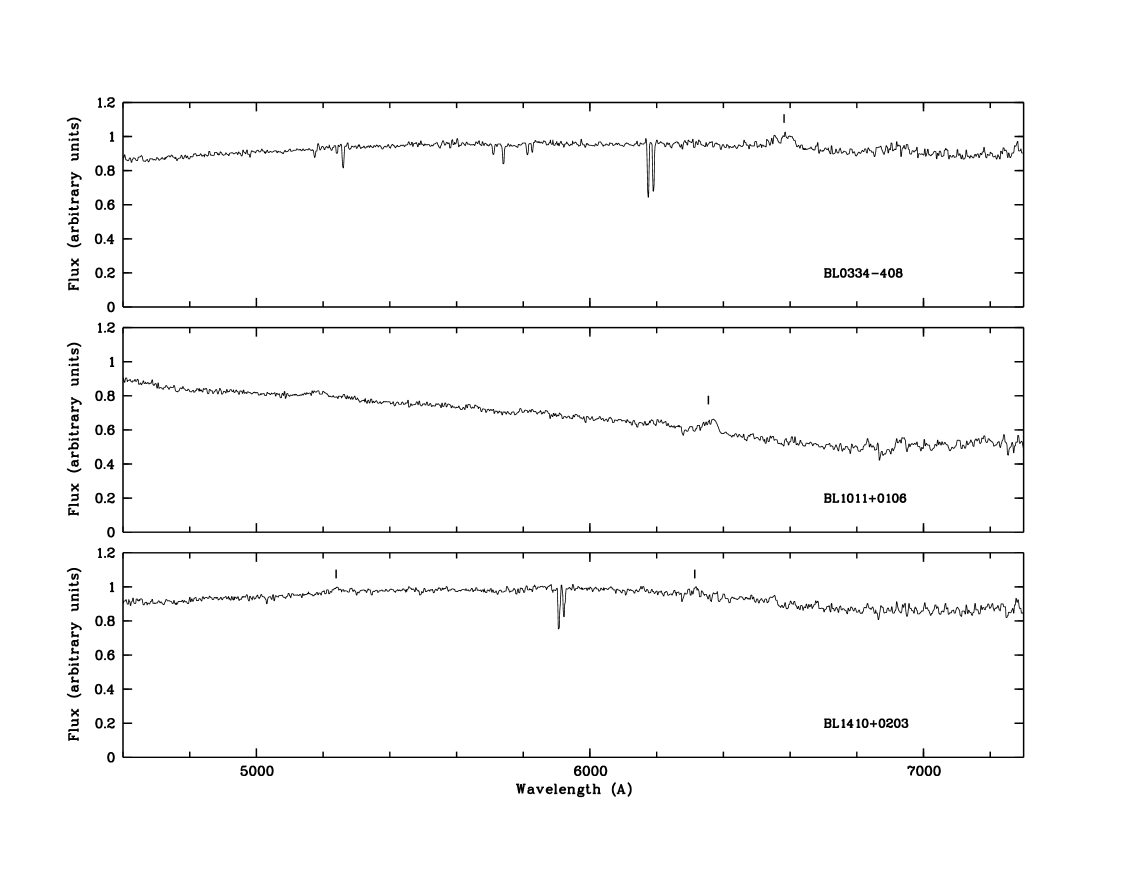
In PKS 0332403 (Fig. 5 top panel), the weak emission at Å is identified as Mg ii at . As reported in Table 2, there is a weak Mg ii absorption doublet at with associated Fe ii absorptions (the doublet and the triplet); the other Mg ii system at is too weak to be included in our statistical Mg ii sample.
In PKS 1008013 (Fig. 5 central panel), there is an asymmetric emission line centred at Å identified as Mg ii at , which is also clearly present in the SDSS spectrum of this source. We thus do not confirm the ’uncertain’ redshift, , given by Collinge et al. (collinge (2005)). We do not detect any absorption line in the FORS1 spectrum of this Blazar.
Appendix B The discovery of a broad absorption line in a Blazar spectrum
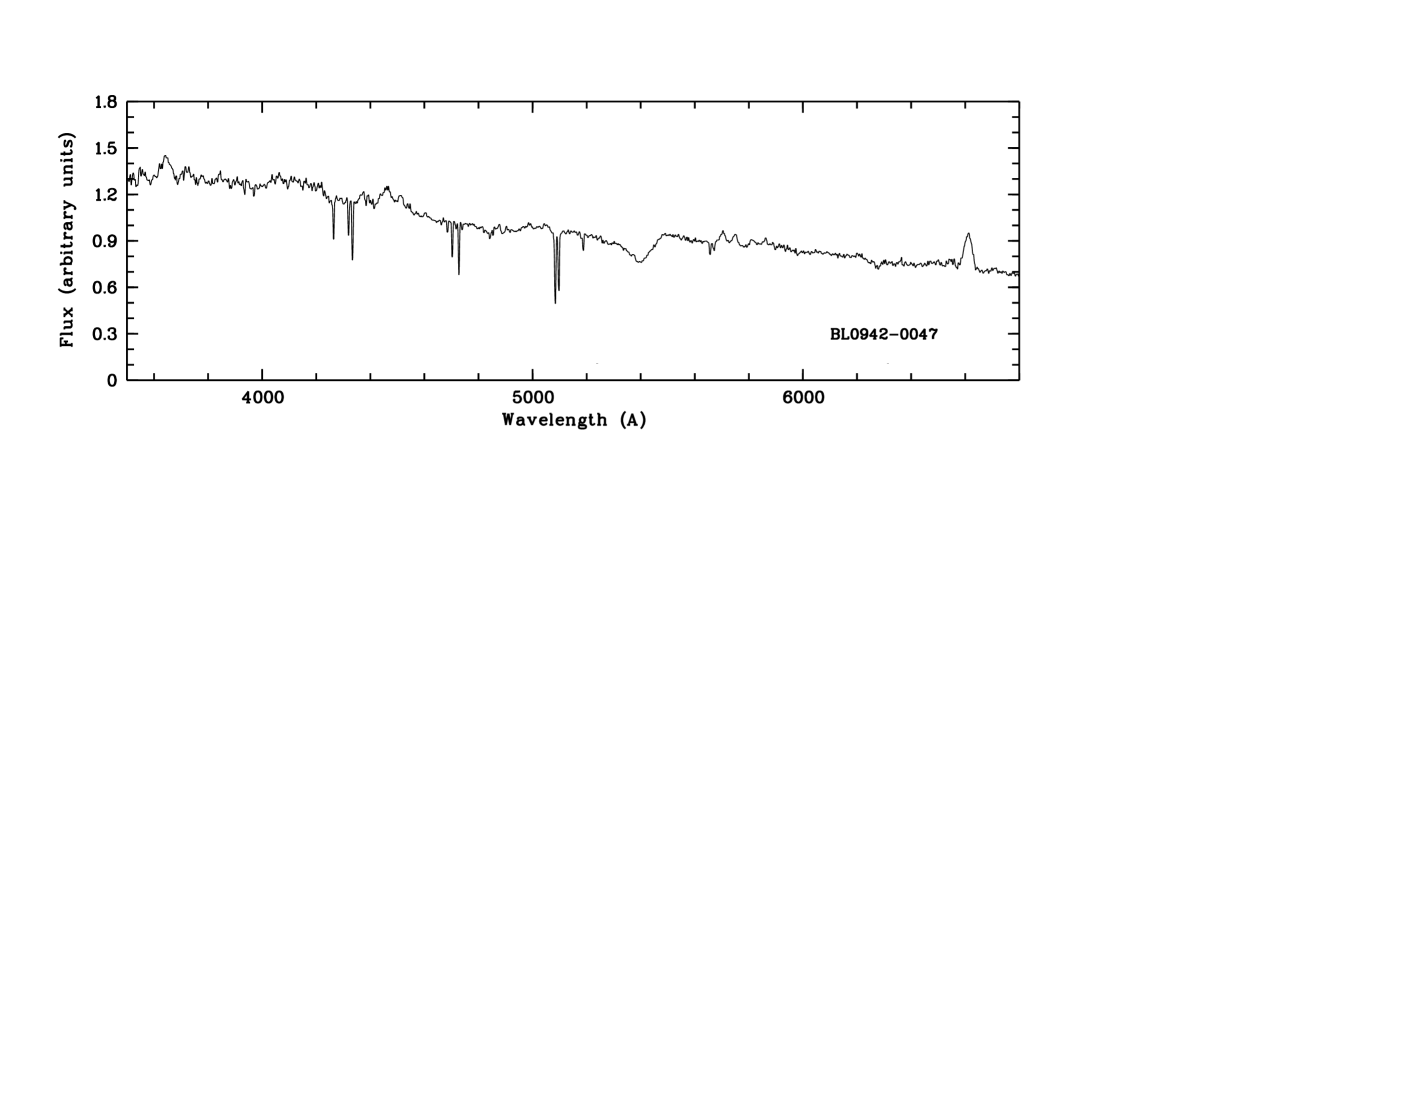
For one Blazar (the weak FIRST radio source SDSS J094257.8004705), there is an unusual broad absorption line with a FWHM km s-1 as shown in Fig. 6. This feature cannot be the signature of a dust shallow absorption at 2175 Å associated with the Blazar (), since it should be at Å. Thus, it is identified as a Mg ii BAL at or c. Such highly detached BALs, although very rare, have already been detected at low redshift (e.g. the high ionization BAL in PG 2302+029 at reported by Jannuzi et al. (jannuzi (1996))). In sources at from the FIRST Bright Quasar Survey (FBQS), there is a 5% fraction of low ionization (Lo) BALs (Becker et al. becker (2000)); the frequency of LoBAL QSOs is dependent of radio-loudness and decreases for the most radio-luminous QSOs. We thus expect at most two LoBAL QSOs in our Blazar sample since 33 of the 45 Blazars are strong (1 Jy) radio sources, which is consistent with our single LoBAL detection.
There are also two narrow absorption systems in the Blazar spectrum. The strong Mg ii doublet at has Mg i, Mn ii and Fe ii associated strong absorptions. The weak system at shows Mg ii absorption only.
Appendix C Not confirmed strong Mg ii absorption in one source of the Stocke & Rector BL Lac sample
PKS 0426380 is one of the ten sources presented by Stocke & Rector (stocke (1997)), sample for which an excess of strong Mg ii in BL Lac objects had first been reported. The high S/N (270) of our FORS1 spectrum enables us to detect very weak absorption lines. The absorber at is not confirmed as a strong Mg ii system (w Å) and has weak Fe ii(2382,2600) and Al iii doublet associated absorptions.
There is a stronger Mg ii doublet (w Å) at with associated Mg i absorption together with the five stronger Fe ii lines. We also detect Galactic Ca ii absorption, as well as the only intervening () Ca ii absorber in our Blazar sample. The latter is at with a marginal detection of the weaker line of the doublet but exactly at the same redshift.
Appendix D Known and potential DLAs
Classical Damped Ly systems (DLAs) have H i column densities N(H i) cm-2. The fraction of DLAs among intervening QSO absorbers, with constraints on Mg ii2796 and Fe ii2600 (or the ratio of their equivalent widths) and on Mg i2852 is about 40% (Rao et al. rao (2006)). Is the DLA fraction similar for Blazars? Among our sample of 45 Blazars, N(H i) can be derived from Ly absorption line profiles for eight sources only, i.e. those with HST/FOS or STIS spectra. Since most of our selected Blazars are strong radio sources, the DLA subpopulation which traces a cold gas phase can also be identified by 21 cm absorption.
Three of the strong Mg ii Blazar absorbers have UV spectra. One is a DLA, the absorber towards PKS 0235164, and two are sub-DLAs with N(H i) cm-2, the intervening absorber at towards PKS 021501 and the possibly associated absorber at towards PKS 0823223. The other properties of DLAs and sub-DLAs mentioned above are their large (Fe ii2600)/(Mg ii2796) ratio (0.5) and Mg i2852 strength (e.g. Bergeron & Stasińka bergeron86s (1986); Rao et al. rao (2006)). Four strong Mg ii absorbers do not satisfy these criteria and thus cannot be DLAs: (i) two intervening ones at in SDSS J024156.4004351 and in SDSS J094827.0083940, (ii) two possibly associated systems at in PKS 1008013 and in SDSS J141927.4044513.
Two strong Mg ii systems in the BL Lac sample of Stocke & Rector (stocke (1997)), also in our sample, were known 21 cm intervening absorbers, at (DLA mentioned above) and towards the lensed source B2 0218357. There are three other intervening, strong Mg ii absorbers towards bright radio sources, with DLA signatures (detection of weak transitions of Fe ii, Zn ii and Cr ii). We have recently obtained GMRT and GBT time to observe these sources. The GMRT data show 21 cm absorption at in PKS 1406076 and in PKS 2029121 (Gupta et al. in preparation). The FORS1 spectrum of PKS 1406076 is presented in Fig. 8. Analysis of the GBT data for PKS 0454234 is in progress to search for 21 cm absorption at .
In our Blazar sample, 10 strong Mg ii systems satisfy the criteria of high N(H i): four are confirmed DLAs and one is a probable DLA, thus yielding a DLA fraction of 40% compatible with that determined for QSOs absorbers. Additional UV and/or 21 cm data are needed to ascertain whether the incidence of DLA in our strong Mg ii-Fe ii Blazar sample is even higher or not than for QSOs.