11email: torres@iaa.es 22institutetext: INAF-Istituto di Radioastronomia, Via Gobetti 101, I-40129, Bologna, Italy
Serendipitous discovery of the long-sought AGN in Arp 299-A
Abstract
Context. The dusty nuclear regions of luminous infra-red galaxies (LIRGs) are heated by either an intense burst of massive star formation, an active galactic nucleus (AGN), or a combination of both. Disentangling the contribution of each of those putative dust-heating agents is a challenging task, and direct imaging of the innermost few pc can only be accomplished at radio wavelengths, using very high-angular resolution observations.
Aims. We observed the nucleus A of the interacting starburst galaxy Arp 299, using very long baseline interferometry (VLBI) radio observations at 1.7 and 5.0 GHz. Our aim was to characterize the compact sources in the innermost few pc region of Arp 299-A, as well as to detect recently exploded core-collapse supernovae.
Methods. We used the European VLBI Network (EVN) to image the 1.7 and 5.0 GHz compact radio emission of the parsec-scale structure in the nucleus of Arp 299-A with milliarcsecond resolution.
Results. Our EVN observations show that one of the compact VLBI sources, A1, previously detected at 5.0 GHz, has a flat spectrum between 1.7 and 5.0 GHz and is the brightest source at both frequencies. Our 1.7 GHz EVN image shows also diffuse, low-surface brightness emission extending westwards from A1 and displays a prominent core-jet structure.
Conclusions. The morphology, radio luminosity, spectral index and ratio of radio-to-X-ray emission of the A1-A5 region is consistent with a low-luminosity AGN (LLAGN), and rules out the possibility that it is a chain of young radio supernovae (RSNe) and supernova remnants (SNRs). We therefore conclude that A1-A5 is the long-sought AGN in Arp 299-A. This finding may suggest that both starburst and AGN are frequently associated phenomena in mergers.
Key Words.:
Galaxies: starburst – nucleus – individual: IC 694 – Stars: supernovae: general – Radiation mechanisms: nonthermal – Radio continuum: stars1 Introduction
Arp 299 consists of two interacting galaxies (IC 694 and NGC 3690) that are in an early merger stage (Keel & Wu 1995). At a luminosity distance of 44.8 Mpc (Fixsen et al. 1996) for km s-1 Mpc-1 (1” corresponds to 217 pc) , Arp 299 has an infrared luminosity, (Sanders et al. 2003). The nuclear regions of Arp 299 are heavily dust-enshrouded, which prevents their study at optical wavelengths. Fortunately, radio observations are not affected by dust, and therefore stand as the most promising way to study the innermost, buried regions of Arp 299.
Radio interferometric VLA observations of Arp 299 at about one arcsecond resolution (e.g. Neff et al. 2004) show that its radio emission is mainly due to ionized gas. The large distance to Arp 299 requires the use of very long-baseline interferometry (VLBI) technique to resolve the radio emission from the innermost regions of this interacting starburst galaxy. In fact, VLBI observations of the two primary nuclei of Arp 299 have resulted in the discovery of a large population of very compact sources in the nuclear regions of Arp 299-A (=IC694) and Arp 299-B1 (=NGC 3690) (Pérez-Torres et al. 2009b; Ulvestad 2009). The high brightness temperatures observed for this population of compact sources were indicative of a nonthermal origin for the observed radio emission, implying that most of those sources were young RSNe and SNRs. On the other hand, X-ray imaging and spectroscopy (Della Ceca et al. 2002; Zezas et al. 2003; Ballo et al. 2004), as well as the presence of nuclear H2O masers (Henkel et al. 2005; Tarchi et al. 2007), indicate that the nuclear regions of Arp 299-A and Arp 299-B1 are likely to contain an AGN, but its location has so far remained an open question. On the other hand, Alonso-Herrero et al. (2009) have noticed that the MIR properties of Arp 299-A were consistent with obscured star formation, although they could not exclude the existence of an LLAGN. In this Letter, we focus on studying the inner few parsecs of the nucleus in Arp 299-A. A detailed discussion of the radio emission and spectral properties of all the compact components in the central hundred parsec region will be presented in another paper.
2 EVN observations of Arp 299-A
We used the European VLBI Network (EVN) to image the central region of Arp 299-A at 1.7 GHz on 7-8 June 2009, and at 5.0 GHz on 12-13 June 2009, with the pointing position centered on the Arp 299-A nucleus. We used a sustained data recording rate of 1024 Mbit s-1 in two-bit sampling. Each frequency band was split into eight intermediate frequencies (IFs) of 16 MHz bandwidths each, for a total synthesized bandwidth of 128 MHz. Each IF was in turn split into 32 channels of 0.5 MHz bandwidth each. Our array included the following antennas at both frequencies: Effelsberg, Cambridge, Medicina, Jodrell Bank (Mk 2), Onsala, Torun, Urumqi, Shanghai, and Westerbork. In addition, the Yebes antenna in Spain was also part of the array at 5.0 GHz. Each of the two VLBI observing epochs consisted of 6.0 hr phase-referenced experiments. Our target source, the nucleus of Arp 299-A, was phase-referenced to the calibrator J1128+5925 with a duty cycle of 5 minutes. The strong source 4C 39.25 was used as fringe finder and bandpass calibrator. The total effective time on source for Arp 299-A was 3.6 hr.
The data were correlated at the EVN MkIV data processor at JIVE using an averaging time of 2 s. We performed standard a-priori gain calibration using the measured gains and system temperatures of each antenna. This calibration, as well as the data inspection and flagging, were done within the NRAO Astronomical Image Processing System (AIPS). We also corrected for ionosphere effects (of particular relevance at 1.7 GHz) and source-structure effects of the phase-reference source at both frequencies, following the same procedures as described in Pérez-Torres et al. (2009b). No self-calibration was performed on the data, since the peaks of emission were too faint to qualify for these procedures. We also used AIPS to image Arp 299-A, that is, the images in Figure 1 were obtained by applying natural weighting to the data, which resulted in FWHM, synthesized interferometric beams of (11.9 mas 4.4 mas at PA=-76∘) and (5.0 mas 4.1 mas at PA=7∘) at 1.7 and 5.0 GHz, respectively. The attained off-source r.m.s noise was of Jy at 1.7 GHz and Jy at 5.0 GHz.
3 Results and discussion
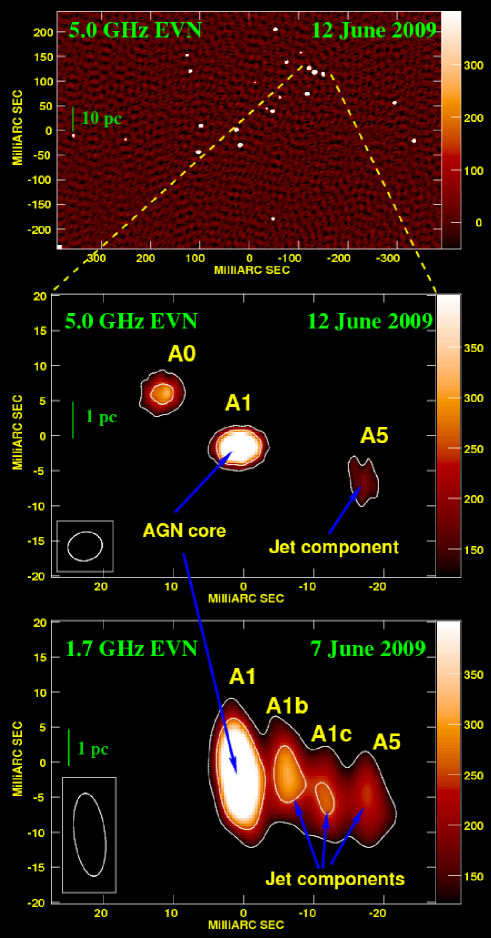
Our results are summarized in Figure 1 and Table 1. Figure 1 shows the field of the central (15080) pc of Arp 299-A (top), as imaged with the EVN at 5.0 GHz on 12-13 June 2009. Our 5.0 GHz EVN image is very similar to the images previously published in Pérez-Torres et al. (2009b), and confirms that Arp 299-A hosts a large number of bright, compact radio sources. As already noted by Pérez-Torres et al. (2009b), the high brightness temperatures displayed by those compact components indicate that they must be nonthermal emitting sources, most likely young radio SNe and SNRs, and a detailed discussion of the radio emission and spectral properties of all these compact sources will be presented elsewhere. The middle and bottom panels of the figure are blow-ups of the inner 8 parsec nuclear region of Arp 299-A, as imaged with the full EVN at 1.7 and 5.0 GHz, and the positions of its compact components, as well as their flux densities, are summarized in Table 1.
The main results from our observations concern the nature of component A0 and, especially, of the complex formed by A1-A5 (lower panel in Figure 1 and Table 1), which we discuss in the next sections.
| Source | Source | Angular sizeb | S1.7 (Jy) c | S5.0 (Jy)c | Spectral index | ||
|---|---|---|---|---|---|---|---|
| Name | Type | (J2000.0) | (J2000.0) | (milliarcsec) | |||
| A0 | SN | 33.6213 | 46.707 | 75 | 30727 | 1.28 | |
| A1 | AGN (core) | 33.6199 | 46.699 | 82248 | 71642 | -0.130.11 | |
| A1b | AGN (jet) | 33.6190 | 46.699 | 31430 | 66 | -1.42 | |
| A1c | AGN (jet) | 33.6183 | 46.695 | 26728 | 66 | -1.27 | |
| A5 | AGN (jet) | 33.6176 | 46.694 | 24628 | 18324 | -0.270.22 |
-
a
Coordinates are given with respect to = 11:28:00.0000 and = 58:33:00.000, and the typical uncertainty is less than 1 mas.
-
b
Upper limits to the deconvolved angular size (Major axis Minor axis, in mas) as obtained using task IMFIT within AIPS, using our 5.0 GHz for all components but A1b and A1c, which were only detected at 1.7 GHz.
-
c
The uncertainty in the reported flux density (and derived spectral index) for the detected compact components corresponds to 1, where was determined by adding in quadrature the off-source r.m.s. in each image and a 5% of the local maxima, to conservatively account for possible inaccuracies in the EVN calibration. Upper limits for undetected sources are three times the off-source r.m.s.
3.1 The young radio supernova A0
Component A0 was identified with an RSN by Neff et al. (2004). A0 showed a strongly inverted spectral index between 2.3 and 8.4 GHz, indicating that it was a very young SN. We already detected it at 5.0 GHz (Pérez-Torres et al. 2009b), more than five years after its discovery at 8.4 GHz, which implied that A0 was a longlasting, slowly evolving, nonstandard RSN (Pérez-Torres et al. 2009b). Our current 5.0 GHz EVN observations show that A0 continues to be very bright, with erg s-1 Hz-1, confirming that it is a longlasting, slowly evolving Type II supernova in a rich, dense surrounding medium. Not detecting A0 at 1.7 GHz also confirms the suggestion by Pérez-Torres et al. (2009b) that its radio emission is being suppressed at low frequencies by a nearby absorber, most likely a foreground H II region in the vicinity of A0. We can characterize the main parameter of this H II region, its emission measure , by assuming an (intrinsic) spectral index typical of Type II SNe in their optically thin phase [; ]; and purely foreground, free-free absorption (). We then obtain 2.2. The at GHz frequencies is proportional to the free-free optical depth and is given by cm-6 pc (Mezger & Henderson 1967), where is in units of K, and in GHz. Assuming the free-free absorber is a purely hydrogen plasma with , we obtain cm-6 pc for the H II close to A0. This value of is very similar to the one obtained for the foreground H II region close to the well studied SN 2000ft (Alberdi et al. 2006; Pérez-Torres et al. 2009a), in the dust-enshrouded galaxy NGC 7469.
3.2 The A1-A5 complex
We detected components A1 and A5, which were already reported at 5.0 GHz by Pérez-Torres et al. (2009b). A1, the brightest compact source detected during our previous 5.0 GHz eEVN observations, continues to be the brightest one at 5.0 GHz ( erg s-1 Hz-1), and is also detected at 1.7 GHz ( erg s-1 Hz-1). Component A5 is also detected at both frequencies. Pérez-Torres et al. (2009b) suggested that A1 could be an SNR, while A5 it was suggested a possible SN, based on its marginal variability at 5.0 GHz (although we could not exclude that A5 was an SNR). However, our new, contemporaneous observations at 1.7 and 5.0 GHz shed new light on their nature, and suggest a rather different scenario.
In fact, A1 and A5 are part of a “global structure”, as clearly shown by our 1.7 GHz EVN observations (see lower panel in Figure 1), where a bridge of radio emission connects them, with two new regions of enhanced emission in between (components A1b and A1c) . The extension of the A1-A5 complex is 3121 mas, corresponding to a linear size of 6.74.6 pc. Within the 1.7 GHz structure, we detect two new components, A1b and A1c, which are not detected at 5.0 GHz more than three times the off-source r.m.s. Nevertheless, detecting them clearly at 1.7 GHz () implies that they are real, steep-spectrum components, whose nature we discuss in the next two sections.
3.2.1 A chain of nested SNe and SNRs in an SSC…?
The spectrum of A1 between 1.7 and 5.0 GHz is very flat (). This spectral index would in principle be compatible with an H II region but, as we already showed in Pérez-Torres et al. (2009b), all compact components in Arp 299-A show brightness temperatures that imply a nonthermal origin for their radio emission. Thus, the flat spectrum shown by A1 could be explained by radio emission from an SNR or, alternatively, from an AGN. How can we distinguish these two scenarios? To answer this question we must consider A1 in the context of the complex it is part of, together with components A1b, A1c, and A5. As with A1, the brightness temperatures of the other components rule out a thermal origin for their radio emission. In principle, the spectral indices of those components (see Table 1) are compatible with A1b and A1c being young supernovae in their optically thin phase, and A5 being another SNR, all of them part of a super star cluster (SSC).
The existence of SSCs in Arp 299-A has been demonstrated by their detection using 2.2-m adaptive optics imaging (Lai et al. 1999), and further evidence comes from Hubble Space Telescope (HST) FOC and NICMOS images, which reveal a population of young (415 Myr) stellar clusters in the central regions of Arp 299-A (Alonso-Herrero et al. 2000). High-resolution near-infrared spectra of the nuclear starburst of M 82 (McCrady et al. 2003) have shown that its SSCs have typical radii of 23 pc, and masses that range from M⊙ up to (1-2) M⊙. The size of the A1-A5 complex is 6.7 4.6 pc, in agreement with expectations for SSC sizes. Therefore, a possible scenario is one where a young SSC has resulted in two young, recently exploded SNe (A1b and A1c), and two SNRs (A1 and A5). In this case, the steepness of the spectral indices for sources A1b and A1c can only be explained as from very recently exploded ( yr) core-collapse supernovae. Furthermore, to estimate the age of the SNR candidates A1 and A5, we use upper limits to their (deconvolved) angular size (column 5 in Table 1). A1 and A5 have a maximum angular radius of 6.1 and 6.9 mas, which correspond to a linear size of 1.3 and 1.5 pc, respectively. Assuming an average expansion speed of 3000 km s-1for both SNRs, those sizes correspond to kinematic ages of 430 yr for A1 and 490 yr for A5.
In summary, if the A1-A5 complex is an SSC, it has yielded four bright radio supernovae in the past 500 yr. Now, this is very unlikely to happen in an SSC of just 3.4 pc radius whose mass is unlikely to be higher than (1-2) M⊙. Indeed, evolutionary models for the radio emission in starbursts by Perez-Olea & Colina (1995) show that the SN rate in an instantaneous burst can be as high as 20 yr-1M⊙-1 up to an age of 6 Myr, and about 10yr-1M⊙-1 at an age of 9-15 Myr. Thus, an SSC of 106M⊙would yield 1 SN every 500 yr at an age of 6 Myr, and 1 SN every 1000 yr at an SSC age of 9-15 Myr. Therefore, if A1-A5 were SNe and SNRs exploding in a SSC, we should have expected to detect at most one SN/SNR in the past 500 yr, whereas we find four. The probability of detecting two (young) SNe in the past 20 yr, and two SNRs with ages of 430 and 490 yr in the past 500 yr is less than . All this evidence seems to rule out an SSC scenario for the A1-A5 complex.
3.2.2 …Or the long-sought AGN in Arp 299-A?
We show in the next paragraph that a much more plausible scenario for the A1-A5 complex is that of an AGN, where A1–the brightest compact source at both frequencies in the nuclear and circumnuclear regions of Arp 299-A– is identified with the core of the AGN in Arp 299-A, while components A1b, A1c, and A5 are jet components (see Figure 1). There are strong grounds for this scenario:
(i) A1-A5 displays a core-jet morphology, typical of AGNs. (ii) The two-point spectral indices of the A1-A5 complex (see Table 1) agree well with expectations from an AGN. In this scenario A1, which has the flattest spectrum between 1.7 and 5.0 GHz, would be the core, and A1b, A1c, and A5 would be jet components. (iii) There is evidence of strong flux density variability of A1 at 2.3 and 8.4 GHz between 2002 and 2003 (Neff et al. 2004; Ulvestad 2009). Figure 5 of Ulvestad (2009) shows little variation for A1 starting from 2004, or even a slight decrease (increase) in flux density at 2.3 (8.4) GHz. On the other hand, there is no evidence for significant variability at 5.0 GHz between April 2008 and June 2009 (see Pérez-Torres et al. 2009b and Table 1). This behavior is at odds with an SN origin for the radio emission of A1, and is more easily reconciled within an AGN scenario. In addition, by combining the data from Ulvestad (2009) with ours and assuming no variability between 2005 and 2009 at cm-wavelengths, we find that the spectrum of A1 must have a turnover frequency between 1.7 and 5.0 GHz, as expected for the core of an AGN whose radio emission is partially self absorbed. (iv) The radio luminosity of the A1-A5 complex between 1.7 and 8.4 GHz is erg s-1, typical of LLAGNs. (v) The ratio of (5 GHz) radio-to-X ray (soft) luminosity (Terashima & Wilson 2003) for the A1-A5 complex in Arp 299-A is typical of LLAGNs. From Table 1, we obtain erg s-1. The combined absorption corrected X-ray luminosity for the X-ray sources discovered by Zezas et al. (2003) in Arp 299-A is erg s-1. This results in a value of , which agrees closely with expectations from an LLAGN (see Figure 4 of Terashima & Wilson 2003).
We therefore identify the A1-A5 complex with the AGN in Arp 299-A. In this case, the cm-radio luminosity of the AGN in Arp 299-A is very similar to the one displayed by the LLAGN in M 81, which is the closest galaxy with an active nucleus. The core of M 81 also presents a faint, one-sided jet, with a flat spectrum near the core and a steep spectrum along the jet (Bietenholz et al. 2004). Furthermore, cm-VLBI observations of the merger system NGC 6240 (Gallimore & Beswick 2004) and mm-Plateau-de-Bure interferometer observations of the prototypical ULIRG Arp 220 (Downes & Eckart 2007) have suggested the coexistence of both AGN and starburst in their nuclear regions. Thus, our discovery suggests that both starburst and AGN are frequently associated in merging systems.
4 Summary
We imaged with milliarcsecond resolution the inner eight parsecs of the nuclear region in Arp 299-A, using contemporaneous EVN observations at 1.7 and 5.0 GHz. At 5.0 GHz, we detect components A0, A1, and A5, as previously detected by Pérez-Torres et al. (2009b). At 1.7 GHz, A1 and A5 are also detected, but not A0. In addition, two new components between A1 and A5 (A1b and A1c) are detected at 1.7 GHz, forming a complex.
We find that the morphology, spectral index, radio luminosity, and radio-to-X ray luminosity ratio of the A1-A5 complex are consistent with that of an LLAGN, and rules out the possibility that it consists of a chain of young RSNe and SNRs in a young SSC. We therefore conclude that A1 is the long-sought AGN in Arp 299-A. Since Arp 299-A had long been thought of as a pure starburst, our finding of a buried, low-luminosity AGN in its central region, coexisting with a recent burst of starformation, suggests that both a starburst and AGN are frequently associated phenomena in mergers. In this case, our result is likely to have an impact on evolutionary scenarios proposed for AGN and the triggering mechanism of activity in general.
Finally, we also note that component A0, previously identified as a young RSN, is not seen at our low-frequency observations, which implies there is a foreground absorbing H II region. It is remarkable that this RSN exploded at the mere distance (projected) of two parsecs from the putative AGN in Arp 299-A, which makes this supernova one of the closest to a central supermassive black hole ever detected. This result may also be relevant to accreting models in the central regions of galaxies, since it is not easy to explain the existence of very massive, supernova progenitor stars so close to an AGN. While seemingly contradictory, this could explain the low-luminosity of the AGN we see in Arp 299-A. In fact, since massive stars shed large amounts of mechanical energy into their surrounding medium, thereby significantly increasing its temperature, those massive stars would hinder the accretion of material to the central black hole, which could in turn result in a less powerful AGN than usual.
Acknowledgements.
We are grateful to Luis Colina and Emilio Alfaro for useful discussions and to the anonymous referee for suggestions and comments that have improved the science of our paper. The EVN is a joint facility of European, Chinese, South African and other radio astronomy institutes funded by their national research councils. MAPT, AA, and CRC acknowledge support by the Spanish MICINN through grant AYA2009-13036-CO2-01. This research has been also partially funded by the Autonomic Government of Andalusia under grants P08-TIC-4075 and TIC-126. MAPT is also grateful for financial support from the Spanish Research Council (CSIC) through grant 200950I139.References
- Alberdi et al. (2006) Alberdi, A., Colina, L., Torrelles, J. M., et al. 2006, ApJ, 638, 938
- Alonso-Herrero et al. (2009) Alonso-Herrero, A., Rieke, G. H., Colina, L., et al. 2009, ApJ, 697, 660
- Alonso-Herrero et al. (2000) Alonso-Herrero, A., Rieke, G. H., Rieke, M. J., & Scoville, N. Z. 2000, ApJ, 532, 845
- Ballo et al. (2004) Ballo, L., Braito, V., Della Ceca, R., et al. 2004, ApJ, 600, 634
- Bietenholz et al. (2004) Bietenholz, M. F., Bartel, N., & Rupen, M. P. 2004, ApJ, 615, 173
- Della Ceca et al. (2002) Della Ceca, R., Ballo, L., Tavecchio, F., et al. 2002, ApJ, 581, L9
- Downes & Eckart (2007) Downes, D. & Eckart, A. 2007, A&A, 468, L57
- Fixsen et al. (1996) Fixsen, D. J., Cheng, E. S., Gales, J. M., et al. 1996, ApJ, 473, 576
- Gallimore & Beswick (2004) Gallimore, J. F. & Beswick, R. 2004, AJ, 127, 239
- Henkel et al. (2005) Henkel, C., Peck, A. B., Tarchi, A., et al. 2005, A&A, 436, 75
- Keel & Wu (1995) Keel, W. C. & Wu, W. 1995, AJ, 110, 129
- Lai et al. (1999) Lai, O., Rouan, D., Rigaut, F., Doyon, R., & Lacombe, F. 1999, A&A, 351, 834
- McCrady et al. (2003) McCrady, N., Gilbert, A. M., & Graham, J. R. 2003, ApJ, 596, 240
- Mezger & Henderson (1967) Mezger, P. G. & Henderson, A. P. 1967, ApJ, 147, 471
- Neff et al. (2004) Neff, S. G., Ulvestad, J. S., & Teng, S. H. 2004, ApJ, 611, 186
- Perez-Olea & Colina (1995) Perez-Olea, D. E. & Colina, L. 1995, MNRAS, 277, 857
- Pérez-Torres et al. (2009a) Pérez-Torres, M. A., Alberdi, A., Colina, L., et al. 2009a, MNRAS, 399, 1641
- Pérez-Torres et al. (2009b) Pérez-Torres, M. A., Romero-Cañizales, C., Alberdi, A., & Polatidis, A. 2009b, A&A, 507, L17
- Sanders et al. (2003) Sanders, D. B., Mazzarella, J. M., Kim, D.-C., Surace, J. A., & Soifer, B. T. 2003, AJ, 126, 1607
- Tarchi et al. (2007) Tarchi, A., Castangia, P., Henkel, C., & Menten, K. M. 2007, New Astronomy Review, 51, 67
- Terashima & Wilson (2003) Terashima, Y. & Wilson, A. S. 2003, ApJ, 583, 145
- Ulvestad (2009) Ulvestad, J. S. 2009, AJ, 138, 1529
- Zezas et al. (2003) Zezas, A., Ward, M. J., & Murray, S. S. 2003, ApJ, 594, L31