On the Nature of the Compact Object in SS 433. Observational Evidence of X-ray Photon Index Saturation
Abstract
We present an analysis of the X-ray spectral properties observed from black hole candidate (BHC) binary SS 433. We have analyzed Rossi X-ray Time Explorer (RXTE) data from this source, coordinated with Green Bank Interferometer/RATAN-600. We show that SS 433 undergoes a X-ray spectral transition from the low hard state (LHS) to the intermediate state (IS). We show that the X-ray broad-band energy spectra during all spectral states are well fit by a sum of so called “Bulk Motion Comptonization (BMC) component” and by two (broad and narrow) Gaussians for the continuum and line emissions respectively. In addition to these spectral model components we also find a strong feature that we identify as a ”blackbody-like (BB)” component which color temperature is in the range of 4-5 keV in 24 IS spectra during the radio outburst decay in SS 433. Our observational results on the ”high temperature BB” bump leads us to suggest the presence of gravitationally redshifted annihilation line emission in this source. In fact this spectral feature has been recently reproduced in Monte Carlo simulations by Laurent and Titarchuk. We have also established the photon index saturation at about 2.3 in index vs mass accretion correlation. This index-mass accretion correlation allows us to evaluate the low limit of black hole (BH) mass of compact object in SS 433, solar masses, using the scaling method using BHC GX 339-4 as a reference source. Our estimate of the BH mass in SS 433 is consistent with recent BH mass measurement using the radial-velocity measurements of the binary system by Hillwig & Gies who find that solar masses. This is the smallest BH mass found up to now among all BH sources. Moreover, the index saturation effect versus mass accretion rate revealed in SS 433, like in a number of other BH candidates, is the strong observational evidence for the presence of a BH in SS 433.
1 Introduction
The famous object SS 433 (V 1343 Aql) holds a special place in late twenty century Astronomy as the first microquasar discovered in our Galaxy [see reviews by Margon (1984) and Fabrika (2004)]. Observations of SS 433 have been carried out in all energy ranges during more than 30 years. Its key observational feature is the 162.5 day precession period of the jets that is revealed by the lines features. The radial velocity curves of these lines are well described by a Kinematical Model which reveals key parameters of the jets v=0.26c, and i=79∘ (Margon, 1984). Moreover, Romney et al. (1987) used and combined these results with the radio observations of the associated SNR W50 which allowed them to estimate distance of 5 kpc to SS 433.
SS 433 is an X-ray/optical binary with Algol type orbital eclipses. This source is characterized by two distinct spectral states: the quiescent hard state in which the persistent jet flow takes place and the soft state when massive jet blobs are ejected (Fielder et al., 1987). While the quiescent state has been well studied with numerous X-ray missions, only a few massive jet ejection events were seen so far simultaneously with the X-ray soft state [Safi-Harb & Kotani (2003), Band et al. (1989)]. Because the ejection of a massive jet blob is a rare (in average two times per year) and a short (approximately for ten days) event, we only have observations for the part of this jet ejection.
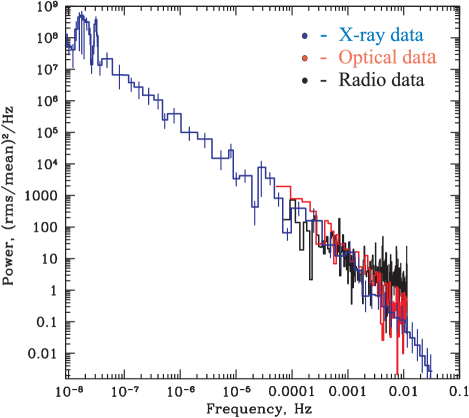
SS 433 shows many kinds of variability related to regular (orbital and precessional) and irregular (flaring) activities. Although precession, binary orbital and nutation periods (, , respectively) are well known, but a noticeable variability associated with shorter scales is poorly investigated. It is worth noting that the fast variability on time scale of a few minutes was investigated by Zwitter et al. (1991) and Goranskij et al. (1987) in the optical V-band. More recently X-ray fast variability of 50 seconds time scale during flaring stage was found using RXTE observations by Kotani et al. (2002). Power spectrum of SS 433 is well presented and approximated by power law () in the range of the Hz according to X-ray timing data analysis performed by Revnivtsev et al. (2006). They also demonstrated that at frequencies lower than Hz the same variability pattern takes place in the optical, radio and X-ray spectral bands (see Fig. 1 of that paper).
Many questions regarding the complex behavior of SS 433 during outburst states as well as the nature of this compact object and its mass are still not answered. However there is no shortage of models which are based on radio, optical and X-ray variations of radiation detected from SS 433 [see e.g. Marshall et al. (2002), Fabrika (2004), Safi-Harb & Kotani (2003)].
The variation in mass estimates of the compact (), optical () objects and the mass ratio () are quite broad. Kawai et al. (1989) and later Antokhina at el. (1992) using GINGA observations of SS 433 estimated and respectively. On the other hand Kotani et al. (1996) using ASCA observations found in the frame of the precessing jet model with taking into account thermal adiabatic cooling of the jets (Brinkmann et al., 1991). Later high-resolution observations by Gies et al. (2002) found the presence of absorption lines in the spectrum of the optical A (A7Ib) supergiant companion. These orbital Doppler shifted absorption lines and stationary He II emission from the companion allowed to estimate the mass ratio , implying the binary masses and in SS 433 [see Hillwig & Gies (2008) for details]. Thus the average mass ratio inferred from this X-ray data analysis is smaller than that inferred from optical observations .
One comes to the conclusion that in the literature there is a large variation in the mass estimates of the compact object (), secondary star () and their mass ratio () in SS 433. The nature of the compact object was inferred using the mass estimate or its upper limit. No other strong arguments were used to determine the nature of the compact object in SS 433 which is an eclipsing X-ray binary system, with the primary most likely a black hole, or possibly a neutron star [see e.g. Cherepashchuk (2002)].
In this work we apply a substantially new approach for diagnosing the nature of compact object in SS 433. In §2.1 we present details of radio and X-ray observations of SS 433. Analysis of X-ray spectra are shown in §2.2. We discuss X-ray spectral evolution in SS 433 in §3. X-ray spectral properties as a function of orbital phase are investigated in §4. The results of timing and power spectrum analysis are presented in §5. We consider an interpretation of observational results and show our arguments for BH presence in SS 433 in §6. We make discussion and concluding remarks in §7.
2 Observations and Data Reduction
2.1 Listing of X-ray observations used for data analysis
We analyzed the archival data collected by PCA/RXTE (Bradt et al., 1993) which were obtained in time period from April 1996 to December 2006. These data allow us to investigate SS 433 in the broad X-ray energy band (3 – 150 keV) during quiescent and outburst states. The RXTE data for SS 433 are available through the HEASARC public archive (http://heasarc.gsfc.nasa.gov) at the NASA Goddard Space Flight Center (GSFC). As we have already mentioned SS 433 shows continuous (associated with quiet state) and sporadic (associated with active state) variability. For investigation of the outburst state and for comparing it with the quiescent state we selected only observations during uneclipsed intervals of the binary orbital period. In fact, X-ray eclipse occurs around optical primary minima at phases . As a result we only used observations taken at interval to exclude the eclipse orbital modulation. In total, this type of observations includes 90 episodes of outside of eclipse phases. Moreover, 27 observations during eclipses taken at different precessional and orbital phases were used for spectral and timing analysis of orbital modulation effects.
Precessional ephemerids were taken from Fabrika et al. (2004). The moment of maximal separation between emission lines (T3) was taken to be =2443507.47 JD, the precessional period =162.375 days, the orbital period =13.08211 days, the moment of primary optical eclipse =2450023.62 JD (Goranskij et al., 1998).
Standard tasks of the HEASOFT/FTOOLS 5.3 software package were utilized for data processing. We used methods recommended by RXTE Guest Observer Facility according to the RXTE Cookbook (see http://heasarc.gsfc.nasa.gov/docs/xte/recipes/cook book.html). For spectral analysis we used PCA Standard 2 mode data, collected in the 3 – 20 keV energy range. The standard dead time correction procedure has been applied to the data. To construct broad-band spectra, HEXTE data have been also used. We subtracted background corrected in off-source observations. To exclude the channels with largest uncertainties only data in 20 – 150 keV energy range were used for the spectral analysis. In Table 1 we list the groups of RXTE observations covering the source evolution from quiescent to outburst states. We also used public data from the All-Sky Monitor (ASM) on-board RXTE. The ASM light curves (2-12 keV energy range ) were retrieved from the public RXTE/ASM archive at HEASARC 111http://xte.mit.edu/ASM_lc.html.
In the present Paper, we have analyzed X-ray spectra during quiescent and outburst states with reference to simultaneous radio and optical observations. The monitoring RATAN-600 Radio Telescope (2-8 GHz) data in the 1996 – 2006 period were available through the public archive (http://cats.sao.ru/satr/BH). We also used radio observations by Green Bank Interferometer, NRAO222http://www.gb.nrao.edu/fdocs/gbi/arcgbi obtained from 1996 to 1998 at 2.25 and 8.3 GHz and simultaneous V-band photoelectric photometric observations. Details of optical telescopes, reduction techniques and compilation methods are given by Goranskij et al. (1998).
Additionally, we analyzed the INTEGRAL/IBIS/ISGRI spectra in flaring state (2004) of SS 433, that were coordinated with the RXTE observations. We have used the version 8.0 of the Offline Science Analysis (OSA) software distributed by INTEGRAL Science Data Center [ISDC, http://isdc.unige.ch, Corvoisier et al. (2003)].
We also present a comparison of the SS 433 data with that for GRS 1915+105 obtained during BeppoSAX observations. We used two BeppoSAX detectors (Medium-Energy Concentrator Spectrometer (MECS) and a Phoswich Detection System (PDS)) for this analysis. The SAXDAS data package was utilized for performing data analysis. We process the spectral analysis in the good response energy range taking into account satisfactory statistics of the source: 1.8 – 10 kev for MECS and 15 – 150 keV for PDS.
2.2 Spectral analysis
SS 433 has long been of great interests in X-ray Astrophysics, and has been observed early on with many satellites such as HEAO-1 (Marshall et al. 1979), EXOSAT (Watson et al. 1986), Tenma (Matsuoka et al. 1986), and Ginga (Kawai et al. 1989). Using HEAO-1, Marshall et al. were the first to demonstrate that SS 433 is an X-ray source. The HEAO-1 continuum was sufficiently modeled as thermal bremsstrahlung with kT = 14.3 keV, and emission due to Fe-K was detected near 7 keV. The ASCA satellite, which carried X-ray CCD cameras for the first time, detected many pairs of Doppler-shifted emission lines from ionized metals, such as Si, S, Ar, Ca, Fe, and Ni, originating from the twin jets (Kotani et al. 1994). The emission lines were also resolved with the Chandra HETGS, which were found to have Doppler widths of 10005000 km s-1 (Marshall et al. 2002; Namiki et al. 2003; Lopez et al. 2006). The broad band continuum (up to 100 keV) is approximated by a thermal bremsstrahlung spectrum with a temperature of 1030 keV, depending on whether SS 433 is in or out of eclipse (Kawai et al. 1989; Cherepashchuk et al. 2005). Additional complex features were detected from the XMM spectra, however, which could be Compton-scattered emission from the jet base (Brinkmann et al. 2005) or an iron-K absorption edge due to partial covering (Kubota et al. 2007). From the width of an eclipse in the 2550 keV band with INTEGRAL, Cherepashchuk et al. (2007) and Krivosheyev et al. (2009) propose that a hot extended corona around the accretion disk is responsible for the hard X-ray emission via thermal Comptonization with a temperature of 20 keV. High-quality X-ray spectra covering the broad band are critical in establishing an interpretation of the high energy spectra of SS 433.
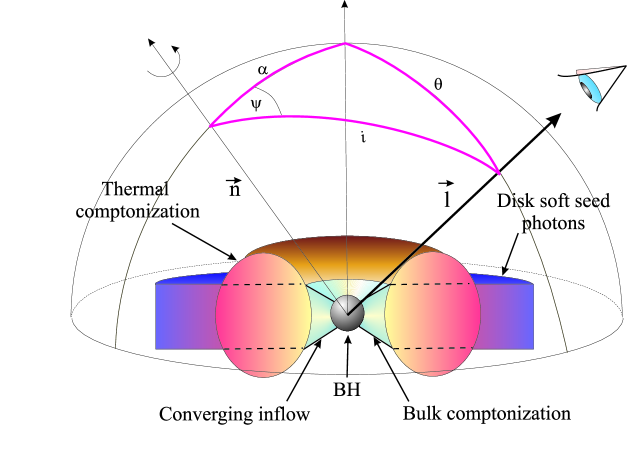
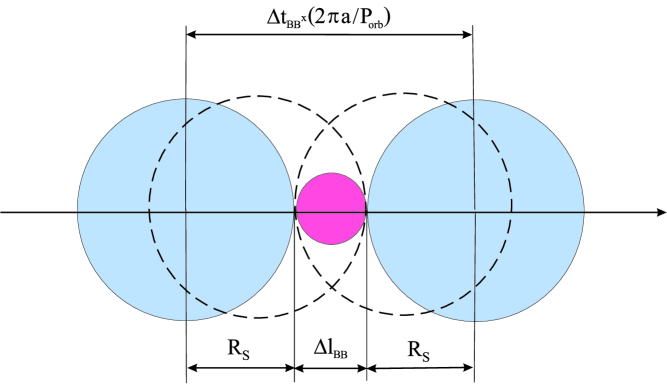
In our study we model the broad band source spectra in XSPEC using an additive model consisting of sum of the so called bulk motion Comptonization (BMC) model and two Gaussian line components. The BMC model is a generic Comptonization model which can be applied to upscattering of soft photons injected in a hot cloud. This model consists of two parts where the first part is a direct blackbody (BB) component and the second one is a convolution of the fraction of the BB component with a broken power law, the upscattering Green function. The spectral index of the blue wing is much smaller than that of the red wing . The shape of the Green function (broken power law) is generic and independent of the type of Comptonization, thermal or nonthermal. The name of the model (BMC) has only a historical sense dating to 1997 [see Titarchuk et al. (1997)] when the model was first applied to case of the bulk motion Comptonization. However this model can be applied to any type of Comptonization, thermal or nonthermal but it should be, in principle, combined with exponential cutoff which is related to average plasma energy, for example, plasma temperature for the thermal Comptonization or kinetic energy of the matter in the case of the converging (bulk inflow) Comptonization. In this Paper we consider a scenario related to our model (see Fig. 1) where the Compton cloud along with converging flow are located in the innermost part of the source and a Keplerian disk extends from the Compton cloud (CC) to the optical companion.
As we point out ASCA and Chandra detected many lines of various elements in the soft X-ray band of spectrum of SS 433. Particularly, iron lines, Fe XXV – Fe XXVI dominate at energies 6.5E7 keV and these lines show a double structure due to jet Doppler shifts. In addition to iron line emission one can see the line emission related to hydrogen - and helium-like ions of Mg, Si, S, Ar, Ca and Ni which display a double structure also. These line signatures indicate that the lines are formed in the relativistic jet configuration. Along with these lines there is an appreciable emission feature at 6.4 keV which is visible in the X-ray spectrum of SS 433 [Kotani et al. (1996); Seifina (2000)]. This line is not subjected to Doppler shifting. Thus we want to emphasize that using the forms of these lines we can see features of “moving” and “stationary” structures of material surrounding SS 433.
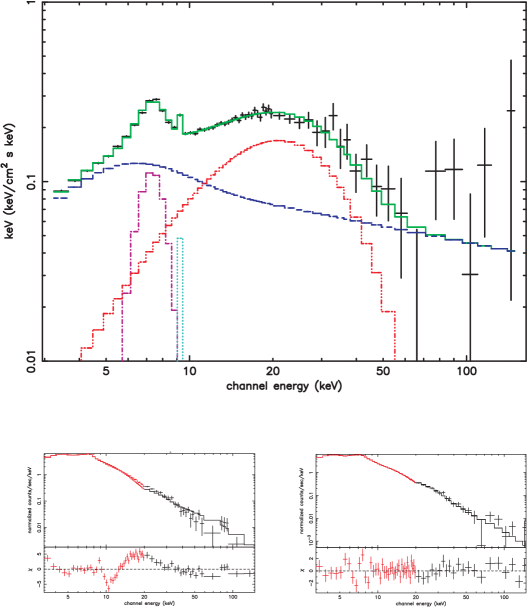
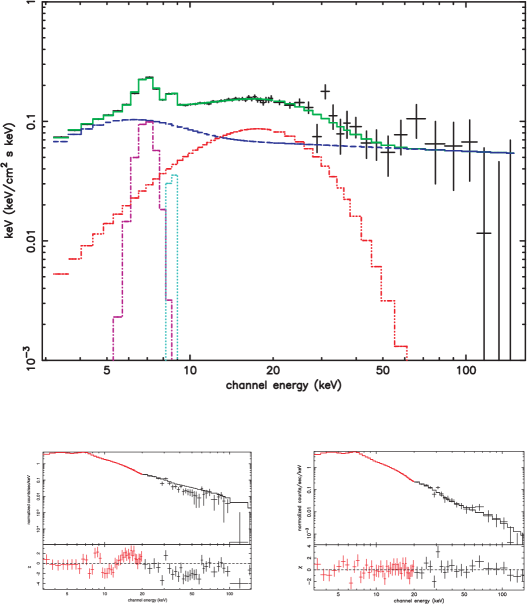
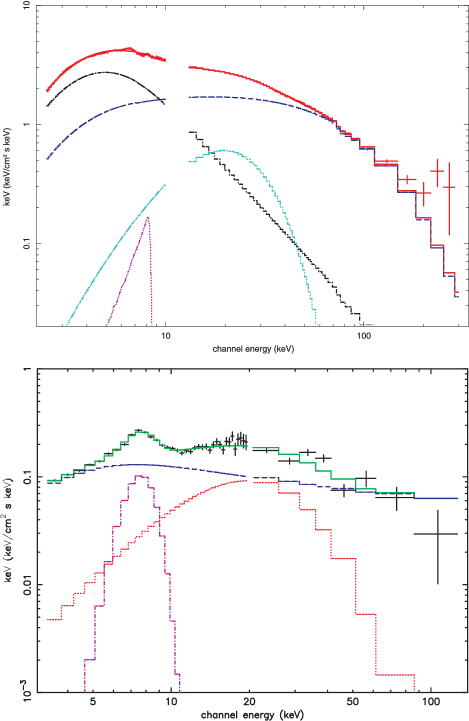
However the identification and precise theoretical reproduction of the line composition with RXTE is problematic because of its low energy resolution. As a test trial we added one Gaussian component to fit the spectrum varying the width and normalization of the line and we found that the width of this Gaussian feature roughly ranges from 0.3 to 1 keV. In quite a few cases the spectral fits using one Gaussian component provide very wide residuals extended from 6 to 9 keV. However, after adding a second narrow Gaussian component (in the 6 – 9 keV range) the fit quality has been significantly improved. The energies of the first and second Gaussian components and are presented in Table 3. For the first Gaussian changes from 6.5 to 6.9 keV while the range of the second Gaussian varies from 7.1 to 9 keV. In some cases we see a wide residual taking place around 20 keV which can be a signature of ”high temperature bbody-like” spectral component of temperature in the range of 4-5 keV. Thus we use our XSPEC model as wabs*(bmc+Gaussian+Gaussian+bbody) for fitting of SS 433 spectra. In particularly we use a value of hydrogen column cm2 which was found by Filippova et al. (2006) in calculations of XSPEC model wabs.
The best-fit parameters of the source spectrum are presented in Tables 3 – 6. For the BMC model the parameters are spectral index (photon index ), color temperature of the blackbody-like injected photons , related to the Comptonized fraction [] and normalization of the blackbody-like component . We find that color temperature is about 1 keV for all available RXTE data and thus we fix a value of at 1 keV. When the parameter we fix (see Table 3, 5), because the Comptonized fraction 1. The variations of do not improve fit quality any more. A systematic error of 1% has been applied to the analyzed X-ray spectra. we applied this systematic error to the analyzed RXTE spectra in accordance to the current version of RXTE Cookbook (see http://heasarc.gsfc.nasa.gov/docs/xte/recipes/cook book.html) following to recommended methods by RXTE Guest Observer Facility.
In Figure 1 we present a suggested geometry of X-ray source in SS 433 (see more explanation of geometry below).
Similar to the ordinary bbody XSPEC model, the normalization is a ratio of the source (disk) luminosity to the square of the distance
| (1) |
The adopted spectral model shows a very good performance throughout all of the data set used in our analysis. Namely, the value of reduced -statistic , where is a number of degree of freedom for a fit, is less or around 1.0 for most observations. For a small fraction (less than 2%) the spectra with high counting statistic reaches 1.5. However, it never exceeds a rejection limit of 2.0.
3 Evolution of SS 433 X-ray spectra during outbursts
We have established general tendencies of quiescent-outburst behavior of SS 433 based on spectral parameter evolution of X-ray emission in energy range (3-150) keV using RXTE/P-CA/HEXTE data. We have also found correlation between X-ray emission of SS 433 and radio patterns observed by RATAN-600 in the range 1-11 GHz and by Green Bank Interferometer at 2.25, 8.3 GHz.
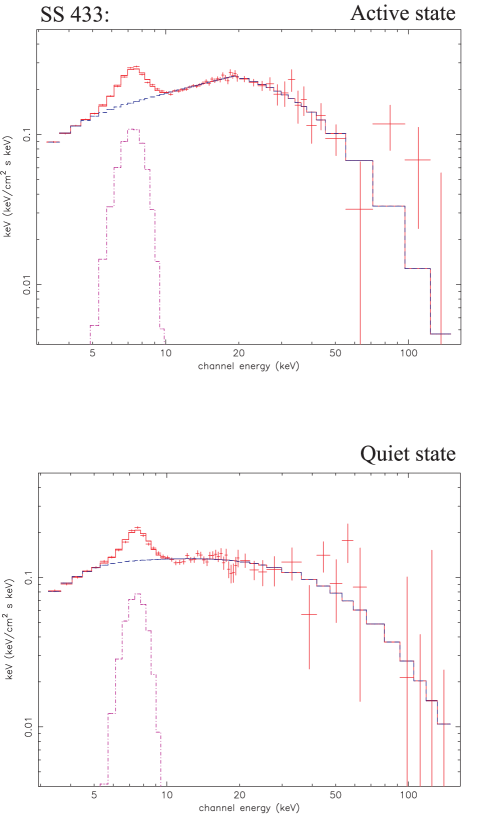
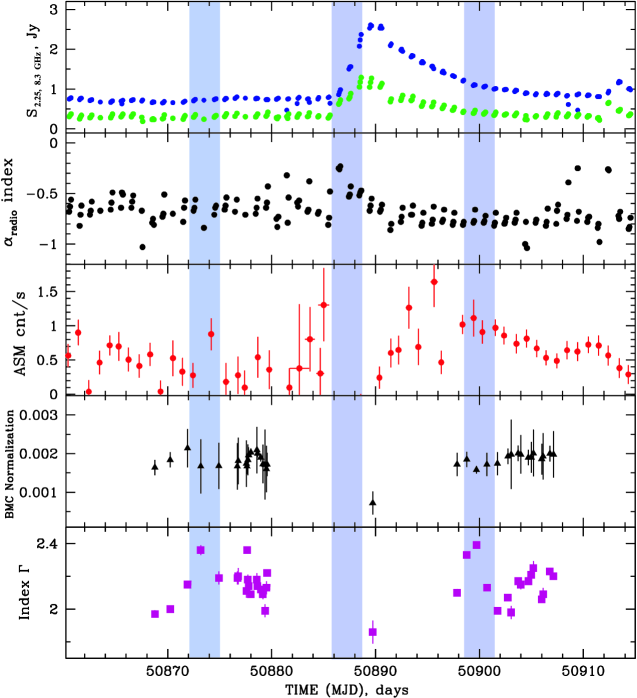
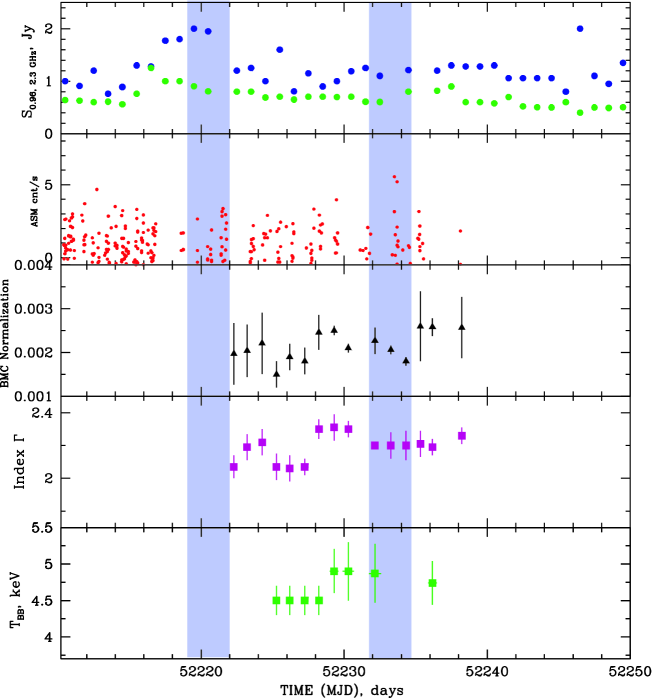
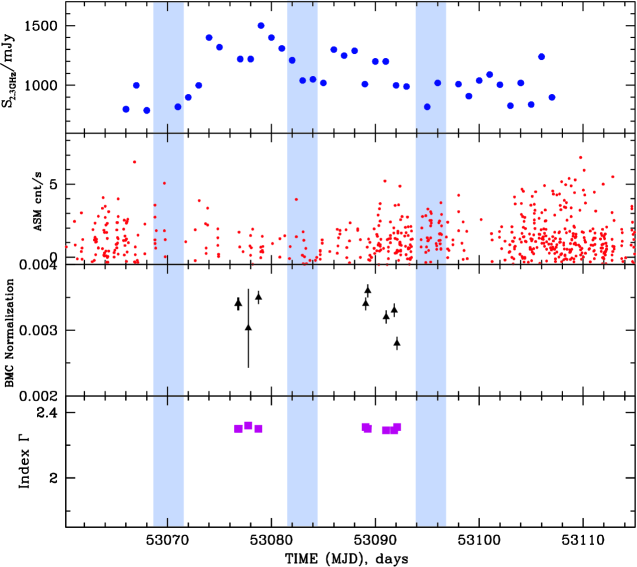
We identified common features of ouburst behavior of SS 433 based on three available outbursts and on two outburst decay sets. According to general BH state classification [see for example Shaposhnikov & Titarchuk (2009), hereafter ST09] SS 433 is mostly seen in the intermediate (IS) state. Different patterns of SS 433 X-ray spectra are listed at Table 3: i) IS spectra with (see also lower panel of Fig. 2); ii) sum of BMC spectrum with and high temperature “bbody” component found in 10-50 keV energy range (see Figs. 3-4).
Ten days before radio outburst, SS 433 being in IS a stable low soft (ASM) X-ray flux (see Fig. 5) is followed by a X-ray flux rise reaching its maximum just two days before the radio flare. Probably at the moment of radio peak, MJD=50890 the X-ray flux reaches its minimum (BMC normalization, ) and when X-ray spectrum becomes harder (photon index ). It is worth noting that spectral index of radio emission has its maximal value at a time close to X-ray outburst (see Fig. 5, at MJD=50886). Note the radio spectrum is harder just a few days before the radio maximum. Then, after several days of the radio maximum, we see the X-ray flux increases while the radio flux substantially decreases, at least by factor 2 (see Fig. 5 and Table 3).
In Figs. 6, 7 we demonstrate an evolution of the radio, X-ray flux and X-ray spectral parameters and with time for different time intervals. Notably in Fig. 6 we present the best-fit color temperature related to “high temperature BB” bump which is sometimes seen in IS spectra. Also in Figs. 57 we show a transition between intermediate and soft states given that photon index varies between 1.9 and 2.4.
Thus in Figures 57 we present the behavior of SS433 during corresponding outbursts and spectral transitions using i. the BMC normalization, ii. the photon index, iii. ASM X-ray flux, and sometimes when they are available, iv. GBI/RATAN-600 radio flux, v. radio spectral index (in case of GBI observations) and the color temperature (in the case of the occurrence of ‘’high temperature Black body”-like feature).
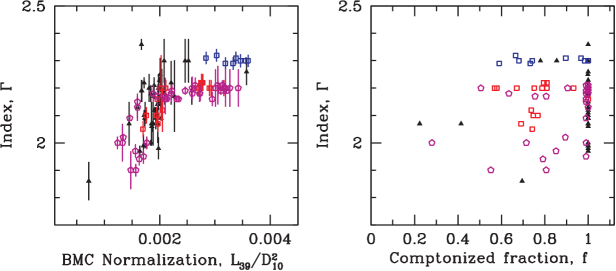
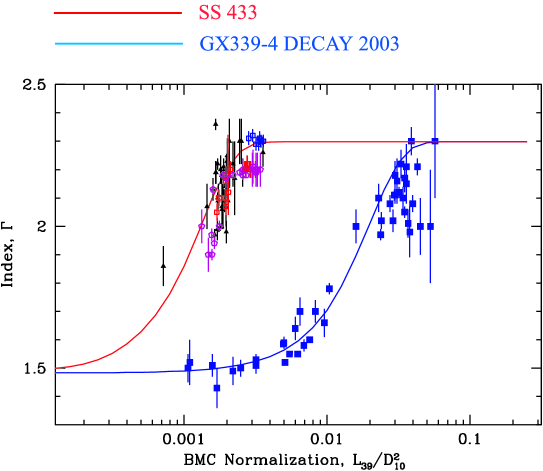
The diagram of photon index versus BMC-normalization forms the track shown in Fig. 8 for all observations except ones during orbital eclipses. The rising part of the correlation is seen in both precession periods and outburst transitions. The upper saturation part of the correlations is only seen during outburst transitions. Note that in the cases of different outbursts of SS 433 the levels of photon index saturation are also different. For example, the 2004 outburst (blue square) shows the saturation level around 2.3, while the 2005 – 2006 outbursts (crimson and red circles) saturates at lower level of 2.2. Comptonization fraction shown in the right hand panel of Fig. 8 is high in most of cases. This means that in most cases the soft disk radiation of SS 433 is subjected to reprocessing in a Compton Cloud and only a small fraction of disk emission component () is directly seen. Thus the energy spectrum of SS 433 during all states is dominated by a Comptonized component seen as a power-law hard emission in the energy range from 3 to 70 keV, while the direct disk emission is not seen in all detected spectra.
4 Spectral properties as a function of orbital phase
4.1 Detection of “high temperature BB-like” bump
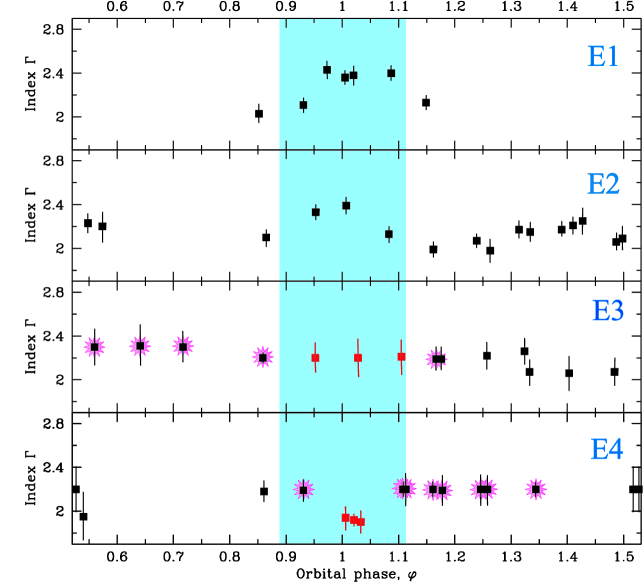
The “BB-like” feature has been found in 24 spectra of SS 433 among of all available data (R2, R3, R5-R7). Note that during 2004 outburst (R5 set) “high temperature BB-like” bump found in 10-40 keV energy range of RXTE has been also detected by ISGRI/IBIS detector onboard INTEGRAL satellite during simultaneous with RXTE observation (ID 90401-01-01-01). For two time intervals (MJD=52225-52238, 53579-53588) this feature is detected in spectra near the primary eclipse. It has been visible before and after the primary eclipse, while it is not seen during the central phases of the primary eclipse. This screening effect with respect to orbital phases is clearly seen in two lower panels (E3 and E4) of Fig. 9. Blue vertical strip marks the interval of the primary eclipse made according to optical ephemerids (Goranskij et al., 1998). Points marked with rose oreol correspond to spectra fitted by the model which includes ”high-temperature BB-like” component (for details see Fig. 3, 4 and Tables 4-7). Red points in Fig. 9 (see two lower panels) correspond to observations during primary eclipse when the ”BB-like” component is not seen, while it has been found before and after the eclipse. Although observations are distributed more or less uniformly with precession phase, the ”BB” bump feature is seen generally at ”disk face-on” position [ (E3), (E4), Fig. 9], when the precessing disk is open and the innermost part of the disk is more visible by the Earth observer.
Thus we argue that the ”BB-like” feature is better detected at ”disk face-on” position () than that during other precession phases. Moreover we have found the total eclipse of ”BB” bump during the primary eclipse when the compact object is obscured by the normal star. In other words, we suggest that localization of ”BB” bump feature emission should be better identified during the direct observation of the innermost source region near the compact object (CC).
However this “BB” component can be smeared out by photon scattering if optical depth of Compton cloud is much greater than 1. That could be the case during observations for MJD=50191-50194 (E1) and 50897-50907 (E2) (see Fig. 9).
4.2 Softening of spectra at some particular orbital phases
The relative softening of the spectrum was found in the range of for two orbital cycles of SS 433 (see Fig. 9). Softening of X-ray spectra is seen when the compact hard emitting region, presumably related to the central parts of the disc, obscured by the donor (optical) star and thus the normalization of X-ray spectrum is suppressed due to the eclipse. This relative spectral softening is clearly seen at MJD=50191-50194 (E1), 50897-50907 (E2) (see two upper panels of Fig. 9) when the noticeable increase of photon index at MJD=50192.7 () occurs with respect of that during the rest of eclipse interval () (see E1 panel in Fig. 9). The similar behavior of index is seen in E2 panel where the noticable increase of photon index takes place at MJD=50899.7 with respect of that when during the rest of the eclipse interval.
5 Timing analysis
The RXTE light curves were analyzed using the powspec task from FTOOLS 5.1. The timing analysis RXTE/PCA data was performed in the 2-15 keV energy range using the binned mode. We generated power density spectra (PDS) with 16-second time resolution. We subtracted the contribution due to Poissonian statistics. To model PDS we used QPD/PLT plotting package.
We also analyzed optical and radio light curves to compare them with X-ray curve. Timing analysis of all available data of SS 433 demonstrates power-law PDSs of index around 1.5 in three energy bands (see Fig. 10): X-ray (blue), 2.25 GHz radio (black), V-optical (red). This result is in an agreement with previous results by Revnivtsev et al. (2006) who found that the SS 433 power spectra of radio, optical and X-ray variabilities continue with the same power law from Hz up to Hz.
Such an extended behaviour of power spectra is well known for a number of X-ray binaries. For instance, Churazov et al. (2001) found that Cyg X-1 demonstrated the similar power law component at Hz in X-ray energy band. An extensive study of low mass X-ray binary systems showed that such a power law behavior is common and often observed in LMXBs [see e.g. Gilfanov & Arefiev (2005) and Titarchuk et al. (2007)].
The observed variability of SS 433 in different spectral bands was interpreted in the framework of self-similar accretion disk variations suggested by Lyubarskii (1997). In particular, he proposed that when variable mass accretion rate generates energy release in the disk far away from a compact object then the corresponding radiation should be seen in optical and UV energy range. Whereas the energy emitted in X-ray should be released near the compact object. In SS 433 presumably these mass accretion rate fluctuations are detected and observed in power density spectrum. In which one can also see that the X-ray variability correlates with the optical and radio emissions (see Fig. 10).
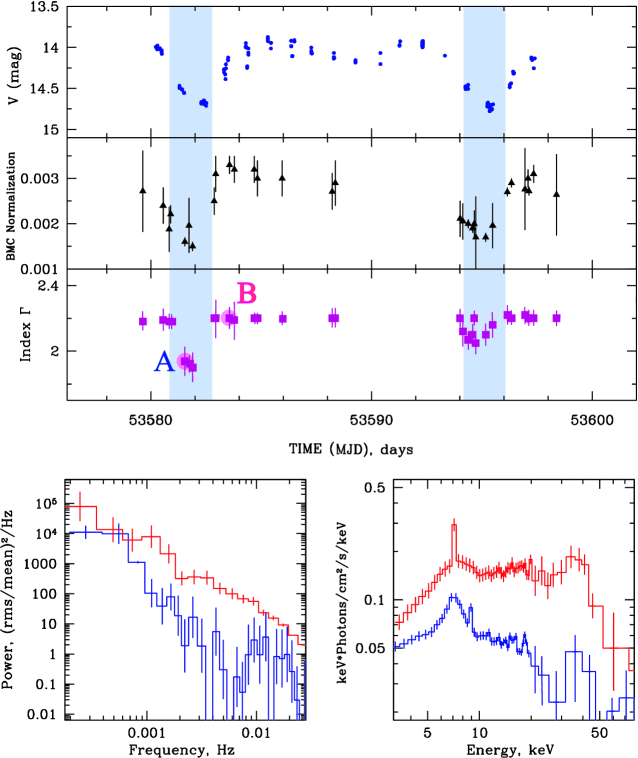
A study of orbital modulation allow us to detect some changes of power spectrum of SS 433 in the energy range 3 – 15 keV during the primary eclipse. In the lower panel of Fig. 11 we show details of the typical evolution of X-ray timing and spectral characteristics during the primary eplipse. The top panels of this Figure demonstrate V-band optical light curve, BMC normalization and photon index for R6 set as a function of time (see Table 1 for details of these observations). In the plot of photon index versus time points A and B correspond to moments MJD=53581 and 53585, during and after eclipse respectively. Blue strips mark eclipsed intervals of light curve. It is worth noting that the optical and X-ray fluxes significantly drop during the primary eclipse (see two upper panels and Table 3).
In Fig. 11 PDSs (left bottom panel) are plotted along with energy spectrum (right bottom panel) for two observational points A (91103-01-03-00, blue) and B (91103-01-07-00, red). The differences of the presented PDS and energy diagrams related to events A and B are noticeable. PDS during eclipse related to point A (blue histogram) indicates some weakening of power at 0.001 – 0.01 Hz in comparison with that for PDS outside of eclipse, at point B (red histogram). The corresponding spectrum during eclipse (blue line) demonstrates a significant decrease of total flux and also of the BMC normalization, at least by factor 2.
6 Interpretation of observational results
Before to proceed with the interpretation of the observations let us to briefly summarize our results as follows: i. The spectral data of SS 433 are well fit by a BMC model plus two Gaussian and “high temperature bbody” components (see §2.2). ii. Power law spectral index of BMC component rises and saturates with an increase of the BMC normalization (disk flux). The photon index saturation levels of the 2004 and 2005 – 2006 outbursts are about 2.2 and 2.3 respectively (see Fig. 8). iii. There is a total eclipse of ”high temperature BB-like” feature in the photon spectrum because this spectral feature is presumably formed in the innermost part of the X-ray source and thus it should not be seen during the primary eclipse. iv. The spectral index (hardness) clearly changes during the primary eclipse (see panels E1, E2 in Fig. 9 and one of upper panels in Fig. 11). This can be explained if there is a slight variation in spectral shape with radius through X-ray spectral formation region.
6.1 Index saturation as a BH signature. BH mass in SS 433
We have firmly established that the photon index of the resulting spectrum of SS 433 saturates with the BMC normalization or with disk mass accretion rate. ST09 presented strong arguments that this index saturation is a signature of converging flow into BH. In fact, the spectral index is inverse proportional to Comptonization parameter which is proportional to product of average number of photon scattering in Compton cloud and mean efficiency of gaining energy at any scattering . Because the index saturates, it means is an inverse of . But in general for an optically thick Compton cloud of optical depth average number of scatterings is proportional to or [see e.g. Laurent & Titarchuk (1999)]. In the case of thermal Comptonization and then should be inverse proportional to . But in the thermal Comptonization case the efficiency is proportional to electron temperature only [see e.g. Sunyaev & Titarchuk (1980)] and it is not clear why there could be such a sophisticated tuning in the Compton cloud that steadily decreases with as . On the other hand and in the converging flow case [see e.g. Titarchuk et al. (1997) and ST09] and thus the index saturation is a natural consequence of these laws for and in the case of converging flow [see Titarchuk & Zannias (1998) for the solution of the full relativistic kinetic equation]. Furthermore ST09 demonstrate that for a number of BHC sources index saturates not only when the mass accretion rate increases but also when QPO frequency increases. These index correlation and saturation with QPO frequency are a direct evidence that the index saturation takes place when the size of Compton cloud (CC) becomes more compact (namely the index saturates when compactness of the emission area increases).
Titarchuk et al. (1998) demonstrated that the CC compactness increases with mass accretion rate, . Moreover in the BH case the shape of the emergent spectrum saturates, when increases, to the spectra for which the power-law indices stay almost the same and these are always below 3 (see ST09 and Fig. 8 in this Paper). In fact, the asymptotic values of in SS 433 vary in the ranges (see Fig. 8). Thus, we argue that the SS 433 X-ray observations reveal the index saturation vs mass accretion which can be a sign of a converging flow in this source indicating a BH presence. This index vs BMC normalization (proportional to disk mass accretion rate) correlation can, in principle, allows us to estimate a lower limit of BH mass in SS 433.
To do BH mass estimate in SS 433 we choose to scale index-normalization previously found in GX 339-4 (see ST09) with that in SS 433 (see Fig. 12). We can proceed with this scaling if these two correlations are self-similar. In other words when given correlations have the same the index saturation levels and slopes as a function of normalization which is proportional to mass accretion rate in the disk.
Then the value of the scaling coefficient provides us BH mass estimate. Note that the index-normalization correlation curve for 2003 decay data of GX 339-4 (taken from ST09) is self-similar with that we find for SS 433.
Use of scaling method for these two correlations provides the scaling coefficient which is a ratio (see ST09):
| (2) |
where is BH mass of the reference source (GX 339-4), is BH mass of the target source (SS 433), geometric factor , inclination angles , and , are distances to the reference and target sources. Here the subscripts and are related to the reference and target sources respectively. One can, in principle, estimate BH mass in SS 433 using the relation (2). However a value of geometric factor is not obvious because which is an inclination angle of X-ray emission area in GX 339-4 is not known. Also it is not clear if we can use the inclination of the whole disk in order to estimate the inclination of the innermost part of the disk which size is about 4 orders of magnitude less than that of the disk. This is one of the main problems to correctly evaluate .
In order to estimate we can apply the same formula (2) but using the target and reference sources GX 339-4 and GRO J1655-40 respectively. We take values of , , , and from ST09 (Table 5 there) and then we obtain the lowest limit of
| (3) |
Now we can resolve formula (2) with respect to where we use GX 399-4 and SS 433 as the reference and target sources respectively. Thus we obtain
| (4) |
where we use a value of estimated by Cherepashchuk et al. (2005).
This is the lower limit mass estimate for SS 433 found using the ST09 scaling method. This estimate is consistent with the BH mass value obtained using optical observations of SS 433 [see Hillwig & Gies (2008), hereafter HG08]. BH mass estimates for the reference (GX 339-4) and target (SS 433) sources are summarized in Table 7.
6.2 Upper limit of the size of “High temperature BB-like” bump region
Now we try to estimate the upper limit of the size of the region from where the ” high temperature BB-like” photons originates. We consider the screening of the ”BB-like” bump emitting region by the optical star with radius .
Based on BH mass estimate by HG08, one can determine the mass of donor (optical) star using the mass function of normal star for SS 433. Namely,
| (5) |
where km s-1 is semi-amphlitude of radial velocity, is orbital period in days, is eccentricity (), is inclination angle of system [see Margon (1984)]. Thus mass of the donor star can be obtained as
| (6) |
if one resolves Eq.(5) with respect to and uses the BH mass values found by HG08 (see above). Then the resulting mass ratio is [see HG08 and Filippova et al. (2006)].
Using the donor star mass one can calculate the binary separation and Roche lobe radius. The resulting binary separation from Kepler’s third law is . Because the donor (optical) star in SS 433 fills its Roche lobe , the Roche lobe radius of the donor star can be found (compare with Eggleton, 1983)
| (7) |
But the upper limit of the ”BB-like” bump forming region can be estimated as
| (8) |
using that ”BB-like” bump forming region is screened, during 2.5 days, by a donor (optical) star of radius and rotating with the orbital velocity (see Figs. 9, 13). It is worth noting that , the real size of “BB-like” component emission, should be significantly smaller than that we estimate by inequality (8). Here we have just found the upper limit of based on the direct observational estimates.
7 Discussion and Summary
We derive a lower limit of 2 solar masses for the compact object in SS 4333 which clearly does not rule out a neutron star - this limit alone does not give strong observational evidence for a black hole. This is the lower limit of the central object mass is obtained using sliding the index-mass accretion correlation of SS 433 with respect to that for GX 339-4. In fact, this is an example that the sliding coefficient provides the lower limit of the mass of the central object. We remind a reader that this correlation of photon index and mass accretion rate was obtained using the so called BMC model of XSPEC which is the first principle radiative transfer model. Namely we consider and confirm applying the XSPEC fitting procedure that the emergent spectrum of the Compton cloud (CC, the innermost part of a BH) is a result of upscattering of soft, presumably disk, photons off CC energetic electrons.
The crucial characteristic of the correlation is the saturation plateau which is a signature of the converging flow into central object because the spectral index is an inverse of Comptonization parameter which is a product of number of scatterings and average fractional energy change per scattering (see also details of explanation of index saturation in §6.1). Only for converging flow is proportional to optical depth of the cloud and is inverse proportional to when is greater than one. Thus for large (mass accretion rate) it is natural to expect the index saturation as a signature of a BH and in fact, we really see this saturation in the case of SS 433. In the other words the main evidence for black hole is the index saturation with mass accretion rate. In contrast, in neutron star sources the photon index is almost constant, concentrating near 2, i.e, it does not change when mass accretion rate increases [see Farinelli & Titarchuk (2010)].
Moreover Hillwig & Gies (2008) found, using optical observations of SS 433, that the mass of central object is solar masses which can be the case only for a black hole. It is also worth noting a recent paper by Kubota et al. (2010) who argue these mass values should be considered as upper limits and taking into account the heating of the donor star may lower the derived masses to .
We find that the BMC model along with an additional “high temperature bbody-like” component allow us to consistently describe X-ray spectra of SS 433 and derive physical conditions during all states of SS 433. Moreover, our approach for data fitting demonstrates that the SS 433 spectra becomes softer and finally photon index saturates when mass accretion rate increases during X-ray outburst. This index behavior is in agreement with that ST09 and TS09 previously find in a number of other BHC sources. Furthermore, the fits, using our spectral model, allow us to demonstrate that in some cases an additional “high temperature bbody -like” component of color temperature of 4-5 keV appears in the data (see Figs. 3-7 and Tables 4-6). This “bbody-like” feature arises only during outburst transition of SS 433 and it presumably originates in the innermost part of accretion flow (see discussion in section 6.2).
Recently we found a signature of this ”high temperature bbody-like” bump in RXTE spectral data for BHC GRS 1915+105 (see TS09). Also we find that the same kind of “blackbody-like” bump is seen in BeppoSAX observations of the intermediate state of GRS 1915+105 (April 21, 2000, ID=209850011). The data along with the model are presented in Figure 14 (top panel). Consequently the presence of the additional “BB-like” bump spectral feature is not an instrumental effect of RXTE but it can be a real observational feature of the observed spectra of BHCs. Furthermore, we also detected the same ‘bbody-like high temperature” feature in the spectrum of SS 433 using IBIS/ISGRI detector onboard INTEGRAL satellite during simultaneous observations with RXTE (ID=90401-01-01-01, R5 set) (see Fig. 14 bottom panel). Thus it is quite possible that this “high temperature bbody-like ” feature can be the universal signature of BH spectra.
Also one can argue that the presence of “high temperature bbody-like” feature may be an artifact of having chosen the BMC model. In fact, the presence or absence of the bump can be related to the model. But the BMC model is a first principle Comptonization model and therefore any residual using this model can be considered as an observational signature of other component presented in the spectrum. Moreover Laurent & Titarchuk (1999) and Laurent & Titarchuk (2010) demonstrate using Monte Carlo simulation that X-ray emergent spectra of a black hole for all spectral states are well fitted by BMC model if the effect of pair production is not taken into account. But in the spectra of the intermediate and soft states this additional “BB features appears if the non-linear effect of pair creations in very vicinity of a black hole horizon is taken into account [Laurent & Titarchuk (2010) in preparation].
One can say that such a bump seems very similar to the “Compton-bump” expected by reflection models in black hole systems (both AGN and stellar-mass objects), e.g. see Miller (2007). In fact, in our previous paper TS09 (see section 4.2 there) we discuss this issue in detail. Here we should once again point out that in the observations this “high temperature BB-like bump appears only when the photon index is higher than 2. On the other hand Laurent & Titarchuk (2007) demonstrate using Monte Carlo simulation and theoretical arguments that the reflection bump never appears in the emergent spectra if photon index of the spectrum is higher than 2. Namely, there are not enough photons in the incident spectrum at high energies, if , to be reemitted into lower energies due to scattering and recoil effects. In fact, as one can see from Tables 4-6, that in all spectra where we detect this “high temperature BB-like” ( keV) feature index of the hard BMC component and thus the appearance of this bump in the observed spectra cannot be explained by so called “reflection” effect.
TS09 argue that this “high temperature BB-like” bump can be a result of the gravitationally redshifted annihilation line which is originally formed in the very vicinity of a BH horizon. This feature (bump) should be seen in the IS and HSS spectra only because in these states mass accretion rate is high enough to provide conditions to form the strong annihilation line and also to observe this feature through accreting material of relatively low plasma temperature (see more details in TS09, §4.2 there).
It is worth noting that a time delay of the radio peak with respect to that in X-rays is two days for outburst rise (Revnivtsev et al., 2006). We find that during this X-ray flare, and then in radio one, the object transits from IS to LHS, which is quite unusual for spectral transitions of BHC. This particular behavior of SS 433 is different from other BH sources probably because the jet is the dominant emission component. In general, when a BH goes to outburst it leaves a quiescent state, enters to LHS and then it goes to IS-HSS. However, the microquasar SS 433 is the only BHC which stays, most of the time in IS with a rare short transition to LHS accompanied by the radio flare. A delay of radio peak with respect to X-ray peak is known during outburst rise transition in many X-ray BHC. However a time delay value is different for each of the sources. For instance, it is about 20 days for GRS 1915+105 and about 2 days during outburst in SS 433. If in the GRS 1915+105 case the index saturation value is about 3, whereas in the case of SS 433 the index saturates to . Moreover the direct soft component, which is usually associated with the disk, is clearly seen in the GRS 1915 soft spectra and it is weak or absent at all (at the level of detection) in most of SS 433 spectra (see e.g. Table 3).
As conclusions we formulate the following. We analyze the state transition data from SS 433 collected using RXTE observations. We examine the correlation between the photon index of the Comptonized spectral component and its normalization which is presumably proportional to disk mass accretion rate (see Fig. 8). We find that broad-band energy spectra during all spectral states are well fit by the XSPEC BMC model for the continuum and by two (broad and narrow) Gaussian line components. In addition to these model components we also find a strong feature of ”blackbody-like” bump which color temperature is in the range of 4-5 keV in 24 intermediate state (IS) spectra of SS 433.
Furthermore the application of our spectral model to the SS 433 data allows us to establish the saturation of the photon index vs BMC normalization, which scales with disk mass accretion rate at value around 2.3 (see Fig. 8). In addition, an application of the scaling method (see ST09) allows us to estimate a lower limit of compact object mass in SS 433 ().
A high value of the Comptonized emission fraction obtained, in the framework of BMC model, gives us a strong evidence of significant reprocessing of X-ray emission of the disk photons in SS 433 which is also in agreement with power density spectra which reveal a pure power law (so called “red noise”).
It is important to emphasize that the index saturation effect in SS 433 now seen, is a BH signature and was recently found in a number of BHC sources (ST09). Moreover the detection of the so called “high temperature BB-like” bump” (which could be a gravitationally redshifted annihilation line) in SS 433 is also found in GRS 1915+105 data by different space missions (RXTE, BeppoSAX and INTEGRAL).
We acknowledge Vitalij Goranskij and Tatyana Irsmambetova who kindly provide us optical data. We also thank RXTE, INTEGRAL team and also Sergej Trushkin for providing us X-ray and radio data correspondingly. We appreciate comments and thorough editing of the paper made by Chris Shrader. We are very grateful the referee for his/her valuable comments and corrections of the content of the paper.
References
- Antokhina at el. (1992) Antokhina, É. A., Seifina, E. V., & Cherepashchuk, A. M. 1992, Soviet Astronomy, 36, 143
- Band et al. (1989) Band W. et al., 1989, ApJ, 336, 937
- Bradt et al. (1993) Bradt, H.V., Rothschild, R.E. & Swank, J.H. 1993, A&AS, 97, 355
- Brinkmann et al. (1991) Brinkmann, W., Kawai, N., Matsuoka, M., Fink, H. H., 1991, A&A, 241, 112
- Cherepashchuk et al. (2005) Cherepashchuk, A.M. et al. 2005, A&A, 437, 561
- Cherepashchuk (2002) Cherepashchuk, A.M. 2002, Space Science Reviews, 102, 1
- Churazov et al. (2001) Churazov, E., Gilfanov, M. & Revnivtsev, M. 2001, MNRAS, 321, 759
- Corvoisier et al. (2003) Corvoisier, T.J.-L. et al. 2003, A&A, 411, L53
- Egglton (1983) Eggleton, P.P., 1983, ApJ, 268, 368
- Gies et al. (2002) Gies, D. R., McSwain, M. V., Riddle, R. L., Wang, Z., Witta, P. J. & Wingert D. W. 2002, ApJ, 566, 1069
- Gilfanov & Arefiev (2005) Gilfanov, M. & Arefiev, V., 2005, astro-ph/0501215
- Goranskij et al. (1987) Goranskij, V.P., Kopylov, I.M., Rakhimov, V.Yu. et al., 1987, Commun. Spec. Astrophys. Obs. 52, 5
- Goranskij et al. (1998) Goranskij V.P. et al., 1998, Astron. Rep., 42, 209
- Fabrika (2004) Fabrika, S.N. 2004, Astrophys. Space Phys.Rev., 12, 1
- Farinelli & Titarchuk (2010) Farinelli, R. & Titarchuk, L. 2010, submitted to A&A
- Filippova et al. (2006) Filippova, E., Revnivtsev, M. Fabrika, S., Postnov, K. & Seifina, E. 2006, A&A, 460, 125
- Fielder et al. (1987) Fielder, S. et al. 1987, ApJ, 94, 1244
- Hillwig & Gies (2008) Hillwig, T. C. & Gies, D. R. 2008, ApJ, 676, L37
- Hynes et al. (2004) Hynes, R. I., Steeghs, D., Casares, J., Charles, P. A., & O’Brien, K. 2004, ApJ, 609, 317
- Kawai et al. (1989) Kawai, N., Matsuoka, M., Pan, H., & Stewart, G. C. 1989, PASJ, 41, 491
- Kotani et al. (2002) Kotani, T., Band, D., Denissyuk, E.K., Kawai, N., Kinugasa, K., Namiki, M., Safi-Harb, S., & Trushkin, S. 2002, in ASP Conf. Ser. 279, Exotic Stars as Challenges to Evolution, ed. CA Tout & W. Van Hamme (San Francisco: ASP), 19
- Kotani et al. (1996) Kotani, T., Kawai, N., Matsuoka, M. and Brinkmann, W. 1996, PASJ, 48, 619
- Kubota et al. (2010) Kubota K., et al. 2010, ApJ, 709, 1374
- Laurent & Titarchuk (1999) Laurent, P. & Titarchuk, L. 1999, ApJ, 511, 289
- Laurent & Titarchuk (2010) Laurent, P. & Titarchuk, L. 2010, submitted to ApJ
- Laurent & Titarchuk (2007) Laurent, P. & Titarchuk, L. 2007, ApJ, 656, 1056 bibitem[Laurent & Titarchuk (1999)]LT99 Laurent, P. & Titarchuk, L. 1999, ApJ, 511, 289
- Lyubarskii (1997) Lyubarskii, Yu. 1997, MNRAS, 292, 679
- Margon (1984) Margon, B. 1984, ARAA, 22, 5072
- Marshall et al. (2002) Marshall, H. L., Canizares, C. R., Schulz, N. S., 2002, ApJ 564, 941
- Miller (2007) Miller, J, 2007, AR&A, 45, 441
- Munoz-Dias et al. (2008) Munoz-Darias, T., Casares, J., & Martinez-Pais, I. G. 2008, MNRAS, 385, 2205
- Nandi et al. (2005) Nandi, A., Chakrabarti, S., Belloni, T., Goldoni, P. 2005, MNRAS, 359, 629
- Revnivtsev et al. (2006) Revnivtsev, M. et al, 2006, A&A, 447, 545
- Romney et al. (1987) Romney, I. D., Schilizzi, R. T., Fejet, I., Spencer, R. E., 1987, ApJ, 321, 822
- Safi-Harb & Kotani (2003) Safi-Harb, S., & Kotani, T. 2003, in New Views on Microquasars, ed. P. Durouchoux, Y. Fuchs, & J. Rodriguez (Kolkata: Centre for Space Physics), 279
- Seifina (2000) Seifina, E. 2000, Astron. Rep., 43, 305
- Shaposhnikov & Titarchuk (2009) Shaposhnikov, N., & Titarchuk, L. 2009, ApJ, 699, 453 (ST09)
- Sunyaev & Titarchuk (1980) Sunyaev, R.A. & Titarchuk, L. 1980, A&A, 86, 121
- Titarchuk & Seifina (2009) Titarchuk, L. & Seifina, E. 2009, ApJ, 706, 1463 (TS09)
- Titarchuk et al. (2007) Titarchuk, L. , Shaposhnikov, N. & Aref’ev, V. 2007, ApJ, 660, 556
- Titarchuk & Shaposhnikov (2005) Titarchuk, L. & Shaposhnikov, N. 2005, ApJ, 626, 298
- Titarchuk & Zannias (1998) Titarchuk, L. & Zannias, T. 1998, ApJ, 499, 315
- Titarchuk et al. (1998) Titarchuk, L. , Lapidus, I.I. & Muslimov, A. 1998, ApJ, 499, 315
- Titarchuk et al. (1997) Titarchuk, L. , Mastichiadis, A & Kylafis, N. 1997, ApJ, 487, 834
- van der Klis (1995) van der Klis, M. 1995, in X-ray binaries, ed. W.H.G. Lewin, J.,van Paradijs, & E.P.J. van der Heuvel (Cambridge Univ. Press, Cambridge), p. 252
- Zwitter et al. (1991) Zwitter, T., Calvani, M., & D’Odorico, S., 1991, A&A, 251, 92
| Number of set | Dates, MJD | RXTE Proposal ID | UT Dates | Type of Light Curve | Ref. |
|---|---|---|---|---|---|
| R1 | 50191-50194 | 10127 | Apr. 18 – 21, 1996 | 1 | |
| R2 | 50868-50907 | 20102, 30273 | Feb. 24 – Apr. 4, 1998 | outburst | 1,2 |
| R3 | 52222-52238 | 60058 | Nov. 9 – 11, 2001 | outburst | 1 |
| R4 | 52544.46-52544.74, 52913-52914 | 70416, 80429 | Apr. 18 – 21, 2002 | 1 | |
| R5 | 53076-53092 | 90401 | Mar. 12 – 28, 2004 | outburst | 1, 2 |
| R6 | 53239-53610 | 90401, 91103, 91092 | Jul.28 – Aug. 28, 2005 | outburst decay | this work |
| R7 | 54085-54096 | 92424 | Dec. 17 – 27, 2006 | outburst decay | this work |
| Satellite | Obs. ID | Start time (UT) | End time (UT) |
|---|---|---|---|
| BeppoSAX | 209850011 | 2000 Apr. 21 08:55:30 | 2000 Apr. 21 15:16:47 |
| Observational | MJD, | log(A)†† | N, | Eline1, | Eline2, | N | (d.o.f.) | F1/F | Rem | |||||
|---|---|---|---|---|---|---|---|---|---|---|---|---|---|---|
| ID | day | keV | keV | keV | (a) | |||||||||
| 10127-01-01-00 | 50191.10 | 0.852 | 0.1820 | 1.03(2) | 2.00 | 3.20(3) | 6.90(9) | 0.66(1) | 3.74(6) | 8.70(4) | 0.28(4) | 1.17 (78) | 6.06/4.61 | |
| 10127-01-02-00 | 50192.10 | 0.931 | 0.1882 | 1.11(1) | 2.00 | 2.23(3) | 6.87(1) | 0.73(2) | 3.1(1) | 8.83(5) | 0.21(3) | 1.27 (78) | 4.40/3.13 | ecl |
| 10127-01-03-00 | 50192.71 | 0.973 | 0.1911 | 1.43(3) | 2.00 | 2.01(9) | 6.89(1) | 0.64(2) | 2.2(1) | 8.64(7) | 0.19(4) | 0.77 (78) | 3.07/1.46 | ecl |
| 10127-01-04-00 | 50193.06 | 0.005 | 0.1941 | 1.36(2) | 2.00 | 1.87(2) | 6.88(1) | 0.69(2) | 2.3(1) | 8.75(6) | 0.19(4) | 1.14 (78) | 2.99/1.51 | ecl |
| 10127-01-05-00 | 50193.27 | 0.020 | 0.1950 | 1.38(3) | 2.00 | 1.95(5) | 6.86(2) | 0.67(5) | 2.2(2) | 8.6(1) | 0.22(9) | 0.99 (78) | 3.25/1.87 | ecl |
| 10127-01-06-00 | 50193.77 | 0.087 | 0.1980 | 1.40(2) | 2.00 | 2.03(2) | 6.89(1) | 0.63(2) | 2.3(1) | 8.65(6) | 0.21(4) | 1.21 (78) | 3.18/1.58 | ecl |
| 10127-01-07-00 | 50194.91 | 0.149 | 0.2051 | 1.13(1) | 2.00 | 2.83(9) | 6.88(7) | 0.61(1) | 3.06(8) | 8.63(4) | 0.2(2) | 1.16 (78) | 5.15/3.64 | |
| 20102-01-01-00 | 50868.77 | 0.642 | 0.3609 | 0.97(2) | 2.00 | 1.64(2) | 6.59(1) | 0.34(2) | 1.68(7) | 7.95(6) | 0.23(4) | 1.01 (77) | 3.30/2.73 | |
| 20102-01-02-00 | 50870.24 | 0.754 | 0.3700 | 1.00(1) | 2.00 | 1.84(2) | 6.54(1) | 0.29(2) | 1.80(8) | 7.71(3) | 0.39(5) | 1.57 (77) | 3.42/2.97 | |
| 20102-01-03-00 | 50871.91 | 0.895 | 0.3810 | 1.15(2) | 2.00 | 2.14(5) | 6.56(1) | 0.26(3) | 1.9(1) | 7.70(4) | 0.47(7) | 1.28 (78) | 3.79/2.64 | ecl |
| 20102-01-04-00 | 50873.18 | 0.991 | 0.3850 | 1.36(3) | 2.00 | 1.67(7) | 6.58(1) | 0.36(2) | 1.82(8) | 7.95(3) | 0.36(4) | 1.02 (78) | 3.79/2.64 | ecl |
| 20102-01-05-00 | 50874.92 | 0.111 | 0.3988 | 1.19(4) | 2.00 | 1.68(6) | 6.57(2) | 0.33(5) | 2.1(2) | 7.9(1) | 0.3(1) | 0.85 (77) | 2.74/1.84 | |
| 20102-01-06-00 | 50876.72 | 0.250 | 0.4099 | 1.19(4) | 2.00 | 1.67(6) | 6.57(2) | 0.33(5) | 2.1(2) | 7.9(1) | 0.3(1) | 0.85 (77) | 2.73/1.80 | |
| 20102-02-01-02 | 50876.79 | 0.255 | 0.4104 | 1.20(5) | 2.00 | 1.81(6) | 6.58(3) | 0.36(6) | 2.2(2) | 7.8(3) | 0.03(1) | 0.93 (77) | 2.90/1.94 | |
| 20102-02-01-03 | 50877.58 | 0.315 | 0.4152 | 1.11(4) | 2.00 | 1.74(6) | 6.59(2) | 0.43(4) | 2.4(2) | 8.01(9) | 0.4(1) | 0.98 (77) | 3.01/2.21 | |
| 20102-02-01-04 | 50877.64 | 0.320 | 0.4156 | 1.36(2) | 2.00 | 1.67(2) | 6.58(1) | 0.36(2) | 1.82(8) | 7.95(3) | 0.36(4) | 1.01 (77) | 2.60/1.32 | |
| 20102-02-01-05 | 50877.71 | 0.325 | 0.4160 | 1.18(3) | 2.00 | 1.84(4) | 6.61(2) | 0.39(4) | 2.23(7) | 7.96(8) | 0.4(1) | 0.70 (77) | 3.01/2.10 | |
| 20102-02-01-01 | 50877.79 | 0.331 | 0.4165 | 1.14(1) | 2.00 | 1.96(2) | 6.63(1) | 0.42(1) | 2.37(8) | 8.01(4) | 0.30(5) | 0.94 (77) | 3.34/2.45 | |
| 20102-02-01-06 | 50878.00 | 0.347 | 0.4178 | 1.09(1) | 2.00 | 2.03(1) | 6.637(6) | 0.42(1) | 2.53(6) | 8.06(3) | 0.34(3) | 1.42 (77) | 3.51/2.75 | |
| 20102-02-01-07 | 50878.58 | 0.391 | 0.4214 | 1.18(4) | 2.00 | 2.09(6) | 6.68(2) | 0.46(4) | 2.5(2) | 8.1(3) | 0.2(1) | 0.84 (77) | 3.41/2.42 | |
| 20102-02-01-000 | 50878.64 | 0.396 | 0.4218 | 1.14(2) | 2.00 | 2.0(1) | 6.64(8) | 0.44(1) | 2.41(7) | 8.6(1) | 0.04(2) | 0.63 (77) | 2.84/1.89 | |
| 20102-02-01-00 | 50878.97 | 0.421 | 0.4238 | 1.12(1) | 2.00 | 1.9(1) | 6.67(8) | 0.46(1) | 2.44(7) | 8.20(4) | 0.2(3) | 0.84 (77) | 3.52/2.42 | |
| 20102-02-01-11 | 50879.16 | 0.436 | 0.4249 | 1.09(3) | 2.00 | 1.73(5) | 6.62(1) | 0.45(3) | 2.24(4) | 8.02(6) | 0.30(7) | 1.34 (77) | 3.02/2.32 | |
| 20102-02-01-08 | 50879.37 | 0.452 | 0.4263 | 0.99(4) | 2.00 | 1.71(9) | 6.60(2) | 0.50(5) | 2.6(2) | 8.1(1) | 0.3(1) | 0.68 (77) | 3.33/2.81 | |
| 20102-02-01-09 | 50879.51 | 0.463 | 0.4271 | 1.13(4) | 2.00 | 1.60(6) | 6.66(1) | 0.60(3) | 2.8(2) | 8.9(1) | 0.19(6) | 0.89 (77) | 3.04/1.92 | |
| 20102-02-01-10 | 50879.57 | 0.467 | 0.4275 | 1.22(2) | 2.00 | 1.72(3) | 6.66(1) | 0.46(2) | 2.4(1) | 8.22(7) | 0.26(5) | 0.79 (77) | 2.85/1.82 | |
| 20102-01-07-00 | 50889.73 | 0.244 | 0.4902 | 0.86(7) | 0.36(9) | 0.72(3) | 6.70(3) | 0.59(6) | 0.44(7) | 8.6(1) | 0.04(2) | 1.03 (76) | 1.22/1.25 | |
| 20102-02-02-01 | 50897.85 | 0.865 | 0.5402 | 1.10(2) | 2.00 | 1.72(3) | 6.16(1) | 0.45(3) | 1.9(1) | 8.05(5) | 0.32(5) | 0.79 (77) | 3.04/2.24 | |
| 20102-02-02-00 | 50898.78 | 0.953 | 0.546 | 1.33(1) | 2.00 | 1.85(2) | 6.60(1) | 0.35(2) | 1.90(8) | 7.92(3) | 0.38(4) | 1.44 (77) | 3.00/1.40 | ecl |
| 30273-01-01-00 | 50899.72 | 0.007 | 0.551 | 1.39(1) | 2.00 | 1.58(1) | 6.58(1) | 0.35(1) | 1.81(4) | 7.92(3) | 0.39(4) | 1.38 (77) | 2.49/1.21 | ecl |
| 30273-01-01-01 | 50900.73 | 0.083 | 0.558 | 1.13(1) | 2.00 | 1.72(3) | 6.56(1) | 0.34(2) | 1.82(8) | 7.83(3) | 0.29(4) | 1.40 (77) | 3.16/2.17 | ecl |
| 30273-01-02-00 | 50901.74 | 0.162 | 0.5642 | 0.99(1) | 2.00 | 1.74(3) | 6.60(1) | 0.41(2) | 2.02(8) | 7.92(3) | 0.29(4) | 1.32 (77) | 3.32/2.85 | |
| 30273-01-02-010 | 50902.74 | 0.239 | 0.5704 | 1.07(1) | 2.00 | 1.93(2) | 6.643(8) | 0.47(1) | 2.32(7) | 8.12(3) | 0.31(4) | 1.20 (77) | 3.52/2.73 | |
| 30273-01-02-01 | 50903.06 | 0.263 | 0.5724 | 0.98(4) | 2.00 | 1.98(9) | 6.67(2) | 0.55(5) | 2.6(2) | 8.3(1) | 0.3(1) | 0.80 (77) | 3.81/3.21 | |
| 30273-01-03-000 | 50903.73 | 0.314 | 0.5765 | 1.17(1) | 2.00 | 2.01(2) | 6.616(8) | 0.40(1) | 2.32(7) | 7.98(3) | 0.36(4) | 1.02 (77) | 3.35/2.34 | |
| 30273-01-03-00 | 50903.99 | 0.334 | 0.5781 | 1.15(3) | 2.00 | 1.98(5) | 6.63(1) | 0.42(3) | 2.4(1) | 8.13(8) | 0.33(8) | 0.98 (77) | 3.32/2.31 | |
| 30273-01-03-010 | 50904.72 | 0.390 | 0.5826 | 1.17(1) | 2.00 | 1.90(2) | 6.565(8) | 0.33(7) | 2.09(7) | 7.80(2) | 0.47(4) | 0.98 (77) | 3.31/2.30 | |
| 30273-01-03-01 | 50904.99 | 0.410 | 0.5843 | 1.21(3) | 2.00 | 1.90(4) | 6.59(2) | 0.34(4) | 2.1(1) | 7.88(7) | 0.45(1) | 0.76 (77) | 3.12/2.04 | |
| 30273-01-03-02 | 50905.20 | 0.427 | 0.5856 | 1.25(6) | 2.00 | 2.01(6) | 6.58(3) | 0.35(7) | 2.01(6) | 7.8(1) | 0.4(1) | 1.29 (77) | 3.21/2.01 | |
| 30273-01-05-01 | 50906.00 | 0.487 | 0.5905 | 1.06(2) | 2.00 | 1.86(4) | 6.55(1) | 0.35(3) | 2.2(1) | 7.94(6) | 0.36(7) | 1.01 (77) | 3.32/2.61 | |
| 30273-01-05-03 | 50906.13 | 0.498 | 0.5913 | 1.09(4) | 2.00 | 1.93(6) | 6.54(2) | 0.38(5) | 2.2(2) | 7.8(1) | 0.38(5) | 1.09 (77) | 3.42/2.64 | |
| 30273-01-05-00 | 50906.79 | 0.548 | 0.5953 | 1.23(1) | 2.00 | 2.00(2) | 6.533(8) | 0.28(1) | 2.04(7) | 7.7(2) | 0.47(4) | 0.95 (77) | 3.24/2.12 | |
| 30273-01-05-02 | 50907.13 | 0.574 | 0.5975 | 1.20(5) | 2.00 | 1.98(6) | 6.54(2) | 0.34(5) | 2.2(2) | 7.9(1) | 0.4(1) | 0.81 (77) | 3.21/2.21 | |
| 60058-01-01-00 | 52222.29 | 0.105 | 0.7082 | 1.07(7) | 2.00 | 1.97(7) | 6.67(4) | 0.42(7) | 1.8(2) | 7.9(1) | 0.27(7) | 0.79 (77) | 3.47/2.84 | |
| 60058-01-02-00 | 52223.22 | 0.176 | 0.7139 | 1.19(8) | 2.00 | 2.04(6) | 6.95(4) | 0.43(7) | 1.3(2) | 7.9(1) | 0.3(1) | 1.15 (77) | 3.22/2.53 | |
| 60058-01-03-00 | 52224.28 | 0.257 | 0.7205 | 1.22(8) | 2.00 | 2.21(7) | 6.94(1) | 0.6(1) | 1.3(3) | 6.6(1) | 0.5(3) | 1.37 (77) | 3.42/2.61 | |
| 60058-01-04-00* | 52225.27 | 0.333 | 0.7266 | 1.07(8) | -0.5(4) | 1.5(3) | 7.01(1) | 0.72(4) | 2.7(3) | 9.4(1) | 0.17(9) | 1.09 (69) | 3.33/1.73 | |
| 60058-01-05-00* | 52226.19 | 0.403 | 0.7323 | 1.06(8) | -0.5(4) | 1.9(3) | 7.03(2) | 0.63(3) | 2.5(1) | 9.4(1) | 0.02(9) | 1.30 (69) | 3.91/1.95 | |
| 60058-01-06-00* | 52227.25 | 0.484 | 0.7388 | 1.07(5) | -0.1(1) | 1.8(3) | 7.05(1) | 0.74(5) | 2.6(3) | 9.4(1) | 0.10(9) | 1.01 (69) | 3.74/2.13 | |
| 60058-01-07-00* | 52228.24 | 0.560 | 0.7449 | 1.30(6) | 2.00 | 2.46(4) | 6.90(1) | 0.52(3) | 2.1(1) | 8.9(1) | 0.15(8) | 1.08 (69) | 4.15/2.69 | |
| 60058-01-08-00* | 52229.30 | 0.641 | 0.7515 | 1.31(8) | 0.7(3) | 2.5(1) | 6.95(3) | 0.55(5) | 2.2(2) | 8.80(4) | 0.25(8) | 1.20 (69) | 4.12/2.78 | |
| 60058-01-09-00* | 52230.30 | 0.717 | 0.7576 | 1.30(5) | 0.5(2) | 2.1(1) | 6.92(4) | 0.73(6) | 2.18(3) | 8.69(4) | 0.25(8) | 0.79 (69) | 3.46/2.17 | |
| 60058-01-10-00* | 52232.15 | 0.859 | 0.7690 | 1.2(1) | 2.00 | 2.27(3) | 6.96(3) | 0.86(4) | 3.2(3) | - | - | 1.2 (69) | 4.15/2.74 | |
| 60058-01-11-00* | 52233.27 | 0.952 | 0.7758 | 1.20(8) | 2.00 | 2.06(1) | 6.97(4) | 0.63(7) | 1.9(2) | 8.7(2) | 0.2(1) | 1.2 (69) | 3.57/2.37 | ecl |
| 60058-01-12-00 | 52234.33 | 0.028 | 0.7819 | 1.20(9) | 2.00 | 1.8(1) | 7.03(5) | 0.68(9) | 1.7(3) | 8.7(2) | 0.1(1) | 1.04 (77) | 3.16/2.07 | ecl |
| 60058-01-13-00 | 52235.33 | 0.105 | 0.7881 | 1.21(8) | 2.00 | 2.60(8) | 6.95(3) | 0.55(5) | 2.6(8) | 9.0(4) | 0.2(1) | 1.17 (77) | 4.27/3.08 | ecl |
| 60058-01-15-00* | 52236.18 | 0.167 | 0.7939 | 1.19(5) | 2.00 | 2.58(2) | 6.99(2) | 0.67(4) | 2.6(2) | - | - | 1.09 (69) | 4.85/3.42 | |
| 60058-01-17-00 | 52238.23 | 0.324 | 0.8065 | 1.26(5) | 2.00 | 3.57(7) | 7.06(3) | 0.69(4) | 2.5(2) | - | - | 1.59 (71) | 5.71/3.94 | |
| 70416-01-01-00 | 52544.46 | 0.732 | 0.6951 | 1.13(5) | 2.00 | 1.60(7) | 6.64(4) | 0.2(1) | 1.6(2) | 7.9(1) | 0.3(1) | 0.93 (72) | 2.99/2.04 | |
| 70416-01-01-01 | 52544.66 | 0.747 | 0.6963 | 1.00(6) | 0.4(1) | 1.7(1) | 6.57(6) | 0.2(1) | 1.2(2) | 7.7(1) | 0.4(1) | 0.81 (71) | 2.76/1.98 | |
| 70416-01-01-02 | 52544.74 | 0.753 | 0.6968 | 0.97(6) | 0.7(2) | 1.5(1) | 6.61(6) | 0.3(1) | 1.61(6) | 7.8(1) | 0.4(2) | 0.87 (72) | 2.92/2.23 | |
| 80429-01-01-00 | 52913.69 | 0.963 | 0.9711 | 1.21(8) | 2.0 | 1.8(1) | 7.30(9) | 1.2(1) | 2.3(5) | - | - | 1.13 (72) | 3.36/2.03 | ecl |
| 80429-01-01-01 | 52914.22 | 0.007 | 0.9761 | 1.22(5) | 2.0 | 1.84(8) | 7.42(5) | 1.8(2) | 1.06(7) | - | - | 1.03 (72) | 3.22/1.983 | ecl |
| 90401-01-01-01* | 53076.78 | 0.423 | 0.9780 | 1.30(2) | 0.4(2) | 3.4(1) | 7.23(3) | 0.96(8) | 4.7(6) | 9.2(3) | 0.1(1) | 1.01 (69) | 8.59/6.54 | |
| 90401-01-01-03* | 53076.85 | 0.428 | 0.9784 | 1.30(2) | 0.3(1) | 3.4(1) | 7.15(2) | 0.80(4) | 4.4(8) | 9.3(2) | 0.26(8) | 1.03 (69) | 7.91/4.85 | |
| 90401-01-01-00* | 53077.77 | 0.498 | 0.9841 | 1.32(2) | 0.3(1) | 3.03(6) | 7.06(1) | 0.75(2) | 4.3(2) | 9.08(5) | 0.30(5) | 1.24 (69) | 7.72/4.75 | |
| 90401-01-01-02* | 53078.75 | 0.573 | 0.9901 | 1.30(1) | 2.00 | 3.5(1) | 7.02(3) | 0.87(4) | 4.1(4) | 8.9(2) | 0.1(1) | 1.35 (69) | 7.01/4.63 | |
| 90401-01-02-01* | 53089.07 | 0.362 | 0.0538 | 1.31(2) | 0.9(6) | 3.4(1) | 7.07(2) | 0.97(4) | 5.3(3) | - | - | 1.17 (69) | 5.25/3.01 | |
| 90401-01-02-00* | 53089.28 | 0.378 | 0.0550 | 1.30(2) | 1.8(1) | 3.6(1) | 7.12(2) | 0.80(3) | 4.3(1) | 9.2(1) | 0.80(3) | 1.34 (69) | 8.01/5.47 | |
| 90401-01-03-01* | 53091.04 | 0.512 | 0.0659 | 1.29(2) | 0.16(2) | 3.2(1) | 7.02(3) | 0.70(7) | 3.7(4) | 8.8(1) | 0.4(1) | 1.14 (69) | 5.64/3.58 | |
| 90401-01-03-02* | 53091.82 | 0.572 | 0.0707 | 1.29(2) | 0.4(1) | 3.3(1) | 7.04(2) | 0.73(4) | 3.8(3) | 9.1(4) | 0.21(9) | 1.08 (69) | 5.95/3.51 | |
| 90401-01-03-00* | 53092.09 | 0.593 | 0.0724 | 1.31(2) | 2.00 | 2.8(1) | 7.10(2) | 0.90(4) | 4.2(3) | - | - | 1.19 (69) | 5.93/3.62 | |
| 90401-01-04-01 | 53239.49 | 0.860 | 0.9814 | 1.2(1) | 2.00 | 3.42(8) | 7.33(3) | 0.71(4) | 2.4(1) | - | - | 1.50 (73) | 5.62/3.98 | |
| 90401-01-05-01 | 53361.71 | 0.202 | 0.7352 | 1.00(6) | 2.00 | 1.24(9) | 6.58(2) | 0.42(4) | 1.8(1) | - | - | 1.15 (73) | 2.89/2.12 | |
| 90401-01-06-00 | 53363.75 | 0.359 | 0.7478 | 1.09(2) | 2.00 | 1.46(9) | 6.60(3) | 0.31(4) | 1.8(1) | 8.3(1) | 0.27(9) | 1.19 (73) | 2.87/1.91 | |
| 90401-01-06-01 | 53366.13 | 0.540 | 0.7624 | 0.95(7) | 2.00 | 1.71(6) | 6.62(3) | 0.33(7) | 2.4(2) | 8.3(1) | 0.4(1) | 1.15 (71) | 3.45/2.96 | |
| 91103-01-01-00 | 53579.63 | 0.861 | 0.0791 | 1.18(3) | 2.00 | 2.72(9) | 7.09(2) | 0.91(2) | 3.9(3) | - | - | 1.17 (71) | 2.78/1.63 | |
| 91103-01-09-00 | 53580.55 | 0.931 | 0.0848 | 1.19(4) | 2.00 | 2.4(4) | 7.22(4) | 0.87(6) | 2.1(2) | - | - | 0.97(74) | 4.20/2.57 | ecl |
| 91103-01-02-01 | 53580.83 | 0.952 | 0.0865 | 1.18(3) | 2.00 | 1.88(5) | 7.1(1) | 0.78(2) | 1.7(5) | 8.7(1) | 0.2(2) | 1.18(73) | 3.38/2.13 | ecl |
| 91103-01-02-00* | 53580.90 | 0.958 | 0.0870 | 1.18(3) | 0.2(2) | 2.21(2) | 6.70(2) | 0.27(3) | 0.6(3) | 8.0(2) | 0.4(1) | 0.97(69) | 2.97/1.74 | ecl |
| 91103-01-03-00 | 53581.53 | 0.006 | 0.0908 | 0.94(6) | 0.58(5) | 1.6(1) | 6.96(3) | 0.99(3) | 1.61(6) | 9.3(1) | 0.10(8) | 1.02(73) | 2.79/2.30 | ecl, ”A” |
| 91103-01-04-01 | 53581.73 | 0.021 | 0.0920 | 0.92(2) | 0.6(1) | 1.95(1) | 7.5(1) | 0.9(1) | 1.1(4) | 6.9(1) | 0.4(2) | 1.04(71) | 2.91/1.90 | ecl |
| 91103-01-04-00 | 53581.89 | 0.033 | 0.0930 | 0.90(6) | 0.6(1) | 1.5(1) | 6.8(1) | 1.29(1) | 3.0(5) | - | - | 0.85(73) | 3.22/2.52 | ecl |
| 91103-01-05-00* | 53582.87 | 0.108 | 0.0991 | 1.2(1) | 0.01(4) | 2.5(3) | 7.08(6) | 0.75(8) | 2.8(6) | - | - | 0.97 (69) | 3.90/2.13 | |
| 91103-01-05-01* | 53582.94 | 0.113 | 0.0995 | 1.20(6) | 0.9(1) | 3.1(4) | 7.02(6) | 0.75(9) | 3.0(6) | - | - | 1.07 (69) | 5.41/3.34 | |
| 91103-01-07-00* | 53583.56 | 0.161 | 0.1034 | 1.2(1) | 2.00 | 3.3(2) | 7.03(3) | 0.75(6) | 2.8(3) | 7.1(4) | 0.9(2) | 1.04 (69) | 6.30/3.88 | ”B” |
| 91103-01-06-00* | 53583.78 | 0.178 | 0.1047 | 1.19(2) | 2.00 | 3.2(3) | 7.08(5) | 0.90(9) | 3.0(4) | 7.0(1) | 0.05(3) | 1.25 (69) | 5.56/3.44 | |
| 91103-01-06-01* | 53584.68 | 0.246 | 0.1102 | 1.2(1) | 2.00 | 3.2(3) | 7.06(3) | 0.75(5) | 3.5(3) | 7.01(8) | 0.6(3) | 1.03 (69) | 6.79/4.01 | |
| 91103-01-08-00* | 53584.83 | 0.258 | 0.1112 | 1.2(1) | 2.00 | 3.0(4) | 7.12(9) | 0.98(6) | 4.1(3) | 7.0(1) | 0.5(3) | 1.03 (69) | 6.56/4.29 | |
| 91103-01-09-01* | 53585.95 | 0.344 | 0.1181 | 1.2(1) | 2.00 | 3.0(4) | 6.87(6) | 0.84(9) | 3.9(7) | - | - | 1.05 (69) | 6.54/4.34 | |
| 91092-01-01-00* | 53588.22 | 0.517 | 0.1321 | 1.20(3) | 0.6(3) | 2.71(4) | 6.89(3) | 0.75(6) | 3.7(4) | 9.1(1) | 0.2(1) | 0.96 (69) | 4.36/2.56 | |
| 91092-01-02-00* | 53588.35 | 0.527 | 0.1329 | 1.20(3) | 0.14(9) | 2.90(5) | 6.88(1) | 0.50(2) | 2.8(1) | - | - | 1.17 (69) | 5.93/3.58 | |
| 91092-02-01-02 | 53594.01 | 0.960 | 0.1678 | 1.20(3) | 0.57(4) | 2.11(4) | 6.90(5) | 0.46(7) | 1.6(1) | 8.3(1) | 0.3(1) | 1.08(73) | 3.22/1.92 | ecl |
| 91092-02-01-04 | 53594.14 | 0.970 | 0.1686 | 1.12(8) | 0.45(6) | 2.05(4) | 6.98(6) | 0.52(6) | 1.5(2) | 8.6(1) | 0.19(9) | 1.08(73) | 3.13/1.98 | ecl |
| 91092-02-01-00 | 53594.38 | 0.988 | 0.1701 | 1.07(3) | 0.35(2) | 2.0(1) | 6.89(2) | 0.38(2) | 1.3(1) | 8.37(8) | 0.34(8) | 1.12(73) | 2.98/1.95 | ecl |
| 91092-02-01-01 | 53594.58 | 0.004 | 0.1713 | 1.10(3) | 0.5(1) | 1.9(1) | 6.84(3) | 0.36(7) | 1.3(2) | 7.9(7) | 0.3(2) | 0.70(73) | 3.10/2.06 | ecl |
| 91092-02-07-01 | 53594.65 | 0.008 | 0.1717 | 1.2(1) | 0.31(4) | 2.0(3) | 6.70(6) | 0.38(8) | 1.1(1) | 8.3(2) | 0.2(1) | 1.13(71) | 2.78/1.63 | ecl |
| 91092-02-01-03 | 53594.72 | 0.014 | 0.1722 | 1.05(3) | 0.46(7) | 1.70(9) | 6.88(5) | 0.60(5) | 1.6(3) | 8.6(1) | 0.3(1) | 1.04(72) | 2.87/1.96 | ecl |
| 91092-02-02-00 | 53595.17 | 0.048 | 0.1749 | 1.10(3) | 0.4(3) | 1.7(1) | 6.90(3) | 0.65(6) | 1.71(2) | 8.72(9) | 0.20(7) | 1.11(72) | 3.04/2.02 | ecl |
| 91092-02-03-00 | 53595.49 | 0.073 | 0.1769 | 1.16(1) | 2.00(0) | 1.96(5) | 6.81(1) | 0.57(1) | 1.9(2) | 8.5(1) | 0.03(1) | 1.28(72) | 3.62/2.32 | ecl |
| 91092-02-04-00G* | 53596.15 | 0.123 | 0.1810 | 1.22(3) | 0.6(4) | 2.7(1) | 6.81(2) | 0.48(5) | 1.7(1) | 8.37(5) | 0.40(7) | 1.46 (69) | 5.63/3.54 | |
| 91092-02-05-00* | 53596.34 | 0.138 | 0.1822 | 1.20(3) | 0.5(3) | 2.9(1) | 6.83(1) | 0.46(4) | 2.6(2) | 8.44(8) | 1.2(4) | 1.46 (69) | 5.29/3.57 | |
| 91092-02-06-01* | 53596.96 | 0.185 | 0.1860 | 1.22(3) | 0.6(2) | 2.76(9) | 6.90(2) | 0.53(3) | 2.5(1) | 8.50(8) | 0.32(7) | 1.04 (69) | 5.14/3.26 | |
| 91092-02-06-02* | 53597.09 | 0.195 | 0.1868 | 1.20(3) | 2.00 | 3.0(2) | 6.93(4) | 0.54(8) | 2.2(2) | 8.7(3) | 0.2(1) | 1.02 (69) | 5.25/3.58 | |
| 91092-02-06-00* | 53597.13 | 0.198 | 0.1871 | 1.20(3) | 1.1(4) | 2.72(1) | 6.80(2) | 0.50(3) | 2.5(1) | 8.30(8) | 0.43(8) | 1.05 (69) | 5.52/3.53 | |
| 91092-02-07-00 | 53597.34 | 0.214 | 0.1883 | 1.20(3) | 2.00 | 3.1(2) | 6.88(2) | 0.46(4) | 2.2(2) | 8.5(1) | 0.17(8) | 1.10 (72) | 5.41/3.73 | |
| 91092-02-08-00* | 53598.38 | 0.293 | 0.1947 | 1.20(1) | 0.1(1) | 2.64(9) | 6.80(6) | 0.53(2) | 1.6(3) | 8.3(2) | 0.2(1) | 1.13 (71) | 3.358/1.71 | |
| 91103-01-10-00 | 53610.77 | 0.241 | 0.2712 | 1.18(4) | 2.00 | 2.59(3) | 6.63(2) | 0.40(4) | 2.3(1) | - | - | 1.08 (73) | 4.12/2.75 | |
| 92424-01-02-05 | 54085.94 | 0.563 | 0.2016 | 1.18(7) | 2.00 | 2.73(5) | 6.84(3) | 0.59(5) | 2.8(2) | - | - | 1.17 (73) | 4.51/3.28 | |
| 92424-01-01-00 | 54086.99 | 0.643 | 0.2081 | 1.19(4) | 2.00 | 3.11(7) | 6.70(3) | 0.51(8) | 2.5(3) | 8.2(1) | 0.2(2) | 1.10 (71) | 5.42/3.67 | |
| 92424-01-01-01 | 54087.97 | 0.718 | 0.2141 | 1.16(7) | 2.00 | 2.95(7) | 6.68(2) | 0.31(3) | 2.2(3) | 7.9(2) | 0.3(2) | 1.33 (71) | 5.57/4.26 | |
| 92424-01-01-02 | 54088.95 | 0.793 | 0.2202 | 1.21(5) | 2.00 | 3.13(5) | 6.66(1) | 0.29(7) | 2.0(5) | 7.8(2) | 0.6(4) | 1.43 (71) | 5.36/3.61 | |
| 92424-01-01-03 | 54089.92 | 0.867 | 0.2261 | 1.21(7) | 2.00 | 2.64(3) | 6.67(2) | 0.44(4) | 2.4(1) | - | - | 1.43 (73) | 4.59/2.99 | |
| 92424-01-02-02 | 54093.85 | 0.167 | 0.2504 | 1.16(3) | 2.00 | 2.31(4) | 6.53(2) | 0.16(6) | 2.3(2) | 7.9(1) | 0.4(1) | 1.22 (71) | 3.94/2.79 | |
| 92424-01-02-03 | 54094.91 | 0.249 | 0.2569 | 1.16(3) | 2.00 | 2.10(4) | 6.51(3) | 0.32(8) | 2.2(2) | 7.9(1) | 0.4(1) | 1.30 (71) | 3.85/2.48 | |
| 92424-01-02-04 | 54095.91 | 0.325 | 0.2630 | 1.16(3) | 2.00 | 2.34(6) | 6.53(5) | 0.23(3) | 1.9(3) | 7.8(3) | 0.3(2) | 0.93 (71) | 4.01/2.67 | |
| 92424-01-02-05 | 54096.73 | 0.388 | 0.2681 | 1.16(3) | 2.00 | 2.13(5) | 6.48(2) | 0.05(3) | 1.8(3) | 7.6(1) | 0.6(2) | 0.86 (71) | 3.86/2.54 |
† The spectral model is , ††when parameter , then it is fixed at 2.0 (see comments in the text), ††† normalization parameter of Gaussian1 and Gaussian2 components are in units of ergs/s/cm, of Gaussian2 component is fixed at 0.01 keV (see comments in the text), ††††spectral fluxes (F1/F2) in the 3 – 60/13 – 150 energy ranges, correspondingly, in units of ergs/s/cm2, * this observations are fitted with model, see values of the best-fit BB color temperature and EW in Table 4, 5 and 6, (a)term “ecl” marks the observations during the primary eclipse according to optical ephemerids (Goranskij et al., 1998).
| Model | Parameter | -01-01-00 | -01-01-01 | -01-01-02 | -01-01-03 | -01-02-00 | -01-02-01 | -01-03-00 | -01-03-01 | -01-03-02 |
|---|---|---|---|---|---|---|---|---|---|---|
| bmc | ||||||||||
| 2.32(2) | 2.30(2) | 2.30(1) | 2.30(2) | 2.30(2) | 2.31(2) | 2.31(2) | 2.29(2) | 2.29(2) | ||
| kT (keV) | 1.08(2) | 1.15(5) | 1.14(3) | 1.23(5) | 0.9(2) | 1.18(9) | 1.17(3) | 1.06(4) | 1.23(5) | |
| logA† | 0.3(1) | 0.4(2) | 2.00 | 0.3(1) | 1.8(1) | 0.9(6) | 2.00 | 0.16(2) | 0.4(1) | |
| N | 3.3(6) | 3.4(1) | 3.5(1) | 3.4(1) | 3.6(6) | 3.4(1) | 2.8(1) | 3.2(1) | 3.3(1) | |
| Gaussian1 | ||||||||||
| Eline1 (keV) | 7.06(1) | 7.23(3) | 7.02(3) | 7.15(2) | 7.12(2) | 7.07(2) | 7.10(2) | 7.02(3) | 7.04(2) | |
| (keV) | 0.75(2) | 0.96(8) | 0.87(4) | 0.80(4) | 0.80(3) | 0.97(4) | 0.90(4) | 0.70(7) | 0.73(4) | |
| N | 4.3(2) | 4.7(6) | 4.1(4) | 4.4(8) | 4.3(1) | 5.3(3) | 4.2(3) | 3.7(4) | 3.8(3) | |
| Gaussian2 | ||||||||||
| Eline2 (keV) | 9.08(5) | 9.2(3) | 8.9(2) | 9.3(2) | 9.2(1) | - | - | 8.8(1) | - | |
| N | 0.30(5) | 0.1(1) | 0.1(1) | 0.26(8) | 0.80(3) | - | - | 0.4(1) | - | |
| ’‘bbody” | ||||||||||
| T"bbody" | 5.5(1) | 5.9(2) | 5.9(3) | 5.3(1) | 5.4(4) | 5.7(4) | 6.4(6) | 5.4(4) | 5.3(5) | |
| (keV) | ||||||||||
| N | 3.2(1) | 3.6(3) | 2.8(5) | 4.3(4) | 3.3(5) | 3.3(4) | 1.9(3) | 1.9(3) | 1.1(2) | |
| EW"bbody" | 1.4(2) | 1.4(3) | 1.4(5) | 1.4(5) | 1.4(1) | 1.4(2) | 1.4(1) | 1.4(2) | 1.2(1) | |
| (keV) | ||||||||||
| Flux††† | ||||||||||
| 3 - 60 keV | 5.18 | 5.48 | 5.01 | 4.76 | 7.79 | 5.51 | 5.26 | 6.79 | 5.56 | |
| 13 - 150 keV | 2.84 | 2.99 | 2.69 | 2.30 | 4.65 | 3.02 | 3.03 | 4.02 | 3.38 | |
| (d.o.f.) | 1.24 (69) | 0.98 (69) | 1.15 (69) | 1.03 (69) | 0.97(69) | 1.05 (69) | 1.13 (69) | 1.14 (69) | 1.08 (69) |
†when parameter , then it is fixed at 2.0 (see comments in the text), †† normalization in units of ergs/s/cm, ††† spectral flux in units of erg/s/cm2, for Gaussian2 component was fixed at 0.01 keV.
| Model | Parameter | -01-02-00 | -01-05-00 | -01-05-01 | -01-06-00 | -01-06-01 | -01-07-00 | -01-08-00 | -01-09-01 |
|---|---|---|---|---|---|---|---|---|---|
| bmc | |||||||||
| 2.18(3) | 2.2(1) | 2.20(6) | 2.19(5) | 2.2(1) | 2.21(1) | 2.2(1) | 2.2(1) | ||
| kT (keV) | 1.04(1) | 1.29(8) | 1.25(6) | 1.22(7) | 1.23(6) | 1.21(4) | 1.18(7) | 1.11(9) | |
| logA† | 0.2(2) | 0.01(4) | 0.9(1) | 2.0 | 2.0 | 2.0 | 2.0 | 2.0 | |
| N | 2.21(2) | 2.5(3) | 3.1(4) | 3.2(3) | 3.2(3) | 3.3(2) | 3.0(4) | 3.0(4) | |
| Gaussian1 | |||||||||
| Eline1 (keV) | 6.70(2) | 7.08(6) | 7.02(7) | 7.08(5) | 7.06(3) | 7.03(3) | 7.12(9) | 6.87(6) | |
| (keV) | 0.27(3) | 0.75(8) | 0.75(9) | 0.90(9) | 0.75(5) | 0.75(6) | 0.98(6) | 0.84(9) | |
| N | 0.6(3) | 2.8(5) | 3.0(5) | 3.0(4) | 3.5(3) | 2.8(3) | 4.1(3) | 3.9(7) | |
| Gaussian2 | |||||||||
| Eline2 (keV) | 8.0(2) | - | - | 7.0(1) | 7.01(8) | 7.1(4) | 7.0(1) | - | |
| N | 0.4(1) | - | - | 0.05(3) | 0.6(3) | 0.9(2) | 0.5(2) | - | |
| ’‘bbody” | |||||||||
| T"bbody" | 4.9(2) | 4.9(2) | 4.9(4) | 5.1(9) | 5.1(3) | 5.6(5) | 5.2(4) | 5.5(3) | |
| (keV) | |||||||||
| N | 1.17(7) | 2.1(6) | 1.2(8) | 0.8(6) | 2.6(5) | 1.7(4) | 1.9(4) | 2.3(6) | |
| EW"bbody" | 1.2(2) | 1.3(3) | 1.4(5) | 1.4(5) | 1.4(1) | 1.4(2) | 1.4(1) | 1.4(2) | |
| (keV) | |||||||||
| Flux††† | |||||||||
| 3 - 60 keV | 4.99 | 3.90 | 5.41 | 5.56 | 6.72 | 6.30 | 6.56 | 6.54 | |
| 13 - 150 keV | 3.17 | 2.13 | 3.34 | 3.44 | 4.01 | 3.88 | 4.29 | 4.34 | |
| (d.o.f.) | 1.17(69) | 0.97 (69) | 1.05 (69) | 1.25 (69) | 1.01 (69) | 1.04(69) | 1.03 (69) | 1.05(69) |
†when parameter , it is fixed at 2.0 (see comments in the text), †† normalization in units of ergs/s/cm, ††† spectral flux in units of erg/s/cm2, for Gaussian2 component was fixed at 0.01 keV.
| Model | Parameter | -01-01-00 | -01-02-00 | -02-04-00G | -02-05-00 | -02-06-00 | -02-06-01 | -02-08-00 |
|---|---|---|---|---|---|---|---|---|
| bmc | ||||||||
| 2.20(3) | 2.20(3) | 2.22(3) | 2.2(3) | 2.22(1) | 2.22(3) | 2.20(1) | ||
| kT (keV) | 1.1(1) | 1.22(3) | 1.20(6) | 1.28(6) | 1.21(7) | 1.3(1) | 1.35(2) | |
| logA† | 0.6(3) | 0.1(1) | 0.6(4) | 0.5(3) | 1.2(1) | 0.6(2) | 0.1(1) | |
| N | 2.71(2) | 2.90(5) | 2.7(1) | 2.9(1) | 2.6(2) | 2.67(9) | 2.64(9) | |
| Gaussian1 | ||||||||
| Eline1 (keV) | 6.89(3) | 6.88(1) | 6.81(2) | 6.83(1) | 6.90(2) | 6.90(2) | 6.80(6) | |
| (keV) | 0.75(6) | 0.50(2) | 0.48(5) | 0.46(4) | 0.51(5) | 0.53(3) | 0.53(2) | |
| N | 3.7(4) | 2.8(1) | 1.7(1) | 2.6(2) | 2.4(2) | 2.5(1) | 1.6(3) | |
| Gaussian2 | ||||||||
| Eline2 (keV) | 9.1(1) | - | 8.37(5) | 8.44(1) | 8.4(9) | 8.50(8) | 8.3(2) | |
| N | 0.2(1) | - | 0.40(7) | 1.2(4) | 2.3(9) | 0.32(7) | 0.21(2) | |
| ’‘bbody” | ||||||||
| T"bbody" | 4.5(2) | 4.5(2) | 4.4(4) | 4.9(6) | 5.5(5) | 5.0(4) | 4.5(4) | |
| (keV) | ||||||||
| N | 1.7(7) | 2.2(4) | 1.3(4) | 2.8(5) | 1.9(6) | 1.7(1) | 1.9(3) | |
| EW"bbody" | 1.2(2) | 1.3(3) | 1.4(5) | 1.4(5) | 1.4(1) | 1.4(2) | 1.4(1) | |
| (keV) | ||||||||
| Flux††† | ||||||||
| 3 - 60 keV | 4.36 | 4.07 | 4.42 | 4.43 | 3.61 | 3.98 | 3.35 | |
| 13 - 150 keV | 2.56 | 2.44 | 2.80 | 2.90 | 1.46 | 1.81 | 1.71 | |
| (d.o.f.) | 0.96(69) | 1.07 (69) | 1.39 (69) | 1.06 (69) | 1.05 (69) | 0.96(69) | 1.05 (69) |
†when parameter , it is fixed at 2.0 (see comments in the text), †† normalization in units of ergs/s/cm, ††† spectral flux in units of erg/s/cm2, for Gaussian2 component is fixed at 0.01 keV.
| Source | M | iorb | iscal | Db | Mscal | Dscal | Refs |
|---|---|---|---|---|---|---|---|
| (M⊙) | (deg) | (deg) | (kpc) | (M⊙) | (kpc) | ||
| GX 339-4 | 6 | … | 70 | 7.51.6 | 12.31.4 | 5.750.8 | 1, 2 |
| SS 433 | 4.30.8 | 78.7 | 80 | 5.00.5 | … | 3, 4, 5 |