Chemical Processes in Protoplanetary Disks
Abstract
We have developed a high resolution combined physical and chemical model of a protoplanetary disk surrounding a typical T Tauri star. Our aims were to use our model to calculate the chemical structure of disks on small scales (sub-milli-arcsecond in the inner disk for objects at the distance of Taurus, 140 pc) to investigate the various chemical processes thought to be important in disks and to determine potential molecular tracers of each process. Our gas-phase network was extracted from the UMIST Database for Astrochemistry to which we added gas-grain interactions including freeze out and thermal and non-thermal desorption (cosmic-ray induced desorption, photodesorption and X-ray desorption) and a grain-surface network. We find that cosmic-ray induced desorption has the least effect on our disk chemical structure while photodesorption has a significant effect, enhancing the abundances of most gas-phase molecules throughout the disk and affecting the abundances and distribution of HCN, CN and CS, in particular. In the outer disk, we also see enhancements in the abundances of H2O and CO2. X-ray desorption is a potentially powerful mechanism in disks, acting to homogenise the fractional abundances of gas-phase species across the depth and increasing the column densities of most molecules although there remain significant uncertainties in the rates adopted for this process. The addition of grain-surface chemistry enhances the fractional abundances of several small complex organic molecules including CH3OH, HCOOCH3 and CH3OCH3 to potentially observable values (i.e. a fractional abundance of 10-11).
Subject headings:
astrochemistry — planetary systems: protoplanetary disks — stars: formation — solar system: formation — ISM: moleculesiint \savesymboliiint
1. INTRODUCTION
Protoplanetary disks are crucial objects in low-mass star formation, possessing three vital functions: they (i) aid the dissipation of angular momentum away from the young stellar system, (ii) allow the efficient accretion of matter onto the young star and (iii) contain all material, dust and gas, which may end up in a planetary system orbiting the main-sequence star.
In this work, we investigate the chemistry and molecular composition of a protoplanetary disk surrounding a young star which will evolve into a main-sequence star resembling our Sun. At the low temperatures encountered in many astrophysical regions ( 10 K to 100 K), molecules are readily excited into higher rotational energy states and subsequently emit radiation at (sub)millimeter wavelengths. Early observations of T Tauri stars at these wavelengths revealed the presence of molecular material in a flattened disk-like structure (e.g. Dutrey et al. (1994)) and in Keplerian rotation about the parent star (e.g. Guilloteau & Dutrey (1994)). Since then, molecular rotational line emission originating from a disk has been observed in several T Tauri systems including TW Hydrae (Kastner et al., 1997; van Zadelhoff et al., 2001; van Dishoeck et al., 2003; Ceccarelli et al., 2004; Thi et al., 2004; Qi et al., 2004, 2006, 2008), DM Tauri (Dutrey et al., 1997; Ceccarelli et al., 2004, 2005; Guilloteau et al., 2006; Dutrey et al., 2007; Piétu et al., 2007) and LkCa 15 (van Zadelhoff et al., 2001; Aikawa et al., 2003; Qi et al., 2003; Thi et al., 2004; Dutrey et al., 2007; Piétu et al., 2007). Most species detected are small simple molecules, molecular ions and radicals such as CO, HCO+, CN, HCN, CS, C2H and N2H+, along with several associated isotopologues (e.g. 13CO, C18O, DCO+, H13CN, H2D+ and C34S). The most complex species observed to date is the small organic molecule, formaldehyde, H2CO (Dutrey et al., 1997; Aikawa et al., 2003; Dutrey et al., 2007) with methanol, CH3OH, thus far eluding detection (e.g. Thi et al. (2004)). Ceccarelli et al. (2005) report a detection of deuterated water, HDO, in the disk of DM Tau, although this result has since been disputed by Guilloteau et al. (2006).
Infra-red emission has also been observed originating from disks embedded in young stellar objects and arising from vibrational transitions in gas-phase molecules capable of survival in the warmest regions ( 350 K). Thus, infra-red emission probes not only a different physical region of the disk to that probed by (sub)mm emission, but also uses different molecules as tracers, hence providing complimentary chemical information. The molecules detected thus far at infra-red wavelengths are CO, HCN, OH, H2O, CO2 and C2H2 (Carr et al., 2004; Lahuis et al., 2006; Carr & Najita, 2008; Salyk et al., 2008; Pascucci et al., 2009) with an upper limit determined for CH4 (Gibb et al., 2007).
Observations of molecular line emission from disks, to date, have been hampered by the small angular size of these objects on the sky and the limitations of existing facilities, explaining why the species detected are those which are abundant and possess relatively simple rotational energy spectra (e.g. CO). Single-dish facilities which operate at (sub)mm wavelengths such as the 15 m James Clerk Maxwell Telescope (JCMT) in Hawaii and the IRAM 30 m telescope in Spain, have been predominantly used in the detections of the molecular species in the T Tauri systems listed. With beam-sizes much larger than the typical source size, usually a single molecular line profile is generated characterising emission from the entire disk. In order to spatially resolve the emission and hence trace the radial and vertical physical and chemical structure, interferometry must be employed and indeed, Qi et al. (2008) report spatially resolved emission arising from molecular rotational transitions in the disk of TW Hya using the Sub-Millimeter Array (SMA).
The discipline of (sub)mm astronomy is scheduled for a revolutionary transformation with the first light of the Atacama Large Millimeter Array (ALMA) in Chile expected in 2012 (see http://www.almaobservatory.org). ALMA, with its 50 12 m telescopes and fully variable configuration, will have the spatial resolution necessary to observe molecular line emission from protoplanetary disks on sub-milli-arcsecond scales and enable the tracing of the molecular content of disks to within 0.1 AU of the parent star at its highest operational frequencies. It is anticipated that the sensitivity and high spectral resolution of ALMA will lead to the potentially overwhelming detection of many further molecular species, including complex organic molecules considered the building blocks of life, in many astrophysical sources including protoplanetary disks.
Motivated by the impending completion of ALMA, we have constructed a high resolution combined chemical and physical model of a protoplanetary disk surrounding a typical T Tauri star using as comprehensive a chemical network as computationally possible. In the work presented here, our objectives were (i) to calculate the chemical structure of protoplanetary disks on small (sub-milli-arcsecond in the inner disk) scales, (ii) to investigate the influence of various chemical processes, such as non-thermal desorption and grain-surface chemistry, thought to be important in disks, and (iii) to subsequently determine potential molecular tracers of each process. We also used our model to (i) compute molecular line emission profiles for rotational transitions which have been observed in disks using existing facilities, (ii) compare our modelled line profiles and intensities with existing observations and (iii) produce molecular line emission maps at the expected spatial resolution of ALMA for disks at various distances and inclinations. This second study and corresponding set of results will be covered in a subsequent paper (Walsh et al. in preparation). Our study also aims to help answer some fundamental questions concerning the evolution of stars, planets and ultimately, life. Is it possible for primordial (possibly organic) material created in a young star’s protoplanetary disk to survive the assimilation into planets and other planetary system objects? Is our solar system’s chemical and thus, planetary composition unique? How intrinsically linked are star formation, planet formation and the origin of life in the universe? These questions are evermore important as we move into the era of exoplanet research and the hunt for planets and the signatures of life in external stellar systems.
In Section 2 we describe the theoretical foundation and generation of the physical model used to characterise our protoplanetary disk (Section 2.1) and the chemical network we have collated and used in our calculation of the disk chemical evolution (Section 2.2) including gas-phase chemistry (Section 2.2.1), photochemistry (Section 2.2.2), gas-grain interactions (Section 2.2.3) and grain-surface chemistry (Section 2.2.4). The results of our chemical evolution calculations are covered in Section 3 where we discuss the chemical structure and stratification in the disk (Section 3.1), the effects of our included chemical processes (Sections 3.2 and 3.3), the disk ionisation fraction (Section 3.4) and the radial molecular column densities (Section 3.5). We briefly discuss our work in relation to similar projects by other research groups in Section 3.6 and finally, in Section 4, we summarise our work and outline our main conclusions and further work we intend to undertake.
2. PROTOPLANETARY DISK MODEL
2.1. Physical Model
The physical model of a protoplanetary disk we use in this work is from Nomura & Millar (2005) with the addition of X-ray heating as described in Nomura et al. (2007). They self-consistently modelled the density and temperature profiles of gas and dust in a protoplanetary disk accounting for UV and X-ray irradiation by the central star and subsequently computed molecular hydrogen line emission at ultraviolet and infrared wavelengths. Here, we have used this model to compute the chemical structure of a protoplanetary disk with the ultimate aim to expand on their work by calculating molecular line emission from disks at (sub)mm wavelengths. In the remainder of this section, we give a brief overview of our physical model and we refer readers to the original papers for the mathematical and computational details.
We consider an axisymmetric disk surrounding a typical T Tauri star with mass, = 0.5 , radius, = 2 and temperature, = 4000 K (Kenyon & Hartmann, 1995). The density and temperature distributions are determined through iteratively solving the equations for hydrostatic equilibrium in the vertical direction and the local thermal balance between the heating and cooling of the gas. The theoretical foundation of this model comes from the standard accretion disk model of Lynden-Bell & Pringle (1974) and Pringle (1981) which defines a surface density distribution for the disk given the parent star’s mass and radius and a disk mass accretion rate, . The kinematic viscosity in the disk is parameterised according to the work of Shakura & Sunyaev (1973), the so-called -prescription. We adopt a viscous parameter, = 0.01 and a mass accretion rate, = 10-8 yr-1.
The heating mechanisms included are grain photo-electric heating by far-ultraviolet photons and X-ray heating due to hydrogen ionisation by X-ray photons with cooling via gas-grain collisions and line transitions. We use a model spectrum created by fitting the observed XMM-Newton X-ray spectrum of the classical T Tauri star, TW Hya (e.g. Kastner et al. (2002)) with a two-temperature thin thermal plasma model (MEKAL model see e.g. Liedahl et al. (1995)). The X-ray luminosity is erg s-1 and the resulting X-ray spectrum is given in Figure 1 of Nomura et al. (2007).
The UV radiation field in disks has two sources, the star and the interstellar medium. In this disk model, the radiation field due to the T Tauri star has three components: black-body emission at the star’s effective temperature, optically thin hydrogenic bremsstrahlung emission and strong Lyman- line emission. All components are necessary to accurately model the excess UV emission observed towards classical T Tauri stars thought to arise from an accretion shock as disk material impinges upon the stellar surface (e.g. Valenti et al. (2000); Johns-Krull et al. (2000)). The total FUV luminosity in our model is erg s-1 with the calculation of the radiation field in the disk described in detail in Appendix C of Nomura & Millar (2005) and the resulting spectrum shown in Figure C.1 in that paper.
We assume the dust and gas in the disk is well-mixed and adopt the dust-size distribution model which reproduces the observational extinction curve of dense clouds (Weingartner & Draine, 2001). The calculation of the dust opacity in the disk is as described in Appendix D of Nomura & Millar (2005) with the resulting monochromatic absorption coefficient shown in Figure D.1. We note here that this is an over-simplification of the treatment of the dust-size distribution in protoplanetary disks and we are currently working on improving our model by adding in the effects of dust-grain settling and coagulation.
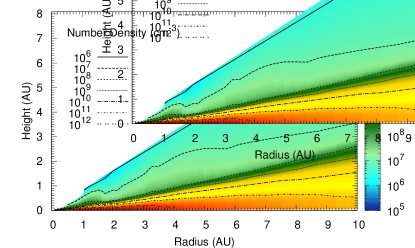
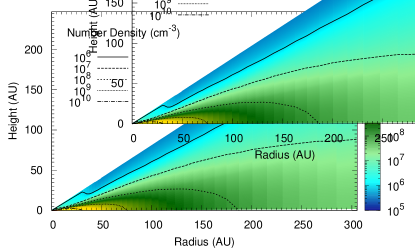
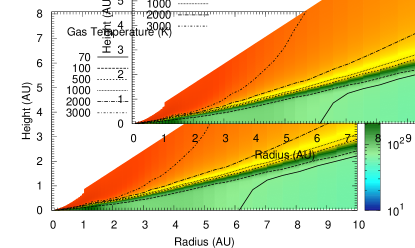
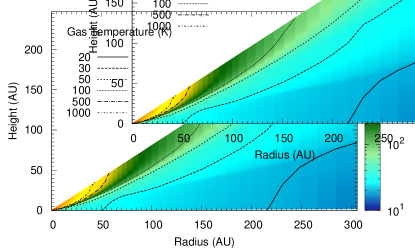
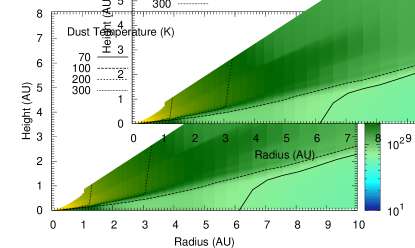
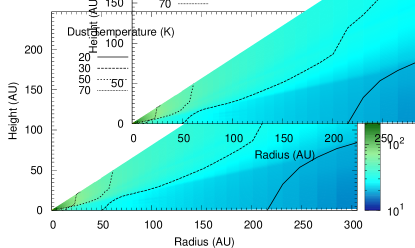
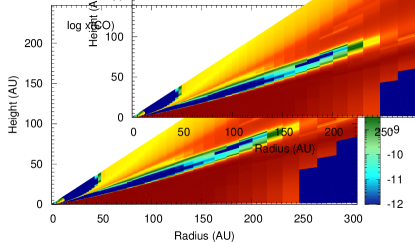
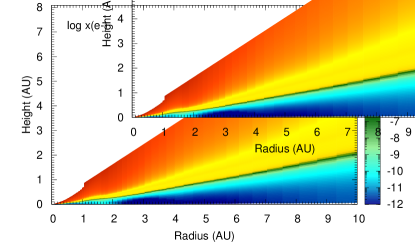
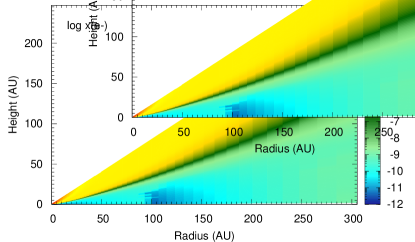
In Figure 1 we display the resulting number density (cm-3), gas temperature (K) and dust temperature (K) as a function of disk radius and height (top, middle and bottom rows, respectively). To illustrate the extreme vertical gradients in the physical conditions at small radii, we display the density and temperature both within 10 AU (left panels) and 305 AU (right panels). We describe the physical structure of our disk in the Appendix.
2.2. Chemical Model
The structure of the disk described in the preceding section leads to a multitude of different physical regimes and as such, we need to account for every chemical process which may occur. The axisymmetric structure results in a cold, dense midplane where even the most volatile molecules are expected to freeze out onto dust grains creating an icy mantle and depleting the gas of molecules. Moving in the vertical direction, the density decreases and the temperature increases driving the evaporation of molecules from grain surfaces and stimulating a rich gas-phase chemistry resulting in further molecular synthesis. Further towards the surface, the radiation fields increase in strength dissociating and ionising molecules into constituent radicals, atoms and ions. A similar stratification is expected in the radial direction as the temperature and density in the disk midplane both increase with decreasing distance from the star. When the midplane dust temperature reaches a value higher than the desorption temperature of a particular molecule, it is returned to the gas phase. This point is known as the snow line and can occur at a unique radius for each molecule. At small radii, due to the high densities found in the midplane, there is a significant column density of material shielding this region from the intense UV and X-ray fields of the star such that molecules are expected to survive in the midplane at radii within 0.1 AU.
In order to investigate the chemical structure thoroughly, we used a large gas-phase network supplemented with gas-grain interactions, including freeze out and thermal desorption. We considered various non-thermal desorption mechanisms, namely, cosmic-ray induced desorption, photodesorption and X-ray desorption. To probe the efficacy of molecular synthesis on grain-surfaces we also added a large grain-surface reaction network.
2.2.1 Gas-Phase Chemistry
Our gas-phase chemistry is extracted from the latest release of the ‘dipole-enhanced’ version of the UMIST Database for Astrochemistry (http://www.udfa.net), henceforth referred to as ‘Rate06’ (Woodall et al., 2007). We include almost the entire Rate06 gas-phase network removing only those species (and thus reactions) which contain fluorine, F, and phosphorus, P, in order to reduce computation time. We deemed the loss of F- and P-containing species to have a minimal impact on the remaining chemistry. Our gas-phase network thus consists of 4336 reactions involving 378 species composed of the elements H, He, C, N, O, Na, Mg, Si, S, Cl and Fe. The initial elemental fractional abundances (relative to total H nuclei density) we use are the set of oxygen-rich low-metallicity abundances from Graedel et al. (1982), listed in Table 8 of Woodall et al. (2007). We find by years, the typical age of protoplanetary disks, the chemistry has forgotten its origins, justifying our use of initial elemental abundances. We intend in future models to calculate the chemical evolution of a parcel of gas as it follows a streamline in the accretion flow in which case the input abundances should reflect the molecular make-up of the ambient cloud material. Our model grid has over 12,000 grid points in 129 logarithmically spaced radial steps from 0.04 AU to 305 AU.
2.2.2 Photochemistry
In the models presented here, we have approximated our photoreaction rates at each point in the disk, , by scaling the rates from Rate06 (which assume the interstellar UV field) using the wavelength integrated UV flux calculated at each point, . Hence, the rate for a particular photoreaction at each is given by
| (1) |
where is the interstellar UV flux and is the rate expected in the interstellar medium.
2.2.3 Gas-Grain Interactions
Gas-grain interactions are important in large areas of protoplanetary disks as the dust temperature can reach values lower than the freeze-out temperatures of molecules. If the freeze out of gas-phase species is allowed, then the evaporation of molecules from dust grains must also be included. In this work, we consider both the thermal and non-thermal desorption of molecules from dust grains. For the thermal desorption of a particular molecule to occur, the dust-grain temperature must exceed the freeze-out temperature of that molecule. Non-thermal desorption requires an input of energy from an external source and is thus independent of dust-grain temperature. As protoplanetary disks are irradiated by UV and X-ray photons from the central star as well as UV photons and cosmic-rays originating from the interstellar medium, the non-thermal desorption mechanisms we investigate are cosmic-ray induced desorption, photodesorption, and X-ray desorption. Our gas-phase chemical network has thus been supplemented with an additional 1154 gas-grain interactions involving 149 surface species.
The accretion rate (or freeze-out rate), , of species onto dust-grain surfaces is treated using the standard prescription (Hasegawa et al., 1992),
| (2) |
where is the sticking coefficient, here assumed to equal unity for all species, is the geometrical cross section of a dust grain with radius, , is the thermal velocity of species at a temperature, and with mass, , is Boltzmann’s constant, and is the number density of dust grains.
The thermal desorption rate, , of species is dependent on dust-grain temperature, (Hasegawa et al., 1992), and is given by
| (3) |
where is the binding energy of species to the dust grain in units of K. The characteristic vibrational frequency of each adsorbed species in its potential well, , is represented by a harmonic oscillator relation (Hasegawa et al., 1992),
| (4) |
where, here, is in units of erg and cm-2 is the number density of surface sites on each dust grain. The binding energies, , for several important molecules (mainly following those collated by Hasegawa et al. (1992) and Willacy et al. (1998)) are listed in Table 2.2.3. We intend to conduct a review of our set of desorption energies in light of more recent experimental results e.g. a recent investigation into the desorption of methanol by Brown & Bolina (2007) determined a binding energy of 5000 K, as opposed to the theoretical value of 2140 K used here (see Table 2.2.3). This binding energy was determined for pure methanol ice as opposed to methanol adsorbed onto, or mixed with, water ice. We find throughout our model that the ratio of methanol to water ice is less than 1%. Similar experiments for methanol adsorbed onto water ice (Brown, private communication) suggest that the binding energy of methanol in this complex is comparable with that determined for pure methanol but due to overlapping desorption features the results are difficult to analyse. Recent work by Bottinelli et al. (2010) comparing laboratory data with observations of methanol in young stellar objects (YSOs) suggests that methanol ice in these environments likely exists as pure ice or mixed with CO and/or CO2 ice which is consistent with its formation via hydrogenation of CO on dust grains. Considering the latter molecules are non-polar, it is possible that the binding energy of methanol in astrophysical ices is lower than that determined in the laboratory experiments. Increasing the binding energy of methanol to a value of 5000 K will increase the desorption temperature from 30 K to 40 K to 100 K. This will push the ‘snow line’ for methanol closer to the star but should have little effect on the outer disk methanol abundances where the dust temperature is 30 K. We expect non-thermal desorption to dominate over thermal desorption in the upper layers of the disk.
| Molecule | Binding Energy (K) | Reference |
|---|---|---|
| CO | 960 | 1 |
| N2 | 710 | 2 |
| HCN | 4170 | 2 |
| CO2 | 2690 | 3 |
| H2O | 4820 | 4 |
| NH3 | 3080 | 4 |
| CH4 | 1080 | 2 |
| C2H2 | 2400 | 2 |
| H2CO | 1760 | 5 |
| CH3OH | 2140 | 5 |
To calculate the cosmic-ray induced desorption rate for each species, , we use the method of Léger et al. (1985) and Hasegawa & Herbst (1993). They assume that dust grains with a radius of 0.1 m are impulsively heated by the impact of relativistic Fe nuclei with energies of 20 to 70 MeV nucleon-1 which deposit, on average, an energy of 0.4 MeV into each dust grain. Assuming that the majority of molecules desorb around 70 K, the cosmic-ray induced desorption rate can be approximated by
| (5) |
where is the the thermal desorption energy of species at a temperature of 70 K, calculated using Equation (3). The parameter, , is the fraction of time spent by grains in the vicinity of 70 K and can loosely defined as the ratio of the desorption cooling time ( s-1) to the time interval between successive heatings to 70 K (3.16 s) so that (for further details see Hasegawa & Herbst (1993)).
Note that the method of calculating the cosmic-ray induced desorption rates is species dependent and a function of surface binding energy. In contrast, the photodesorption rates are indiscriminate, based on the experimental results of Westley et al. (1995) and Öberg et al. (2007). Their results suggest each photon absorbed by the grain mantle returns a particular number of molecules, independent of binding energy, to the gas phase so that the desorption rate of each species varies according to its fractional abundance on dust-grain surfaces. The overall photodesorption rate is calculated, similar to the work of Willacy & Langer (2000) and Willacy (2007), using
| (6) |
where, is the UV radiative flux in units of photons cm-2 s-1, is the experimentally determined photodesorption yield in units of molecules photon-1, is the geometrical dust-grain cross section in cm2 and is the fractional abundance of dust grains. Note that the attenuation of UV radiation is accounted for in our calculation of . Hence, the photodesorption rate for a specific species, , is calculated using
| (7) |
where, is given by Equation (6), is the number density of species frozen out onto grain surfaces and is the total number density of grain-surface species. More recent experiments by Öberg et al. (2009a, b) suggest that photodesorption rates are also dependent on the depth of the ice layer on grain surfaces with the molecular yield also dependent on ice composition. We intend to explore these experimental results in future models.
For the X-ray desorption rates, we follow the same formulation as for photodesorption, covered in the theory of Léger et al. (1985) and Najita et al. (2001). At this point, it is worth noting that X-ray desorption is the least theoretically or experimentally constrained of all the non-thermal desorption mechanisms considered here. The overall X-ray desorption rate, , is given by
| (8) |
where, is the X-ray photon flux in units of photons cm-2 s-1, is the desorption yield in units of molecules photon-1 and the product, , is the effective cross section with , the probability of X-ray absorption by the dust grain. The X-ray desorption rate for each individual species, , is calculated according to the fractional abundance of species on the dust grains following Equation (7). Here, we adopt a value from the investigations of Najita et al. (2001) and for the effective grain cross section we use values from the work of Dwek & Smith (1996) regarding energy deposition into grains by energetic photons in the energy range 10 eV to 1 MeV. Najita et al. (2001) consider X-ray desorption from grains of various compositions and morphologies and conclude that both have a significant influence on the X-ray desorption yields calculating values for ranging between 10 and 4000 molecules photon-1. In this work, we adopt a conservative estimate of the yield of 200 molecules photon-1 as this is the value for the dust morphology which most closely matches our simple dust-grain model. Given the large X-ray luminosities of T Tauri stars (see e.g. Kastner et al. (1997, 2002)), we plan a more thorough study on the effects of X-ray desorption in protoplanetary disks taking into consideration the X-ray energy spectrum as a function of disk radius and height and investigating the full parameter space considered in the work of Najita et al. (2001).
2.2.4 Grain-Surface Chemistry
We use the grain-surface network from Hasegawa et al. (1992) and Hasegawa & Herbst (1993) which has 221 reactions involving an additional 9 surface species which do not have a gas-phase equivalent (e.g. CH3O). To calculate the reaction rate coefficients, we use the theory outlined in detail in Hasegawa et al. (1992). The rate coefficient for a grain-surface reaction between species and can be defined as
| (9) |
Here, is the probability that the reaction happens upon encounter and is equal to unity for an exothermic reaction without an energy barrier. For reactions with an activation energy, , and at least one light reactant i.e. H or H2, where is the barrier thickness and is the reduced mass of the reaction system. This expression is the exponential part of the quantum mechanical probability for tunneling through a rectangular barrier of thickness, . The term, , is the diffusion rate of an adsorbed species and is the inverse of the diffusion time, , defined as s, where is the total number of surface sites per dust grain and is the timescale for an adsorbed species to ‘hop’ from one surface site to another. The expression for depends on the mass of the species and is given by
| (10) |
where is the energy barrier between surface sites. All other parameters have been defined previously.
3. RESULTS
We calculate the chemical abundances in the disk as a function of disk radius, height and time. The results displayed here are extracted at a time of 106 yr, the typical age of visible T Tauri stars with accompanying protoplanetary disks. Throughout this section, fractional abundance refers to the abundance of each species with respect to total particle number density. In Section 3.1, we display and discuss results from model PH+CRH only, to illustrate the global chemical structure and stratification in the disk. Table 2 lists the names and ingredients of each model for which we present results. Our ‘fiducial’ model is model PH+CRH since most current chemical models of protoplanetary disks include photodesorption and cosmic-ray induced desorption by default. In model CRH we remove photodesorption to investigate the influence of cosmic-ray induced desorption, in model XD we look at the effects of X-ray desorption only, and in model GR, we investigate the addition of grain-surface chemistry to our fiducial model. Of course, there are many more permutations of the ingredients which are worthwhile considering in the future e.g. X-ray desorption plus grain-surface chemistry.
| 0 | CRH | PH+CRH | XD | GR | |
|---|---|---|---|---|---|
| Thermal desorption | ✓ | ✓ | ✓ | ✓ | ✓ |
| Cosmic-ray induced desorption | ✓ | ✓ | ✓ | ||
| Photodesorption | ✓ | ✓ | |||
| X-ray desorption | ✓ | ||||
| Grain-surface chemistry | ✓ |
3.1. Chemical Structure
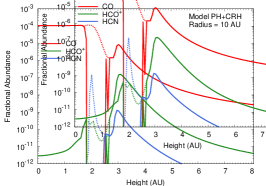
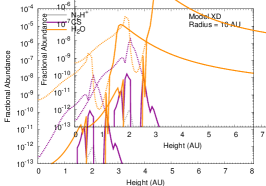
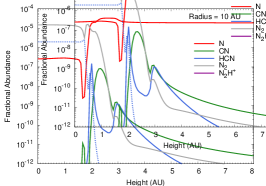
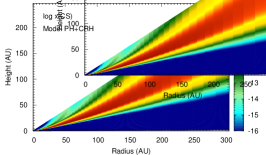
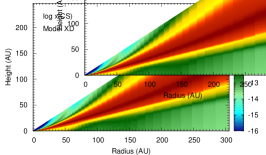
Figure 3.1 displays the fractional abundances of those molecules observed in disks (CO, HCO+, HCN, CN, CS, C2H, H2CO and N2H+) as a function of disk radius and height, up to maximum radii of 10 AU (left column) and 305 AU (right column).
The global abundance distribution of molecules is governed by the binding energy of each molecule to dust grains and the UV radiation field strength. We see most molecules existing predominantly in a molecular layer of varying thicknesses at a height, 0.3 to 0.5 in the outer disk and 0.2 to 0.3 in the inner disk with freeze out causing depletion in the midplane and photolysis causing destruction in the upper layers. CO is an exception to this and is abundant (x(CO) ) throughout the majority of the depth of the outer disk ( 50 AU) with depletion due to freeze out in the disk midplane only occurring beyond a radius of 250 AU. In the inner disk ( 50 AU), gas-phase CO is abundant in the disk midplane due to its low binding energy to the dust grains. In this region, however, we see most molecules confined to the ‘molecular layer’. In the outer disk HCO+ has a peak fractional abundance of 10-10 to throughout most of the disk, mirroring the distribution of CO. Within 50 AU, it is confined to a thin layer at a height 0.3 with x(HCO+) 10-6 which coincides with the transition zone where the gas composition changes from molecular to atomic hydrogen.
Gas-phase HCN has a peak fractional abundance of x(HCN) existing in the molecular layer throughout the disk. HCN can remain frozen out onto dust grains within radii 1 AU of the parent star demonstrating the effects of the vastly different desorption energies of CO and HCN (960 K and 4170 K, respectively). The distribution of CN is complementary to that of HCN as it is predominantly formed via the photodissociation of the latter molecule. Hence, throughout the disk, CN exists in a layer above that of HCN with a fractional abundance 10-6. In the outer disk, CN can survive in the surface region, however, the increasing UV field strength in the inner disk means that CN is also destroyed by photodissociation in the disk surface.
The distribution of the radicals, CS and C2H are similar to that of CN since both are formed predominantly via the UV photolysis of larger precursor molecules (e.g. H2CS and C2H2). H2CO reaches its maximum fractional abundance (x(H2CO) ) in the outer disk, although, within 10 AU, this value is reduced to and H2CO is confined to the molecular layer. H2CO is returned to the gas phase in the disk midplane within 1 AU.
The fractional abundance distribution for N2H+ is different to any of the molecules considered thus far. N2H+ reaches its maximum fractional abundance of in the outer disk only and is present where gas-phase CO is depleted e.g. in the disk midplane beyond a radius of 250 AU. In dense regions, the main destruction mechanism of N2H+ is via reaction with CO. In the upper layers, N2H+ increases in abundance due to the increased abundance of both N2 and cations, such as, H3+. Within 10 AU, x(N2H+) remains less than 10-13.
![[Uncaptioned image]](/html/1008.4305/assets/x7.png)
![[Uncaptioned image]](/html/1008.4305/assets/x8.png)
![[Uncaptioned image]](/html/1008.4305/assets/x9.png)
![[Uncaptioned image]](/html/1008.4305/assets/x10.png)
![[Uncaptioned image]](/html/1008.4305/assets/x11.png)
![[Uncaptioned image]](/html/1008.4305/assets/x12.png)
![[Uncaptioned image]](/html/1008.4305/assets/x13.png)
![[Uncaptioned image]](/html/1008.4305/assets/x14.png)
Fractional abundances of several molecules observed in disks as a function of disk radius and height up to maximum radii of 10 AU (left) and 305 AU (right).
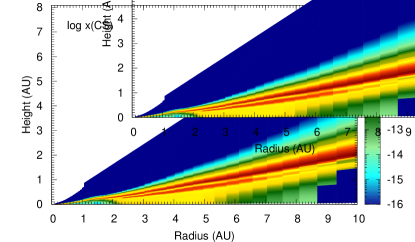
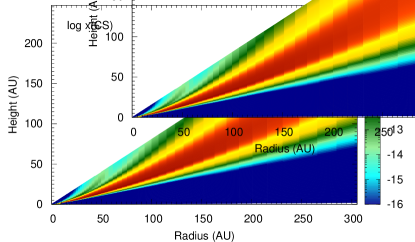
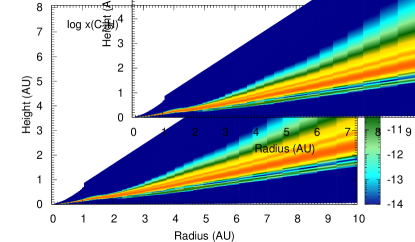
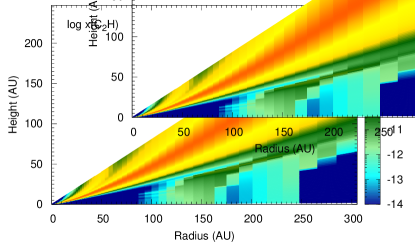
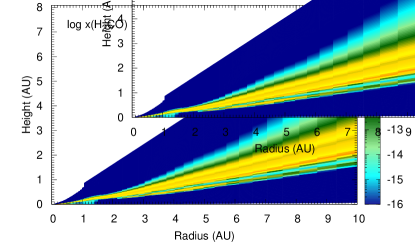
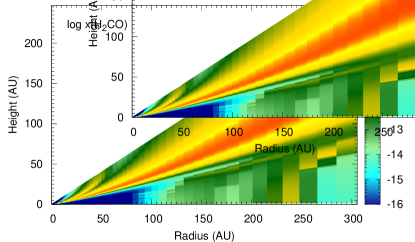
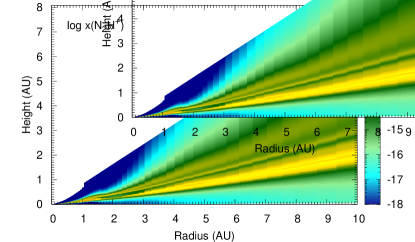
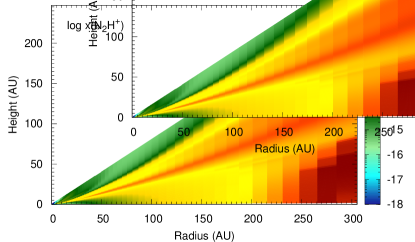
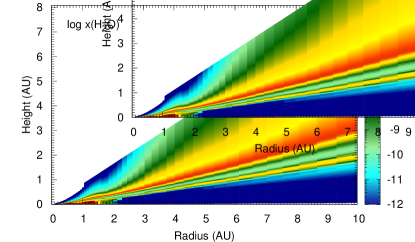
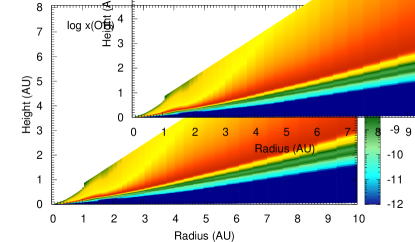
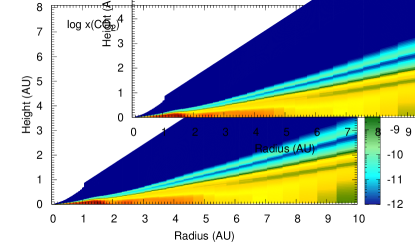
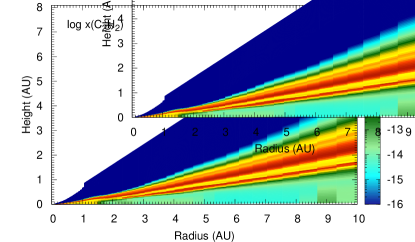
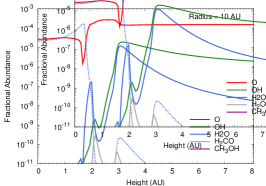
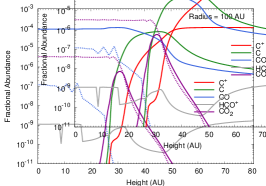
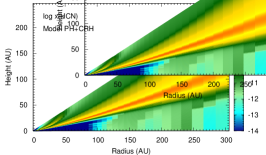
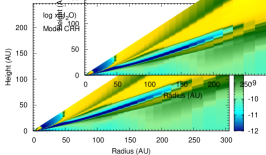
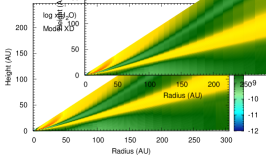
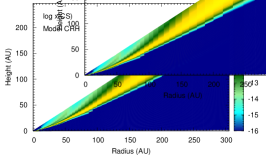
Figure 3 displays the fractional abundances of those additional molecules observed at infrared wavelengths, H2O (top), OH (second), CO2 (third) and C2H2 (bottom), as a function of disk radius and height up to a maximum radius of 10 AU. We display results from within 10 AU only as infrared emission originates from the inner hot, dense disk material.
Gas-phase H2O is confined to the molecular layer with a fractional abundance x(H2O) . As above, freeze out is responsible for depletion in the midplane and photolysis for depletion in the upper layers. H2O is returned to the gas phase in the midplane at a radius 1 to 2 AU. The distribution of OH is complimentary to that of H2O residing throughout the disk in a layer above that of gas-phase H2O, reaching a peak fractional abundance of . The distribution of CO2 is similar to that of CO in the inner disk, existing only in the midplane with a maximum value of within a few AU of the star. The snow-line for CO2, however, is at the much smaller radius of 10 AU (as opposed to 250 AU). Acetylene, C2H2, reaches a peak fractional abundance of , in the molecular layer. C2H2 and similar molecules are formed in hotter regions where oxygen is depleted from the gas phase via freeze out of oxygen containing molecules onto dust grains driving a carbon chemistry and hydrocarbon synthesis.
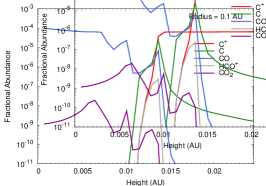
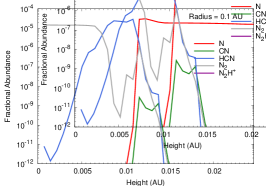
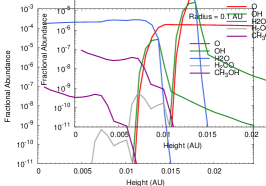
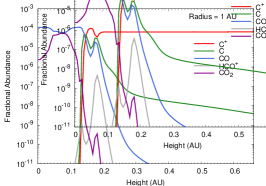
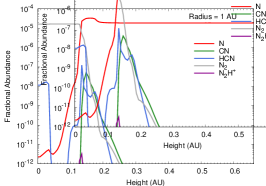
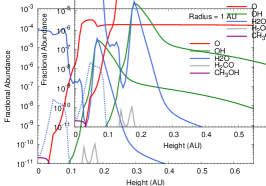
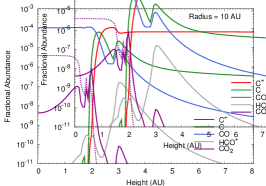
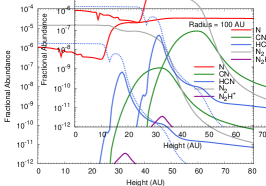
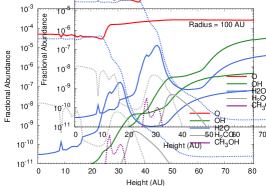
In Figure 9 (online only) we display the fractional abundances of the gas-phase molecules discussed above, along with constituent atoms and grain-surface analogues where applicable, as a function of disk height at radii = 0.1 AU, 1 AU, 10 AU and 100 AU.
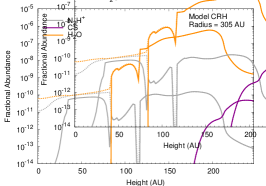
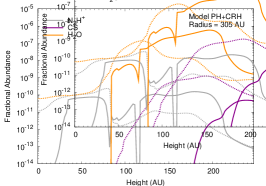
3.2. Effects of Non-thermal Desorption
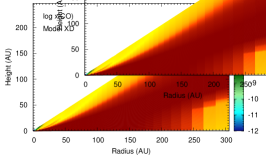
In this section, we discuss the effects of each of our non-thermal desorption mechanisms, cosmic-ray induced desorption, photodesorption and X-ray desorption, on the disk chemical structure (models CRH, PH+CRH and XD in Table 2, respectively). We call our control model, which includes thermal desorption only, model 0. First, we show in Figure 4 those regions of the disk in which molecules are depleted if we take into account thermal desorption only presenting, as an example, the gas-phase CO fractional abundance as a function of disk radius and height from model 0. We discuss how efficiently each non-thermal desorption mechanism works against depletion throughout the disk in Sections 3.2.1 to 3.2.3. We display the fractional abundances of several gas-phase species as a function of disk radius and height comparing results from each of our non-thermal desorption models in Figure 10 (online only).
In Figure 4 there are three notable areas where CO is depleted from the gas phase, (i) in the midplane beyond a radius of 250 AU, (ii) in a layer at a height of 0.3 and (iii) in the disk surface between a radius of a few AU to 50 AU. In region (i), the depletion is due to freeze out of CO onto dust grains as the dust temperature here is below the desorption temperature of CO. The absence of any non-thermal desorption means that CO is completely removed from the gas phase. For region (ii), the depletion is due to the destruction of CO by UV radiation. At this point, the UV field is strong enough to dissociate CO into its constituent atoms (atomic carbon and oxygen), however, the dust temperature is also low enough for the freeze out of molecules which have binding energies larger than that of CO e.g. H2O. By a time of years, the time at which we extract our abundances, atomic carbon and oxygen are trapped in molecules contained in the icy mantle. Above this height, the dust temperature becomes high enough for many molecules to desorb thermally thus replenishing the stock of C and O to reform CO. In region (iii), a similar effect to that in region (ii) occurs due to the decoupling of the dust and gas temperatures in the disk surface with the dust temperature up to two orders of magnitude lower than the gas temperature. The thermal desorption rate is dependent only on the dust temperature ( ) whereas the accretion rate depends both on the gas temperature and the number density of dust grains (see Equations 2 and 3). Since the gas temperature can be much higher than the dust temperature in this region, the accretion rate can supersede that of thermal desorption so that by years, molecules which can survive the intense UV radiation field are able to freeze out onto dust grains. Specifically, H2O molecules are able to survive as ice on dust grains thereby depleting the gas phase of oxygen-bearing molecules such as CO.
3.2.1 Cosmic-ray Induced Desorption
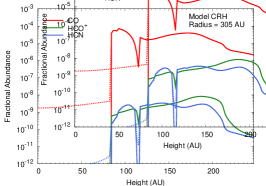
The left columns of Figures 5 and 6 display the fractional abundances of several molecules and molecular ions as a function of disk height at radii = 10 AU and 305 AU, respectively, comparing the results from model 0 (solid lines) with model CRH (dotted lines). Cosmic-ray induced desorption has the smallest effect on the gas-phase abundances and only in the outer disk midplane. The fractional abundances of gas-phase CO and H2O are enhanced in the disk midplane at 305 AU in the results for model CRH, compared with those for model 0, although the values reached remain orders of magnitude smaller than those in the upper disk layers. The fractional abundance of N2H+ is also enhanced, due in part to the release of N2 from dust grains in this region by cosmic-rays and, in fact, reaches its maximum fractional abundance in the disk midplane. As our model disk is truncated at 305 AU, we would expect the effects of cosmic-ray induced desorption to continue beyond this radius.
3.2.2 Photodesorption
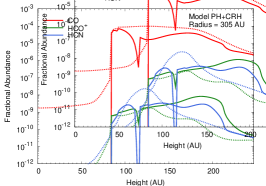
Photodesorption is the most experimentally constrained non-thermal desorption mechanism we have included in our model. Photodesorption has an effect in the upper disk layers where the UV radiation field has reached an appreciable strength yet the temperature remains low enough for freeze out to occur. We compare the results from model 0 (solid lines) with those from model PH+CRH (dotted lines) in the middle plots of Figures 5 and 6. Photodesorption enhances the abundance of molecules in the molecular region of the disk, counteracting the depletion effects discussed at the beginning of Section 3.2. Clearly seen at a radius of 10 AU is the smoothing of molecular abundances throughout the middle region of the disk with both model results converging higher in the surface. At a radius of 305 AU, there is a smoothing out of abundances counteracting depletion but also a slight difference in the distribution of molecules in the surface regions. The fractional abundances of CO and CS are enhanced in model PH+CRH relative to model 0, whereas those of HCO+, H2O, HCN and N2H+ are reduced. This is due to the alteration of gas-phase chemistry when photodesorption is included as a significant amount of all molecules can remain in the gas phase in the mid and upper layers of the disk. Thus, those molecules which ordinarily would be frozen out in the absence of photodesorption are available to take part in gas-phase reactions e.g. N2H+ is destroyed via reaction with gas-phase CO so that an enhancement in the abundance of the latter leads to a corresponding drop in that of the former.
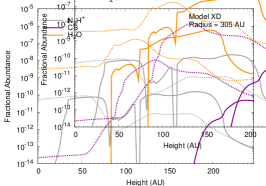
3.2.3 X-ray Desorption
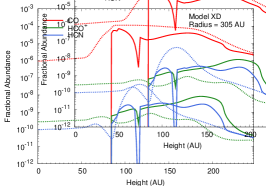
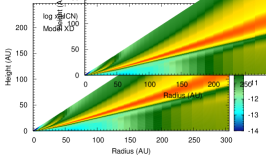
X-ray desorption is the least theoretically or experimentally constrained non-thermal desorption mechanism we considered, hence, we have used conservative estimates of molecular yields and thus X-ray desorption rates. The right-hand plots in Figures 5 and 6 suggest that, even using conservative estimates, X-ray desorption has the largest effect on gas-phase molecular abundances. X-rays, with their higher energy, can penetrate deeper into the disk material than UV photons, hence, X-rays have an effect in the disk midplane as well as in the molecular region. At = 10 AU (top plot), the abundances of both H2O and CS are enhanced in model XD relative to the results from models 0, CRH and PH+CRH. X-ray desorption also acts to smooth out abundances in the upper disk, similar to the effects of photodesorption. At 305 AU, the effects of the inclusion of X-ray desorption are most apparent. The fractional abundances of all molecules considered here, with the exception of CS, are enhanced in the midplane of the disk, to values comparable with those found in the upper disk regions. In fact, it appears that the inclusion of X-ray desorption acts to smooth or homogenise the fractional abundances of gas-phase CO, H2O and HCO+ throughout the depth of the disk. Again, as seen in the results for photodesorption, the gas-phase distributions are altered in model XD compared with model 0 due to the alteration of the gas-phase chemistry. In the upper disk, the results for models PH+CRH and XD are similar with the exception of the fractional abundance of CS which is enhanced in abundance between height of 70 AU and 150 AU in model XD relative to model PH+CRH.


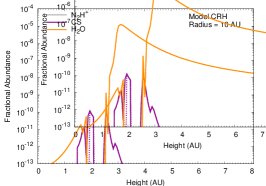
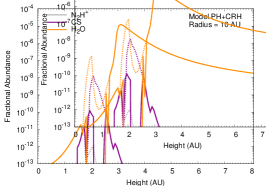
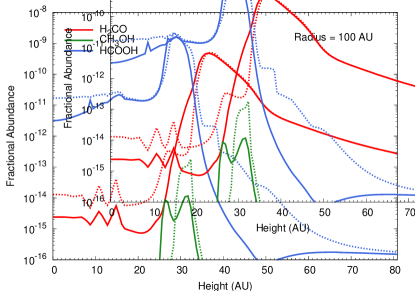
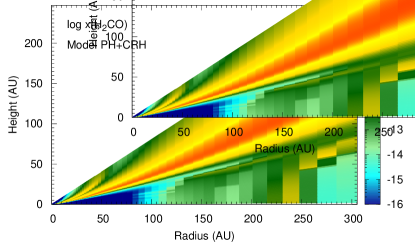
3.3. Effects of Grain-surface Chemistry
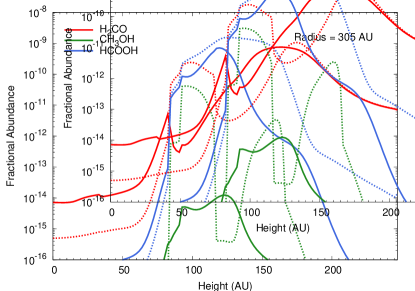
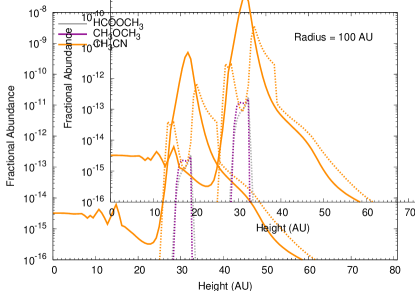
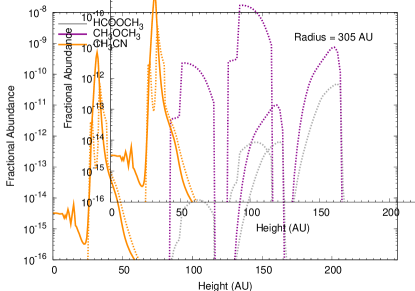
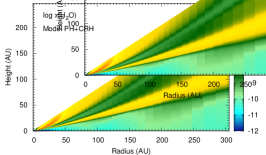
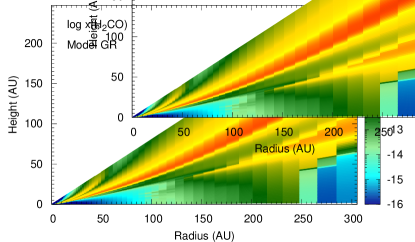
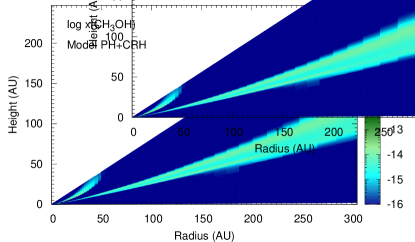
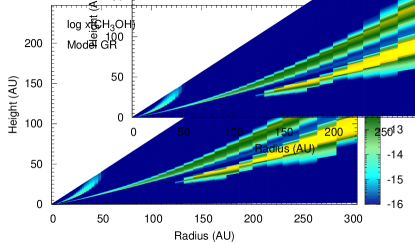
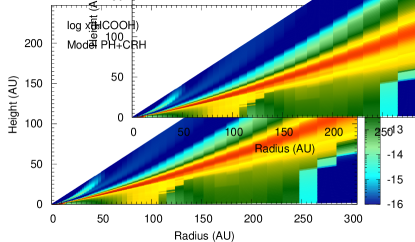
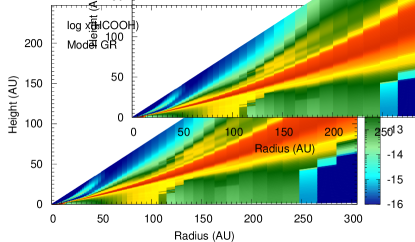
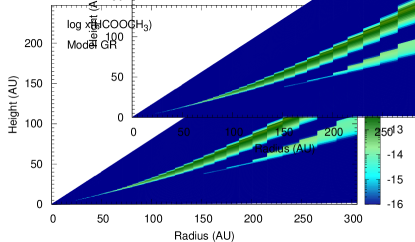
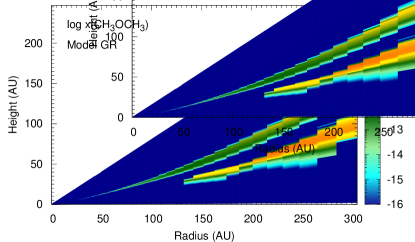
The addition of grain surface chemistry is expected to aid the synthesis of complex organic molecules in regions of the disk where significant freeze out has occurred. In this discussion, we look at the abundances of small organic (saturated) molecules in the outer disk in particular. In model GR (see Table 2), in addition to grain-surface chemistry, we also add cosmic-ray induced desorption and photodesorption. Figure 7 shows the fractional abundances of several small organic molecules as a function of disk height at radii, = 100 AU (left) and 305 AU (right), for model PH+CRH (solid lines) compared with model GR (dotted lines). At 100 AU, the fractional abundance of HCOOH (formic acid) and H2CO (formaldehyde) are enhanced in the disk midplane in model GR, relative to model PH+CRH, with the abundance of HCOOH also enhanced in the upper disk layer. Most of the organic molecules considered reach their peak fractional abundance between 25 and 40 AU. Here, the fractional abundances of CH3OH (methanol), HCOOCH3 (methyl formate) and CH3OCH3 (dimethyl ether) are all enhanced to a value in model GR, orders of magnitude larger than the respective values from model PH+CRH. At the very outer edge of our disk model, = 305 AU, the fractional abundances of all molecules are enhanced in model GR relative to model PH+CRH. Of note is the extreme enhancement seen in the abundances of CH3OH, HCOOCH3 and CH3OCH3, again by several orders of magnitude, to fractional abundances which are potentially observable ( to ). By fitting observed line intensities of rotational transitions in a selection of molecules with a simple disk model, Thi et al. (2004) estimate the column density of the relatively complex molecule, H2CO, in several protoplanetary disks as lying between 1012 and 1013 cm-2 which in the outer disk translates roughly to a fractional abundance of 10-10 as the H2 column density here is 1022 cm-2. Complex organic molecules in hot cores and dark clouds are routinely observed with fractional abundances 10-11 (see e.g. Herbst & van Dishoeck (2009)). We display the fractional abundances of the molecules discussed in this section as a function of disk radius and height comparing results from model PH+CRH and model GR in Figure 11 (online only).
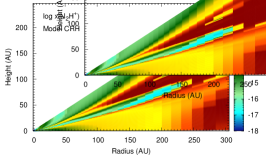
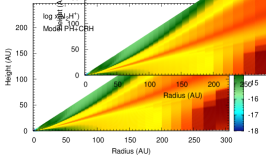
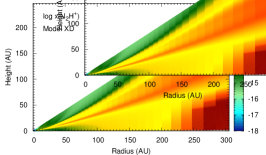
3.4. Disk Ionisation Fraction
The ionisation fraction in protoplanetary disks is an important parameter as it is thought that this drives the accretion flow in the disk through the coupling of the gas with the strong magnetic fields generated by the system. The required turbulence is generated via magneto-rotational instabilities or MRI (Balbus & Hawley, 1991; Hawley & Balbus, 1991). For effective accretion, the ionisation fraction is required to exceed a critical level which is dependent on the nature of the star-disk system (see e.g. Ilgner & Nelson (2006)). Regions in which the ionisation fraction falls below this critical value and where effectively magneto-hydrodynamic accretion is switched off, are termed ‘dead zones’.
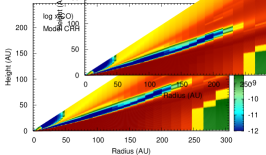
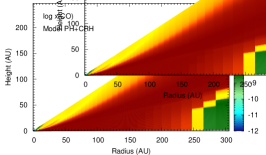
Figure 8 shows the electron fractional abundance as a function of disk radius and height within a radius of 10 AU (left) and 305 AU (right) using the results from model PH+CRH. The ionisation fraction varies between a minimum value of in the densest region of the disk up to a value of 0.1 in the hottest, most irradiated surface region closest to the star. We find that we attain similar electron abundances throughout the disk regardless of chemical model. The ionisation threshold required for effective accretion is related to the magnetic Reynold’s number (Gammie, 1996) which must be determined in advance of addressing the location of any ‘dead zones’ in our particular star-disk system. The question of whether accretion is suppressed in our disk model will be considered in detail in a subsequent publication in which we also investigate the effects of the recalculation of photo-rates and direct X-ray ionisation on the disk chemical structure and ionisation fraction.
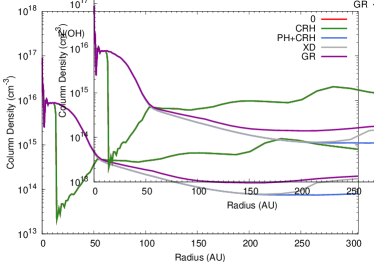
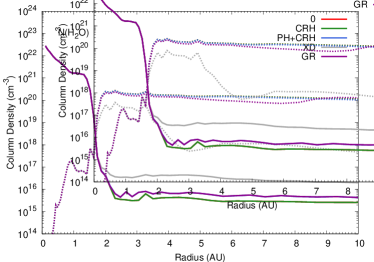
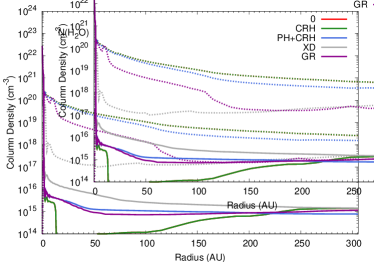
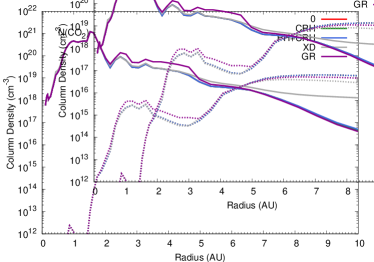
3.5. Radial Column Densities
The column density, , at each radius, , for each species, , is calculated by integrating the number density over the depth of the disk i.e.
| (11) |
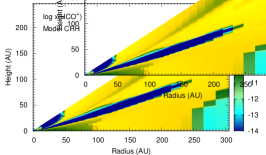
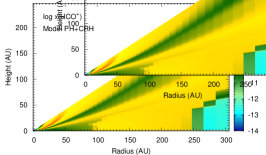
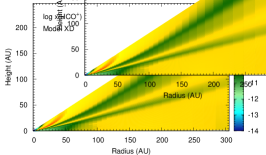
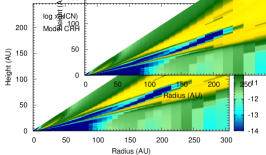
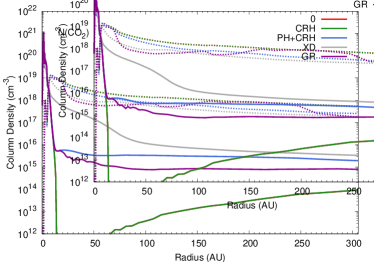
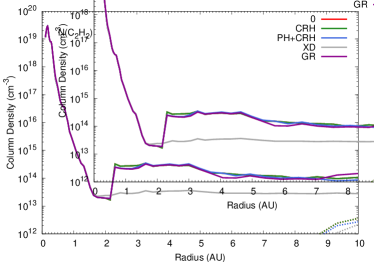
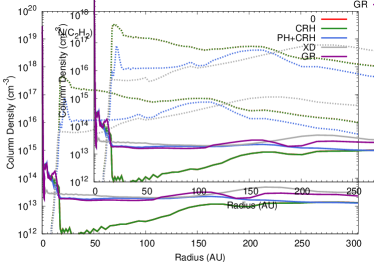
The radial column densities provide an excellent means to trace the radial mass distribution in the disk and also to compare directly results from each of our chemical models to determine the species sensitive to each chemical process. In Table 3 we list the column densities of various important molecules at radii of 1 AU, 10 AU, 100 AU and 305 AU for each chemical model and we display the column densities of many of the molecules discussed thus far, as a function of radius, up to maximum radii of 10 AU (left) and 305 AU (right) in Figure 12 (online only).
At a radius of 1 AU, the column densities are relatively insensitive to the choice of chemical model, unsurprising given that most molecules are in the gas phase at this radius and the chemistry is dominated in the midplane by neutral-neutral reactions and in the surface by photo-chemistry.
At 10 AU, the effects of the inclusion of non-thermal desorption become apparent. The column densities for those models which include photodesorption are consistently higher for all molecules with the column densities of HCN, CN and CS particularly sensitive. X-ray desorption has a similar effect although we also see a dramatic increase in the column densities of H2O and CO2 due to the penetrative power of X-rays in this region. This is due to the relatively strong X-ray field at this radius coupled with the low column density of intervening absorbing material (from the disk surface to the midplane). Grain-surface chemistry has only a mild effect at 10 AU on the column densities of the listed molecules. For the molecular ions, HCO+ and N2H+, the addition of photodesorption causes a rise in the column densities of both molecules while the addition of X-ray desorption produces a fall in the column density of the former and a rise in that of the latter.
At 100 AU, we see some of the same behaviour as at 10 AU with photodesorption increasing the column densities of CO, HCN, CN, CS, C2H, H2CO, H2O, CO2 and C2H2 with HCN, CS and CO2 particularly affected. X-ray desorption further enhances the column densities of these species. Here, we begin to see the effects of grain-surface chemistry with HCN, H2O and CO2 casualties of the increased synthesis of more complex species.
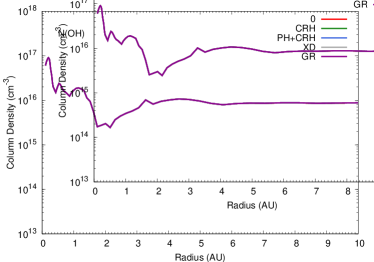
Finally, in the outer disk, the effects of cosmic-ray induced desorption on the column density of N2H+ become apparent, so that this molecule is a potential observable tracer of this desorption mechanism. We can also see how both photodesorption and X-ray desorption act to counteract the depletion of CO onto dust grains in the outer cold disk midplane thus enhancing its overall column density. In the outer disk, observable in the column densities is the detrimental effect that the addition of grain-surface chemistry has on the column densities of HCN and CS in particular, as N and S atoms are incorporated into larger, more complex species, via grain-surface reactions. We can also see the dramatic effect on methanol due to the inclusion of grain-surface chemistry with its column density enhanced by around three orders of magnitude.
| Species | 0 | CRH | PH+CRH | XD | GR |
|---|---|---|---|---|---|
| 1 AU | |||||
| H2 | 1.9(25) | 1.9(25) | 1.9(25) | 1.9(25) | 1.9(25) |
| CO | 2.3(21) | 2.3(21) | 2.3(21) | 2.3(21) | 2.3(21) |
| HCO+ | 1.7(14) | 1.7(14) | 1.7(14) | 1.7(14) | 1.7(14) |
| HCN | 2.0(17) | 2.0(17) | 2.0(17) | 2.0(17) | 2.0(17) |
| CN | 2.7(14) | 2.7(14) | 2.7(14) | 2.7(14) | 2.7(14) |
| CS | 4.5(12) | 4.5(12) | 4.5(12) | 4.5(12) | 4.5(12) |
| C2H | 4.1(14) | 4.1(14) | 4.1(14) | 4.1(14) | 4.1(14) |
| H2CO | 1.3(12) | 1.3(12) | 1.3(12) | 1.3(12) | 1.3(12) |
| N2H+ | 5.5(10) | 5.5(10) | 5.3(10) | 5.2(10) | 5.3(10) |
| OH | 1.7(16) | 1.7(16) | 1.7(16) | 1.7(16) | 1.7(16) |
| H2O | 1.7(21) | 1.7(21) | 1.7(21) | 1.6(21) | 1.7(21) |
| CO2 | 4.6(20) | 4.6(20) | 4.6(20) | 4.6(20) | 4.6(20) |
| C2H2 | 1.8(15) | 1.8(15) | 1.8(15) | 1.8(15) | 1.7(15) |
| CH3OH | 2.6(14) | 2.6(14) | 2.6(14) | 2.6(14) | 2.6(14) |
| 10 AU | |||||
| H2 | 2.6(24) | 2.6(24) | 2.6(24) | 2.6(24) | 2.6(24) |
| CO | 3.6(20) | 3.6(20) | 3.6(20) | 3.8(20) | 3.2(20) |
| HCO+ | 4.9(13) | 4.9(13) | 5.4(13) | 3.5(13) | 4.4(13) |
| HCN | 2.7(11) | 2.7(11) | 7.1(14) | 8.0(14) | 7.0(14) |
| CN | 1.6(13) | 1.6(13) | 3.9(14) | 3.9(14) | 2.1(14) |
| CS | 2.0(12) | 1.5(12) | 1.0(14) | 2.5(14) | 3.4(13) |
| C2H | 3.6(13) | 3.6(13) | 2.1(14) | 2.1(14) | 1.4(14) |
| H2CO | 3.1(11) | 3.0(11) | 1.4(12) | 1.4(12) | 1.4(12) |
| N2H+ | 1.4(09) | 1.4(09) | 1.4(10) | 1.4(10) | 1.6(10) |
| OH | 8.7(15) | 8.7(15) | 8.8(15) | 8.8(15) | 8.8(15) |
| H2O | 2.6(15) | 2.6(15) | 4.3(15) | 2.0(16) | 4.3(15) |
| CO2 | 4.4(16) | 4.4(16) | 4.9(16) | 1.3(18) | 4.0(16) |
| C2H2 | 1.1(14) | 1.1(14) | 8.7(13) | 2.8(13) | 1.5(14) |
| CH3OH | 2.1(07) | 2.1(07) | 7.7(07) | 1.6(08) | 8.5(07) |
| 100 AU | |||||
| H2 | 2.0(23) | 2.0(23) | 2.0(23) | 2.0(23) | 2.0(23) |
| CO | 2.2(19) | 2.2(19) | 2.3(19) | 2.8(19) | 2.2(19) |
| HCO+ | 2.2(14) | 2.2(14) | 2.2(14) | 8.3(13) | 4.9(13) |
| HCN | 1.6(12) | 1.6(12) | 2.1(14) | 3.7(14) | 2.3(13) |
| CN | 1.2(13) | 1.2(13) | 2.6(14) | 2.6(14) | 2.4(14) |
| CS | 7.0(09) | 7.0(09) | 3.2(13) | 9.7(13) | 1.7(13) |
| C2H | 1.1(13) | 1.1(13) | 1.2(14) | 1.2(14) | 1.1(14) |
| H2CO | 7.3(11) | 7.2(11) | 1.9(12) | 1.9(12) | 1.7(12) |
| N2H+ | 5.0(10) | 5.2(10) | 3.7(10) | 3.1(10) | 7.0(10) |
| OH | 4.4(14) | 4.4(14) | 2.2(14) | 2.2(14) | 2.8(14) |
| H2O | 1.2(14) | 1.2(14) | 1.1(15) | 2.6(15) | 7.3(14) |
| CO2 | 3.8(12) | 3.8(12) | 3.4(15) | 1.2(16) | 7.7(14) |
| C2H2 | 2.8(12) | 2.8(12) | 1.9(13) | 2.0(13) | 1.6(13) |
| CH3OH | 5.6(06) | 5.6(06) | 7.5(07) | 1.5(08) | 4.8(08) |
| 305 AU | |||||
| H2 | 5.7(22) | 5.7(22) | 5.7(22) | 5.7(22) | 5.7(22) |
| CO | 5.2(17) | 5.2(17) | 1.2(18) | 1.8(18) | 1.1(18) |
| HCO+ | 3.2(13) | 3.2(13) | 1.2(13) | 2.6(13) | 3.6(13) |
| HCN | 2.8(13) | 2.8(13) | 9.1(13) | 1.8(14) | 7.4(12) |
| CN | 9.9(13) | 9.9(13) | 1.6(14) | 1.7(14) | 1.6(14) |
| CS | 2.0(10) | 2.0(10) | 3.1(12) | 4.3(13) | 8.3(11) |
| C2H | 3.1(13) | 3.1(13) | 8.0(13) | 8.0(13) | 7.2(13) |
| H2CO | 6.3(12) | 6.3(12) | 2.1(12) | 2.5(12) | 2.4(12) |
| N2H+ | 2.5(12) | 5.1(12) | 5.0(12) | 3.7(12) | 1.2(13) |
| OH | 7.9(14) | 8.0(14) | 8.0(13) | 1.7(14) | 2.0(14) |
| H2O | 1.4(15) | 1.4(15) | 7.8(14) | 1.4(15) | 1.2(15) |
| CO2 | 9.4(13) | 9.5(13) | 1.9(15) | 3.4(15) | 7.9(14) |
| C2H2 | 1.3(13) | 1.3(13) | 1.3(13) | 3.1(13) | 2.3(13) |
| CH3OH | 1.6(08) | 1.6(08) | 5.6(07) | 7.7(08) | 1.6(11) |
Note. — means
3.6. Comparison with Other Models
A direct comparison with other chemical models of protoplanetary disks is difficult as no two models are identical in either their physical basis or their chemical networks. Given the plethora of preceding work in this field, we limit this short discussion to more recent models which are comparable to ours in chemical complexity.
The work presented here builds upon previous investigations into the importance of cosmic-ray induced desorption and photodesorption in disks by Willacy & Langer (2000) and Willacy (2007), the latter of which uses the model of D’Alessio et al. (2001) for their physical framework. We obtain encouragingly similar results to Willacy (2007) in particular, although, her primary objective was the investigation into deuterated species in disks. As such, the reaction network of the non-deuterated species was truncated to accommodate the additional reactions involving deuterium and deuterium-containing molecules. Our work also differs in that our physical model includes X-ray heating and also explicitly determines the gas temperature which can decouple from the dust-grain temperature in regions where cooling via gas-grain collisions is inefficient. Willacy & Woods (2009) also use their deuterated reaction network and adapt their model to investigate the chemical structure of a disk within 30 AU of the central star. Again, we achieve similar results although differences in the set of molecular desorption energies used manifests as differences in the positions of ‘snow lines’ for molecules such as HCN. Also differing prescriptions for the UV radiation field in the disk leads to different distributions of radicals such as C2H and CN.
Photodesorption and cosmic-ray induced desorption are now routinely included in modern chemical models of protoplanetary disks (e.g. Woitke et al. (2009); Henning et al. (2010)). X-ray desorption and grain-surface chemistry have both been included in work by by other groups (e.g. Semenov et al. (2008); Henning et al. (2010)) although not explicitly investigated given the theoretical uncertainty behind the exact mechanism of X-ray desorption for the former process and the usual truncation of chemical networks for the latter. Our work presented here and subsequent follow-up publications on X-ray desorption and grain-surface chemistry, we hope, will go some way to addressing this.
4. SUMMARY
In this work, we have presented a selection of results from our high-resolution combined chemical and physical model of a protoplanetary disk surrounding a typical T Tauri star, constructed in order to trace the physical and thus chemical structure on small scales. We use a protoplanetary disk model in which the gas density and temperature distributions are obtained self-consistently and UV and X-ray irradiation by the central star is calculated by solving the radiative transfer equation. To this we applied a large comprehensive chemical network including gas-phase chemistry, gas-grain interactions and grain-surface chemistry. We investigated the effects of each non-thermal desorption mechanism thought to be important in disks: cosmic-ray induced desorption, photodesorption and X-ray desorption. We also added a large grain-surface network to investigate the effectiveness of grain-surface reactions on the synthesis of relatively complex organic molecules.
Using the results from model PH+CRH (see Table 2) extracted at a time of years, we find that the disk chemical structure closely mirrors the disk physical structure with the freeze out of molecules onto dust grains creating an icy mantle in the cold, dense midplane and an abundance of molecules in a layer above the midplane created through sublimation and the resulting rich gas-phase chemistry. In the disk surface, the molecular abundances drop as the UV and X-ray radiation fields peak in strength dissociating molecules and ionising both molecules and atoms. The resulting disk ionisation fraction increases with increasing disk height. There is similar stratification in the radial direction as the increasing temperature drives the evaporation of molecules. The temperature dependence of the desorption energies results in a unique ‘snow-line’ for each molecules with more volatile molecules returned to the gas in the midplane at larger radii than less volatile ones. In particular, both HCN and H2O remain frozen onto dust grains to within 1 to 2 AU of the central star.
The addition of cosmic-ray induced desorption has only a small effect on the gas-phase abundances in the outer disk midplane although since our model is truncated at 305 AU we would expect that this effect will continue at radii beyond this value. Photodesorption, the most experimentally constrained of the mechanisms considered here, has a larger effect although only in the molecular and surface regions of the disk where there is an appreciable UV flux. It is especially effective at enhancing the gas-phase abundances of non-volatile molecules such as H2O. X-ray desorption, has the largest effect, smoothing the abundances of gas-phase species throughout the height of the disk and acting to homogenise the fractional abundances. However, X-ray desorption is the least theoretically or experimentally constrained and thus our results must be treated with caution, pending further investigation.
The addition of grain-surface chemistry also yields some encouraging results worthy of revisiting and further study. In the outer disk, where the freeze out of molecules is most prevalent, the abundances of relatively complex organic molecules e.g. CH3OH, HCOOCH3 and CH3OCH3 are enhanced to potentially observable values when grain-surface chemistry and photodesorption are included in our model. Thus, the observation of rotational transitions of these, and related, species in protoplanetary disks should provide an excellent means of testing grain-surface chemistry theory. Due to limitations in existing facilities, the most complex molecule observed, as yet, in disks is H2CO. ALMA, however, will have the sensitivity and spectral resolution necessary to observe rotational transitions in these minor species. Indeed, preliminary synthetic spectra we have calculated suggest that the rotational transition lines of methanol are enhanced above the detection threshold of ALMA when grain-surface chemistry is included in our model (Walsh et al., in preparation).
We have shown that running models of this nature, in which we test experimental data and theory, varying the different chemical ingredients, are necessary for disentangling the different physical influences on the chemical content of protoplanetary disks. The influence of the physical conditions and processes on the molecular content is also a strong function of radius and so high-resolution models, which trace the chemical structure on small scales, are also preferred. In this brief overview of our model, we have shown that X-ray desorption and grain-surface chemistry can have a powerful effect on the molecular content of disks and we intend to expand upon the work presented here with follow-up papers on both chemical processes. Although in this paper we have shown that the distribution and radial column densities of particular molecules are sensitive to the inclusion or omission of certain chemical processes, in order to test the viability of using these molecules as tracers we must compute the radiative transfer in the disk and directly compare our results with observations. This work will be reported in a subsequent paper (Walsh et al., in preparation).
References
- Aikawa et al. (2003) Aikawa, Y., Momose, M., Thi, W.-F., van Zadelhoff, G.-J., Qi, C., Blake, G. A., & van Dishoek, E. F. 2003 PASJ, 55, 11
- Balbus & Hawley (1991) Balbus S. A., & Hawley, J. F. 1991, ApJ, 376, 214
- Bottinelli et al. (2010) Bottinelli, S., F. et al. 2010, ApJ, 718, 1100
- Brown & Bolina (2007) Brown, W. A., & Amndeep, S. 2007, MNRAS, 374, 1006
- Carr et al. (2004) Carr, J. S., Tokunaga, A. T., & Najita, J. 2004, ApJ, 603, 213
- Carr & Najita (2008) Carr, J. S, & Najita, J. 2008, Science, 319, 1504
- Ceccarelli et al. (2004) Ceccarelli, C., Dominik, C., Lefloch, B., Caselli, P., & Caux, E. 2004 ApJ, 607, L51
- Ceccarelli et al. (2005) Ceccarelli, C., Dominik, C., Caux, E., Lefloch, B., & Caselli, P. 2005, ApJ, 631, L81
- D’Alessio et al. (2001) D’Alessio, P., Calvet, N., & Hartmann, L. 2001, ApJ, 553, 321
- Dutrey et al. (1994) Dutrey, A., Guilloteau, S., & Simon, M. 1994, A&A, 286, 149
- Dutrey et al. (1997) Dutrey, A., Guilloteau, S, & Guélin, 1997, A&A, 317, L55
- Dutrey et al. (2007) Dutrey, A. et al. 2007, A&A, 464, 615
- Dwek & Smith (1996) Dwek, E., & Smith, R. K. 1996, ApJ, 459, 686
- Gammie (1996) Gammie, C. F. 1996, ApJ, 457, 355
- Gibb et al. (2007) Gibb, E. L., van Brunt, K. A., Brittain, S. D., & Rettig, T. W. 2007, ApJ, 660, 1572
- Glassgold et al. (2009) Glassgold, E. A., Meijerink, R., & Najita, J. R. 2009, ApJ, 701, 142
- Graedel et al. (1982) Graedel, T. E., Langer, W. D., & Ferking, M. A. 1982,ApJS, 48, 321
- Guilloteau & Dutrey (1994) Guilloteau, S,, & Dutrey, A. 1994, A&A, 291, L23
- Guilloteau et al. (2006) Guilloteau, S., Piétu, V., Dutrey, A., & Guélin, M. 2006, A&A, 448, L5
- Hasegawa et al. (1992) Hasegawa, T. I., Herbst, E., & Leung, C. M. 1992, ApJS, 82, 167
- Hasegawa & Herbst (1993) Hasegawa, T. I., & Herbst, E. 1993, MNRAS, 261, 83
- Hawley & Balbus (1991) Hawley, J. F., & Balbus, S. A. 1991, ApJ, 376, 223
- Henning et al. (2010) Henning, T. et al. 2010, ApJ, 714, 1151
- Herbst & van Dishoeck (2009) Herbst, E., & van Dishoeck E. F. 2009, ARA&A, 47, 427
- Ilgner & Nelson (2006) Ilgner, M., & Nelson, R. P. 2006, A&A, 445, 205
- Johns-Krull et al. (2000) Johns-Krull, C. M., Valenti, J. A., & Linsky, J. L. 2000, ApJ, 539, 815
- Kastner et al. (1997) Kastner, J. H., Zuckerman, B., Weintraub, D. A., & Forveille, T. 1997, Science, 277, 67
- Kastner et al. (2002) Kastner, J. H., Huenemoerder, D. P., Schultz, N. S., Canizares, C. R., & Weintraub, D. A. 2002, ApJ, 567, 434
- Kenyon & Hartmann (1995) Kenyon, S. J., & Hartmann, L. 1995, ApJS, 101, 117
- Lahuis et al. (2006) Lahuis, F. et al. 2006, ApJ, 636, L145
- Léger et al. (1985) Léger, A., Jura, M. $ Omont, A. 1985, A&A, 144, 147
- Liedahl et al. (1995) Liedahl, D. A., Osterheld, A. L., & Goldstein, W. H. 1995, ApJ, 438, L115
- Lynden-Bell & Pringle (1974) Lynden-Bell, D., & Pringle, J. E. 1974, MNRAS, 168, 603
- Markwick et al. (2002) Markwick, A. J., Ilgner, M., Millar, T. J., & Henning, Th. 2002, A&A, 385, 632
- Najita et al. (2001) Najita, J., Bergin, E. A., & Ullom, J. N. 2001, ApJ, 561, 880
- Nomura & Millar (2005) Nomura, H., & Millar, T. J. 2005, A&A, 438, 923
- Nomura et al. (2007) Nomura, H., Aikawa, Y., Tsujimoto, M., Nakagawa, Y. $ Millar, T. J. 2007, ApJ, 661, 334
- Öberg et al. (2007) Öberg, K. I., Fuchs, G. W., Awad, Z., Fraser, H. J., Schlemmer, S., van Dishoeck, E. F., & Linnartz, H. 2007, ApJ, 662, L23
- Öberg et al. (2009a) Öberg, K. I., Linnartz, H., Visser, R., & van Dishoeck, E. F. 2009, ApJ, 693, 1209
- Öberg et al. (2009b) Öberg, K. I., van Dishoeck, E. F., & Linnartz, H. 2009, A&A, 496, 281
- Pascucci et al. (2009) Pascucci, I., Apai, D., Luhmann, K., Henning, Th., Bouwman, J., Meyer, M. R., Lahuis, F., & Natta, A. 2009, ApJ, 696, 143
- Piétu et al. (2007) Piétu, V., Dutrey, A., & Guilloteau, S. 2007, A&A, 467, 163
- Pringle (1981) Pringle, J. E. 1981, ARA&A, 19, 137
- Qi et al. (2003) Qi, C., Kessler, J. E., Koerner, D. W., Sargent, A. I., & Blake, G. A. 2003, ApJ, 597, 986
- Qi et al. (2004) Qi, C. et al. 2004, ApJ, 616, L11
- Qi et al. (2006) Qi, C., Wilner, D. J., Calvet, N., Bourke, T. L., Blake, G. A., Hogerheije, M., Ho, P. T. P., & Bergin, E. 2006, ApJ, 636, L157
- Qi et al. (2008) Qi, C., Wilner, D. J., Aikawa, Y., Blake, G. A., & Hogerheije, M. R. 2008, ApJ, 681, 1396
- Salyk et al. (2008) Salyk, C., Pontoppidan, K. M., Blake, G. A., Lahuis, F., van Dishoeck, E. F., & Evans, N. J., II 2008, ApJ, 676, L49
- Sandford & Allamondola (1988) Sandford, S. A., & Allamondola, L. J. 1988, Icarus, 76, 201
- Sandford & Allamondola (1990) Sandford, S. A., & Allamondola, L. J. 1990, Icarus, 87, 188
- Sandford & Allamondola (1993) Sandford, S. A., & Allamondola, L. J. 1993, ApJ, 417, 815
- Semenov et al. (2008) Semenov, D., Pavlyuchenkov, Ya., Wolf, S., & Launhardt, R. 2008, ApJ, 673, L195
- Shakura & Sunyaev (1973) Shakura, N. I., & Sunyaev, R. A. 1973, A&A, 24, 337
- Shu et al. (1987) Shu, F. H., Adams, F. C., & Linzano, S. 1987, ARA&A, 25, 23
- Thi et al. (2004) Thi, W.-F., van Zadelhoff, G.-J., & van Dishoeck, E. F. 2004, A&A, 425, 955
- Valenti et al. (2000) Valenti, J. A., Johns-Krull, C. M., & Linsky, J. L. 2000, ApJS, 129, 399
- van Dishoeck et al. (2003) van Dishoeck, E. F., Thi, W.-F., & van Zadelhoff, G.-J 2003, A&A, 397, 789
- van Zadelhoff et al. (2001) van Zadelhoff, G.-J., van Dishoeck, E. F., Thi, W.-F., & Blake, G. A 2001, A&A, 377, 566
- Weingartner & Draine (2001) Weingartner, J. C., & Draine, B. T. 2001, ApJ, 548, 296
- Westley et al. (1995) Westley, M. S., Baragiola, R. A., Johnson, R. E., & Baratta, G. A. 1995, Planet. Space Sci., 43, 1311
- Willacy et al. (1998) Willacy, K., Klahr, H. H., Millar, T. J., & Henning, Th. 1998 A&A, 338, 995
- Willacy & Langer (2000) Willacy, K., & Langer, W. D. 2000, ApJ, 544, 903
- Willacy (2007) Willacy, K. 2007, ApJ, 660, 441
- Willacy & Woods (2009) Willacy, K., & Woods, P. M. 2009, ApJ, 703, 479
- Woitke et al. (2009) Woitke, P., Kamp, I, & Thi, W.-F. 2009, A&A, 501, 383
- Woodall et al. (2007) Woodall, J., Agúndez, M., Marckwick-Kemper, A. J., & Millar, T. J. 2007, A&A, 446, 1197
- Yamamoto et al. (1983) Yamamoto, T., Nakagawa, N., & Fukui, Y. 1983, A&A, 122, 171
![[Uncaptioned image]](/html/1008.4305/assets/x84.png)
![[Uncaptioned image]](/html/1008.4305/assets/x85.png)
![[Uncaptioned image]](/html/1008.4305/assets/x86.png)
![[Uncaptioned image]](/html/1008.4305/assets/x87.png)
![[Uncaptioned image]](/html/1008.4305/assets/x88.png)
![[Uncaptioned image]](/html/1008.4305/assets/x89.png)
![[Uncaptioned image]](/html/1008.4305/assets/x90.png)
![[Uncaptioned image]](/html/1008.4305/assets/x91.png)
Radial column densities of various gas-phase molecules up to maximum radii of 10 AU (left) and 305 AU (right) for each chemical model. Grain-surface (ice) column densities are represented by dotted lines. Note that results from models 0 and CRH (red and green lines, respectively) are very similar hence for many molecules these lines are virtually indistiguishable. Note also for CO2, in particular, the results from models 0, CRH and PH+CRH within 10 AU are almost identical. Figure available online only.
![[Uncaptioned image]](/html/1008.4305/assets/x92.png)
![[Uncaptioned image]](/html/1008.4305/assets/x93.png)
![[Uncaptioned image]](/html/1008.4305/assets/x94.png)
![[Uncaptioned image]](/html/1008.4305/assets/x95.png)
![[Uncaptioned image]](/html/1008.4305/assets/x96.png)
![[Uncaptioned image]](/html/1008.4305/assets/x97.png)
![[Uncaptioned image]](/html/1008.4305/assets/x98.png)
![[Uncaptioned image]](/html/1008.4305/assets/x99.png)
(Continued.)
Appendix A Disk Physical Structure
A.1. Density
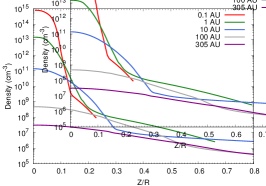
The number density (cm-3), as a function of disk radius and height, is displayed in the top left and right panels of Figure 1 (within a radius of 10 AU and 305 AU, respectively) and, as a function of (i.e. disk height scaled by radius) at a range of radii, in the top left panel of Figure 13. The density decreases as a function of increasing disk radius and height with the densest region of the disk found in the disk midplane close to the star ( 1015 cm-3) and the most diffuse, in the disk surface at large radii ( 105 cm-3) so that the density range in our model covers almost 10 orders of magnitude. The density gradient in the vertical direction becomes more extreme with decreasing radius. At a radius of 0.1 AU, the density ranges from 108 cm-3 in the disk surface to 1015 cm-3 in the midplane, a change of seven orders of magnitude over a distance of 0.03 AU. In contrast, at a radius of 305 AU, the density varies by around a factor of 100 between the midplane and the surface, over a distance of 250 AU.
A.2. Gas and Dust Temperature
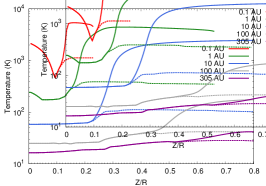
Corresponding graphs for the gas temperature are shown in the bottom left and right panels of Figure 1 and the bottom left panel of Figure 13. The gas temperature increases as a function of increasing height and decreasing radius with the hottest region found in the disk surface close to the star ( 104 K), and the coldest found in the disk midplane in the outer disk ( 10 K). Within several AU of the star, the temperature increases near the disk midplane due to the influence of viscous heating. In the disk surface, the gas and dust temperatures decouple with the dust temperature the lower of the two values (represented by dotted lines in Figure 13). At low densities, gas-grain collisions become ineffective so the gas cools via radiative line transitions. At a radius of 10 AU, the difference in the gas and dust temperatures in the disk surface is more than an order of magnitude at 2000 K and 100 K, respectively. The vertical temperature gradients in the disk, although large, are not as extreme as those of the density.
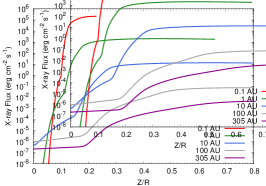
A.3. UV and X-ray Radiation Fields
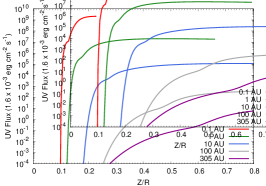
The middle panels of Figure 13 show the UV and X-ray fluxes (top and bottom, respectively) as functions of at a range of radii. The UV flux is given in units of the average interstellar radiation field (ISRF) (1.6 10-3 erg cm-2 s-1). The extinction coefficient in the disk is very large for UV radiation thus the UV flux has an incredibly steep gradient in the vertical direction with the flux in midplane at all radii 0. In the disk surface, the UV radiation field decreases in strength with distance from the star. At a radius of 0.1 AU, the UV flux has a value 109 times that of the ISRF whereas at 305 AU, this has decreased to 10 times the interstellar value.
The X-ray flux shows a similar behaviour, however, X-ray photons, with energies keV, are more energetic than UV photons and so have greater penetrative power. Hence, the X-ray flux has a less steep gradient in the vertical direction than the UV flux. In the outermost regions of the disk, 10 AU, the X-ray flux is attenuated from a value 0.1 to 10 erg cm-2 s-1 in the disk surface to 10-7 to 10-6 erg cm-2 s-1 in the disk midplane so that there remains a small, yet significant, X-ray flux where the UV flux is essentially zero.
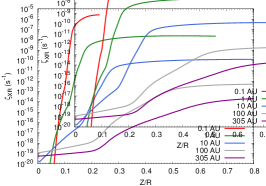
A.4. Cosmic-ray and X-ray Ionisation Rates
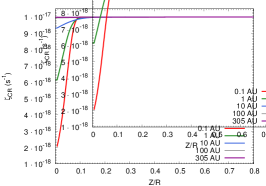
Finally, the cosmic-ray and X-ray ionisation rates are displayed in Figure 13 (top and bottom right panels, respectively) as functions of at a range of radii. Note the linear scale used for the cosmic-ray ionisation rate. Beyond 10 AU, the cosmic-ray ionisation rate is constant (at the interstellar value of 10-17 s-1) throughout the height of the disk as cosmic-ray particles, with energies MeV, are highly penetrative. In the inner disk, e.g. = 1 AU, the column density of material through to the disk midplane is large enough for some attenuation of cosmic-rays, however, the midplane ionisation rate at this radius in our model is still relatively high at 60 % of the interstellar value. At even smaller radii, 0.1 AU, the midplane cosmic-ray ionisation rate is further reduced to 20 % the rate in the disk surface.
The X-ray ionisation rate, unsurprisingly, mirrors the X-ray flux. In the outer disk, 10 AU, the X-ray flux is significant enough to result in an X-ray ionisation rate 10-20 to 10-19 s-1 in the midplane, however, here, cosmic-ray ionisation ( 10-17 s-1) dominates. The X-ray ionisation rate is significantly higher than the cosmic-ray ionisation rate in the middle to surface layers of the disk, with values ranging from 10-13 s-1 at the maximum radius of our disk model to 10-6 s-1 at the minimum.