Production of and hyperons in proton-proton collisions
Abstract
This paper reports results on simultaneous measurements of the reaction channels and at excess energies of 204, 239, and 284 MeV () and 127, 162, and 207 MeV (). Total and differential cross sections are given for both reactions. It is concluded from the measured total cross sections that the high energy limit of the cross section ratio is almost reached at an excess energy of only about 200 MeV. From the differential distributions observed in the overall CMS as well as in the Jackson and helicity frames, a significant contribution of interfering nucleon resonances to the production mechanism is concluded while resonant -production seems to be of lesser importance and takes place only through specific partial waves of the entrance channel. The data also indicate that kaon exchange plays a minor role in the case of - but an important role for -production. Thus the peculiar energy dependence of the / cross section ratio appears in a new light as its explanation requires more than mere differences between the p and the p final state interaction. The data provide a benchmark for theoretical models already available or yet to come.
pacs:
13.75.Cs Nucleon-nucleon interactions and 13.75.-n Hadron-induced low- and intermediate-energy reactions and scattering (energy 10 GeV) and 13.75.Ev Hyperon-nucleon interactions and 25.40.Ve Other reactions above meson production thresholds (energies 400 MeV)1 Introduction
The physics program carried out at the COoler SYnchrotron COSY (Forschungszentrum Jülich, Germany) focuses on the study of mesons and baryons in the confinement regime of QCD. Associated strangeness production plays a major role within this general field and has been studied by various experimental groups at COSY. In the case of proton-proton induced and hyperon production this effort has led to very well measured excitation functions starting at excess energies () only a few MeV above the thresholds and extending to in the case of and in the case of production grzonka97 ; balewski97 ; balewski98 ; sewerin99 ; COSY11kowina04 ; toflambda06 ; valdau07 .
One surprising result of these investigations is that the excitation function of exhibits within uncertainty a pure phase space behavior () whereas the final state is produced with larger abundance towards the production threshold. This leads to a peculiar energy dependence of the production cross section ratio . A few MeV above the threshold a high value of has been found balewski98 ; sewerin99 . With increasing excess energy drops steadily to a value of at COSY11kowina04 . Then, up to = 700 MeV the energy dependence of cannot be determined in a model independent manner, as the few existing data points were taken at different excess energies. However, above 700 MeV the data collected in baldini88 show to stay essentially constant at a value of only . The low and the high energy limits, respectively, are both close to “magic values”, as a ratio of 27 is the SU(6) prediction of the ratio of the squares of the coupling constants of the virtual exchange-kaon () deswat63 and the ratio of three follows from isospin considerations. It has been argued, however, that these theoretical explanations are oversimplifications sibi06 ; shyam06 ; perhaps one observes only a fortuitous coincidence.
The dramatic change of the to cross section ratio with excess energy could be due to different production processes, or distinctively different final state interactions (FSI), or both. However, the reaction mechanisms are far from being established as various theoretical approaches have been developed in the last years which all reproduce the experimental data with about the same amount of success. These models are based on very different footings: a coherent interplay of FSI and nucleon resonances was concluded for production sibi06 ; the production via established nucleon resonances was studied shyam06 ; a contribution of an N(1535) resonance without any proton-hyperon FSI was suggested luizou06 ; destructive interferences between and K exchange contributions were considered gaspa00 ; and a constituent quark-gluon model with the inclusion of nucleon resonances was proposed dillig06 . Finally, a model based on kaon and pion exchange developed for SATURNE saturneandfriends1 ; saturneandfriends2 data () long before the COSY era also reproduces the energy dependence of fairly well, as without any adjustment of the parameters the ratio is only underestimated by 50% directly at threshold laget01Nlaget91 . Hence, the energy dependence of the total cross sections alone is not at all sufficient to discriminate between these different theoretical approaches. Differential observables for both reaction channels are highly desired in order to set benchmarks for theoretical models.

This large variety of theoretical approaches to describe hyperon () production in proton-proton collisions can be ordered into two classes of production scenarios depicted in fig. 1. On the one hand, kaon (and ) exchange manifests strangeness in the production mechanism itself. In this case resonances could be involved in principle, however, none is known in the Kp-system at present. On the other hand, (and , , , ) exchange shifts the strangeness production away from the interaction of both protons to the p vertex. Since the subprocess p is likely to involve an intermediate resonance (p), this scenario suggests the role of resonances to be of importance for proton-proton induced hyperon production.
Numerous studies of nucleon and resonances excited in and reactions revealed among other resonances those which decay into particles with open strangeness such as the associated pairs or capstickNroberts98 ; bradford06 ; sumihama06 ; hicks07 ; mart06 ; tram98 . According to these findings and other experimental as well as theoretical work, the particle data group pdg06 lists the resonances , , , , , , and and values for the branching ratios. Strong evidence was advanced for additional states, namely and sarantsev05 . The latter may be the same as McNabb04 ; glander03 or pennerNmosel02 . The properties of all these resonances (mass, width, branching ratios to K or K) are typically not known well and the role these nucleon resonances play for associated strangeness production in proton-proton collisions is not well understood. It should be mentioned that the concept of resonant hyperon production limits the final state to be produced only from resonances (due to isospin conservation) whereas the pair can be reached via both and resonances. In the latter case, , , , , and can also be involved. The -resonances increases the number of possible contributions to the production process and renders a theoretical description even more difficult than that of the channel. Turning the argument around the isospin-selective channel could potentially serve as a tool to find so-called missing resonances (with I=1/2) capstickNroberts2000 , i.e. resonant states predicted by quark-models which have not been found experimentally so far.
The COSY-TOF collaboration has recently published data on total cross sections for the channel at moderate excess energies of 85, 115, and 171 MeV, and the first differential data, namely Dalitz plots and helicity angle distributions at =171 MeV toflambda06 . In addition, invariant mass spectra are shown. The results can be described by a reaction model which includes in a coherent manner the , , and nucleon resonances in conjunction with a considerable contribution of final-state-interaction. With increasing energy the relative contribution of the then diminishes in trade for a stronger influence of the and as shown in eyrich07 ; schoeder07 .
The only known experimental fact in the case of the reaction is the proportionality of the total cross section to the phase space volume (). This can be taken as a indication for the reaction mechanism to be independent of the excess energy and the absence of a strong -FSI which would manifest itself close to threshold. However, it is of course possible that competing processes cancel in a way that they mimic the behavior. As experimental results on differential observables are completely lacking for production in pp-collisions any detailed theoretical approach is currently hampered strongly.
In this paper differential distributions for both reactions are presented, namely the angular distributions of all final state particles in the overall CMS, as well as distributions in both the Jackson and helicity frames of all two-body subsystems. Like Dalitz plots, the helicity angle distributions provide insight into the three-body final state. They are especially well suited to investigate the influence of intermediate resonances. The information contained in the Jackson angle distributions are complementary to that of a Dalitz plot, as this angular distribution relates the exit to the entrance channel and hints at relative angular momenta and/or resonances present in a specific two-body subsystem.
The data were taken at beam momenta of , and . These beam momenta correspond to excess energies of 204, 239, and 284 MeV in the case of () while the neutral is produced 127, 162, and 207 MeV above threshold (). The data taken at stand out since they have a large integrated luminosity; in this case the calibration, the acceptance111The term “acceptance” is used for the convolution of solid angle coverage, detector-, and reconstruction-efficiency. correction as well as the overall luminosity were cross-checked by three independent subgroups of our collaboration when a supposed pentaquark state was searched for tofthetaplusdead . The measurements at 2950 MeV/c and 3200 MeV/c were carried out directly one after the other without any change of detector set-up, DAQ, high voltage or electronics. Hence, the results of these two data sets are ideal for relative comparisons as systematic uncertainties partly cancel.
2 Experimental procedure
2.1 Detector setup
The experiments were carried out with the time-of-flight detector COSY-TOF located at an external beam line of the COoler SYnchrotron COSY (Forschungszentrum Jülich). The COSY machine provides proton beams of very high quality (spill length 5 min; several protons/s; low emittance of ; relative momentum uncertainty ).
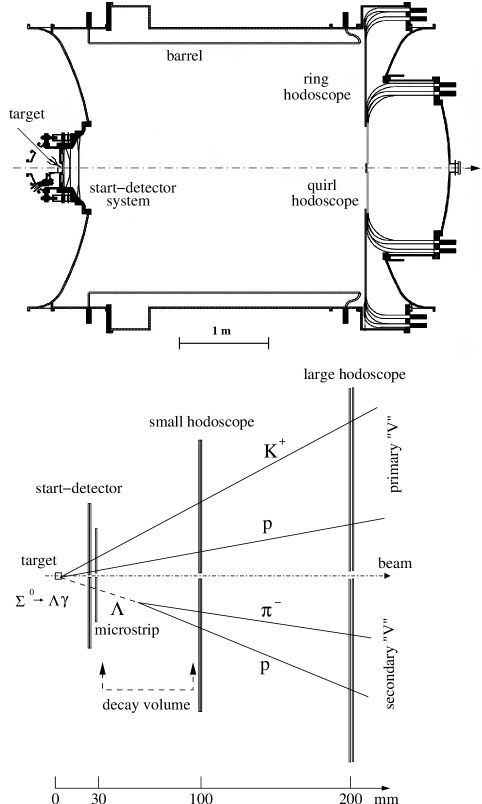
The layout of the COSY-TOF detector is shown in the upper part of fig. 2; in the lower part the near target region with the time-of-flight start and tracking detectors tofbeschreibung ; Erlangenstart is sketched. The interaction volume is small and well defined as the narrow beam with Gaussian profile () is directed onto a liquid hydrogen target of only 4 mm length target . The emerging particles traverse just behind the target ( mm) a 24-fold segmented scintillation detector (“start-detector”) which provides the start signal for the time-of-flight measurement. At a distance of 30 mm downstream of the target a double-sided silicon-microstrip detector is installed, followed by two double-layered scintillating fiber hodoscopes at 100 and 200 mm. These three tracking detectors measure the coordinates of traversing charged particles in three dimensions with a spatial resolution of (microstrip) and mm (hodoscopes).
After a flight path of 3 m through the evacuated vessel (0.2 Pa) all charged particles are detected in the highly segmented stop components. They consist of two triple-layered forward hodoscopes (central and ring hodoscope) forewardhodo and a barrel hodoscope barrel , all manufactured from BC412 scintillating material. From the combined measurement of time and position the velocity vectors of all charged particles are determined with a time-of-flight resolution of better than = 300 ps and an angular track-resolution of better than . Primary vertices (located within the target) are reconstructed with an accuracy of better than and . Secondary vertices from particles decaying behind the microstrip detector and before the first hodoscope are reconstructed with an accuracy of and .
The COSY-TOF detector stands out for its low mass area density of target, start-detector, and tracking detectors. This renders the influence of small angle scattering and energy loss almost negligible. In addition, the COSY-TOF detector has a high efficiency of for the detection of charged particles and covers a large solid angle () in the laboratory frame. These features allow the almost unambiguous and simultaneous identification of different reaction channels (e.g., , , , , , ) by examining the measured time-of-flight of the charged particles and their event topology.
2.2 Principle of measurement and data analysis
The strategies presented in this paper for the analysis of neutral hyperon production are a straightforward extension of the special routines developed by the Dresden group for the analysis of the reaction channel (analysis A in tofthetaplusdead ) within our standard analysis framework MSWdiss ; WU07 ; mswpaper06 ; wupaper09 . This approach is an alternative one to that applied in toflambda06 ; Erlangenstart .
Here, the focus lies on an extensive use of the time-of-flight information in order to independently determine, on the one hand, the primary particles () and, on the other hand, the secondary particles stemming from the hyperon’s decay into and . While the secondary particles are used as a “positive tag” for a events, the four-momenta of primary protons and kaons are utilized to calculate the missing mass spectrum which shows both hyperons well resolved. This missing mass spectrum is then the backbone of the analysis.
The simultaneous analysis of the reactions and is possible due to the decay properties of the hyperons involved. A () decays with a branching ratio of in the direct vicinity of its production vertex () to . The photon remains undetected, however, its energy is small compared to the mass of the () and thus the change of direction of the with respect to that of the is less than in the laboratory system. This minor change of direction justifies to analyze both reactions on equal footing.
During data taking both final states are preselected via the same trigger based on the multiplicity-jump of charged particles (see fig. 2, lower part): near the target (start-detector) only two charged particles are found (p, K+) whereas, due to the sizable decay length of the hyperon () and its decay into two charged particles (), four hits are detected in the stop components. This requirement is also modeled as the first step in the off-line analysis.
Both primary () and secondary () particles emerge from a vertex and form a -shaped pattern in the detector. These patterns are searched for by a fitting procedure, where each layer of the tracking detectors, which has produced a signal, provides an individual track point. In order to identify these two different sets of shaped patterns the following self-evident conditions are exploited: a primary is characterized by two hits in the stop components in coincidence with two hits in the start-detector together with any number of track points in the microstrip and hodoscopes; the vertex must be located inside the target within resolution. A secondary has two hits in the stop components; at least three track points in each arm; a decay plane intersecting the target volume; and a decay vertex located in the volume between the microstrip detector and the first hodoscope (decay volume). All permutations of hits in the stop components are taken into account resulting first in a set of primary and then in secondary -candidates. The best s are chosen according to the number of track points and the quality of the fit. This method was developed by means of Monte Carlo data.
So far only geometric information has been exploited in order to independently determine one primary and one secondary . Using the measured time-of-flight () for the particles of each arm of the primary s leads to corresponding primary velocity vectors. An averaged start-detector value is used for the time-of-flight determination of secondary particles. Masses have to be assigned to these velocity vectors in order to obtain four-vectors. As the COSY-TOF detector does not provide direct particle identification, the event-topology is used. For the secondary , the particle with the smaller angle to the direction of flight of the hyperon (determined from the direction from the primary to the decay vertex) is called “proton” while the other is called “pion”. Monte Carlo studies have shown that, due to the large mass difference of both particles, this assignment is correct for more than 99% of the events (97% in case of ).
In order to label each arm of the primary correctly as proton and kaon the direction of flight of the hyperon is used. This observable is measured independently twice, 1) from the vector connecting the origin with the vertex of the secondary and 2) from the missing momentum vector calculated from the primary particles. The latter is calculated for both possibilities of particle assignment, the one with the better match of flight directions is chosen to be the proper one. Monte Carlo studies have shown that the mass assignment is correct for about 80% of the events. Swapped mass assignments lead to a broad missing mass distribution in the final data sample with no peaks in the vicinity of the hyperon masses.
The background is reduced by requiring the properties of the secondary to match those of a decaying hyperon. Firstly, it is necessary that the angle of the secondary proton with respect to the flight direction lies within the kinematically possible region (). Secondly, the invariant mass of proton and pion, , is calculated from the flight direction of the hyperon (decay vertex), the measured four momentum of the secondary proton, and the direction vector of the pion. This value must match the mass within limits determined by Monte Carlo. The combination of both requirements reduces Monte Carlo and data signals by only 4% while 40% of the experimental background is suppressed in the final data sample.
As a final selection criterion, only events with the combined momentum vector of primary proton and kaon pointing in the backward CMS hemisphere are considered. Due to the Lorentz boost the particles in this hemisphere have smaller velocities in the laboratory system. This increases the relative time-of-flight resolution, which in turn significantly increases the absolute momentum, and hence, the missing-mass resolution. It should be mentioned that this requirement leads to no loss of physical information, as the symmetric entrance channel (proton-proton) enforces the same physics in either CMS hemisphere.
2.3 Acceptance correction and absolute normalization
The Monte-Carlo package used lasvegasbeschreibungBrand ; lasvegasbeschreibungZielinsky models the detector and the physical processes to great detail. The event generator produces the particles of the exit channel either according to the three-body phase space, or likewise, intermediate resonances can be chosen in order to model a two-step creation process (, ). The particles (and their daughters, granddaughters, …) are then propagated through the detector. Branching ratios and lifetimes of all particles are incorporated according to the values given in pdg06 . Energy loss, small-angle scattering, nuclear reactions, and -electrons are considered. From the energy deposit in the active detector components digitized QDC- and TDC-signals are generated. Noise and thresholds are modeled as known from the measured detector response. Deviations from an homogeneously populated phase space can be introduced by a weight function on an event-by-event basis (this procedure is called filtering in the following). Finally, the Monte Carlo data are subjected to the very same routines as real data in order to determine the acceptance.
The use of phase-space distributed data as Monte Carlo input is only justified if the reaction under study is homogeneously distributed in phase space or if the acceptance coverage of the detector is homogeneous over the whole five-dimensional event-space of the three-body final state. Two deviations from three-body phase space are likely to occur in proton-proton experiments: anisotropic angular distributions causing particles to prefer different angular regions (of possibly different acceptance) and intermediate nucleon resonances limiting the available phase space of all decay products caused by the mass and width of the resonance.
The influence of anisotropic angular distributions on the overall acceptance was investigated by filtering the Monte Carlo input in such a way as to match the experimental results. For all modeled angular distributions a change of the overall acceptance of less than 10% was found. The influence of nucleon resonances on the acceptance corrected data was deduced by using a set of Monte Carlo data created with different resonances (, 1535, 1650, 1720, 1850, 1900 ; , 100, 150, 200, 300, 400 ). Only minor changes of the acceptance corrected differential distributions were observed and the total cross section changes by less than if the width of the resonance was chosen to be larger than 100 MeV. As, at present, there is no theoretical model available on which a proper Monte Carlo simulation can be based, a homogeneously populated phase space modified to model measured angular distributions was used throughout the analysis. Details will be given when discussing the angular distributions.
The overall acceptance for the reactions under study is mainly governed by three obvious contributions, namely the branching ratio to charged particles (64%), the restriction to one CMS hemisphere (50%), and the probability of the secondary vertex to be located within the “decay volume” (30%) indicated in the lower part of fig. 2. The decay of kaons and pions in flight as well as a decay pion escaping detection contribute in an intertwined manner (). The overall acceptance is found to be % in case of and % in case of detection. The relative uncertainty of the acceptance correction was determined by investigating the effect of all restrictions imposed during the data analysis and was found to be below 10%.
In the case of differential distributions the acceptance varies smoothly with the observable under consideration. Here, an additional uncertainty comes into play due to the gradient of the acceptance function. This additional uncertainty is taken into account by choosing , where is the acceptance in bin . The square root of the quadratic sum of this acceptance uncertainty, the statistical error, and the uncertainty due to signal-background separation (see below) will be shown when presenting the data.
The absolute normalization is determined via the analysis of elastic scattering, which was recorded simultaneously during the experiment. Our results are normalized to high quality data on elastic cross sections provided by the EDDA collaboration edda00 and yielded the numerical values for the time-integrated luminosity of (2950 MeV/c), (3059 MeV/c), and (3200 MeV/c). The total uncertainty of this procedure (5%) is in equal parts due to our analysis and the uncertainty of the literature data. For details see MSWdiss ; WU07 .
2.4 Determination of the signal yields
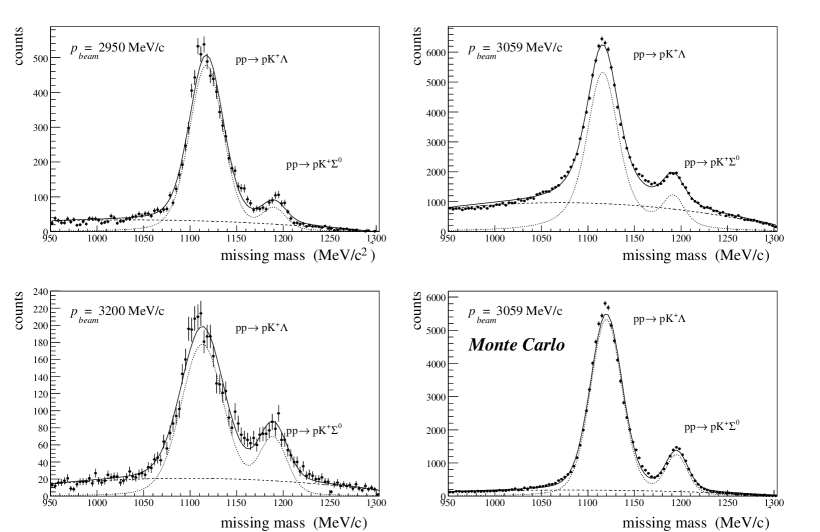
Figure 3 shows the missing mass spectra measured at the three excess energies. In addition the Monte Carlo result is shown for a beam momentum of 3059 MeV/c (lower-right) The ratio of Monte Carlo and events are chosen according to the total cross sections measured for each excess energy. Distinct signals for the and the hyperon can be seen above a smooth and structureless background. As usual for time-of-flight detectors, the missing mass resolution (momentum resolution) is best for smaller velocities in the exit channel (smaller beam momenta in the entrance channel). Comparing the spectra, the higher luminosity is reflected in the spectrum for , a better beam quality for the measurements at and manifests itself in a low background contribution.
The number of events in the missing-mass peaks are obtained by consecutively fitting first the background and then the signals. For the background parametrization quadratic or cubic polynomials are used, where only missing masses below the - and above the -peak are taken into account. Both types of parametrizations lead to the same final results within 2%. Then, the background parameters are fixed and the signals are described by two Voigt functions (convolution of a Gauss- and a Lorentz-function). Voigt functions are chosen since they model properly the signal shape of a rather narrow peak accompanied by broader tails. A superposition of two Gaussians, however, yields the same results within uncertainty limits dietrich06 .
The overall systematic uncertainty due to signal and background separation is determined by varying the fit-region for the background-fit below and above the two peaks. In the case of production this uncertainty is rather small (5%), especially as the contribution of the much smaller signal is negligible. The relative influence of the background on the systematic uncertainty is larger for the smaller -signal (15%). Here, the signal-to-background ratio is close to unity and more sensitive to the choise of fitting regions. In addition, the uncertainty of the contribution of the much larger signal is not negligible, especially as the -signal happens to appear near the maximum change of the slope of the -tail.
For the total cross sections statistical uncertainties which reflect the numerical uncertainties of the fitting procedure are quoted while the systematic uncertainties are the quadratic sum of the uncertainties of luminosity determination (5%), acceptance correction (10%), and signal integration (5% for and 15% for ).
Differential cross sections are determined in analogy to the total yield, only that the amount of signal and background is determined individually from missing mass spectra generated for each bin of the observable under study. The widths of the bins are chosen according to the detector resolution and statistical aspects. In addition, the secondary is required to have in each arm four track points in the two hodoscopes. This requirement further reduces background and allows to separate a clean signal also in angular bins containing only a small number of counts.
3 Results and discussions
The interpretation of experimental data on proton-proton induced hyperon production is difficult for three reasons. First off, the different reaction mechanisms (light/heavy non-strange as well as strange meson exchange, nucleon resonances, and FSI, …) are likely to interfere, i.e. the effects of the different contributions cannot be seen in a pure and isolated manner. Second, each particle in a three-body final state is always connected kinematically to the other two. This can lead to correlations between two different observables and renders a true physical cause difficult to disentangle from its effect. A well known example for this to happen is the reflection of a resonance seen in a Dalitz plot. And finally, the interpretation of the experimental data by theory is often ambiguous as different conclusions can be drawn from the same experimental data set. For these reasons the interpretation of the results presented will be using only general arguments based on kinematics and conservation laws.
In the following the total cross sections for both channels will be presented and discussed, where in particular the energy dependence ot the ratio will be addressed. Then the differential distributions of the reaction will be shown for all three excess energies in various reference frames. Using these results we will elaborate on the reaction mechanism as it manifests itself in these differential distributions. Finally, the first differential observables for production in proton-proton collisions will be presented for the high statistics data set. Here the discussion will concentrate on a comparison of the two reaction channels and the reaction mechanisms involved. The numerical values of all one-dimensional cross sections are listed in the appendix.
| acc (%) | counts | ||
|---|---|---|---|
| 1.95 | 7228 | 21.8 0.3 2.7 | |
| 1.72 | 89684 | 24.4 0.1 3.0 | |
| 1.63 | 3322 | 32.0 0.9 3.9 | |
| 1.28 | 676 | 3.1 0.2 0.6 | |
| 1.51 | 12644 | 3.9 0.1 0.7 | |
| 1.45 | 800 | 8.6 0.5 1.6 |
3.1 Total cross sections
The results for the total cross sections are listed in table 1. They are included in fig. 4 which shows in the upper part the world data of total cross sections for the reaction and ( MeV). Our new data extend the near threshold measurements by roughly 80 MeV excess energy, i.e. directly into the region where the energy dependence of the ratio of the cross sections is not known well. Up to the excitation function is very well described within the experimental resolution by a pure phase space dependence given by (, dash-dotted line in fig. 4).
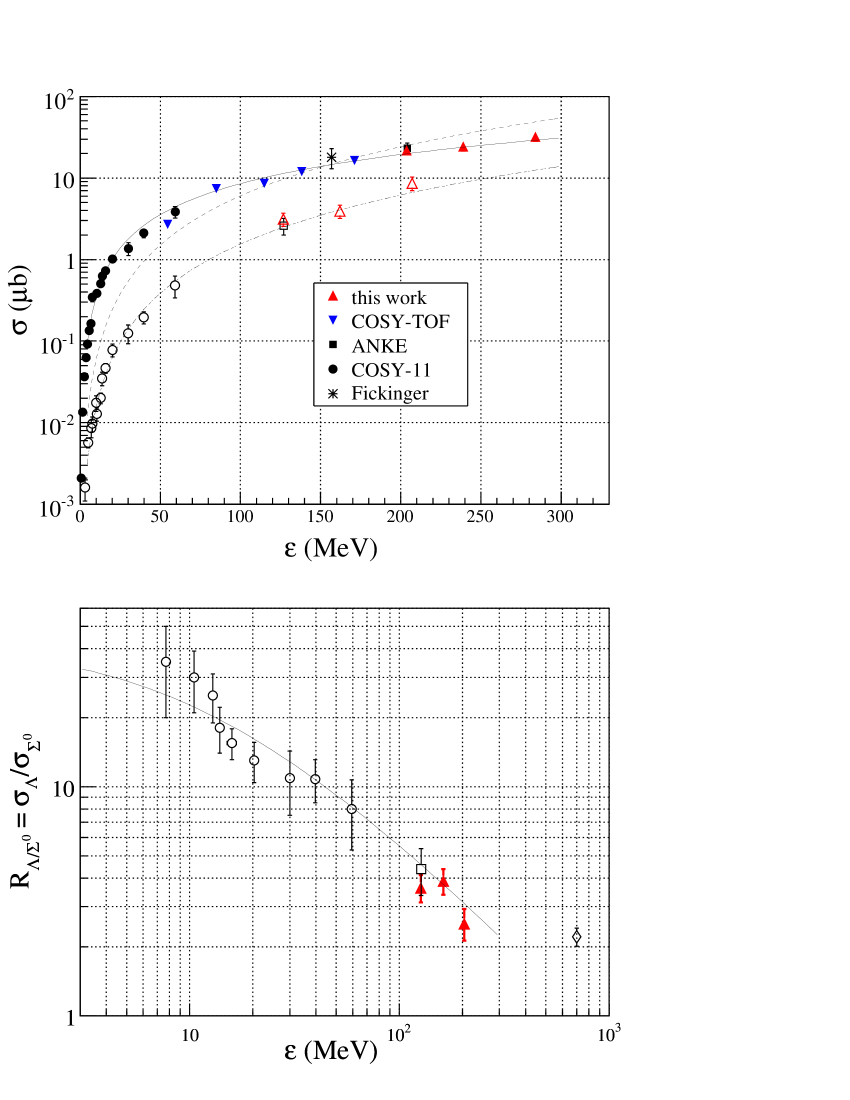
The excitation function of clearly cannot be parameterized by pure phase space (dashed line in fig. 4). A parametrization proposed by Fäldt and Wilkin faeldtwilkin97 is more appropriate
| (1) |
and describes the energy dependence of the cross section well up to 300 MeV (solid line in fig. 4; the parameters and can be related to the -FSI).
In the lower part of fig. 4 the ratio of both parametrizations is shown as a solid line together with the world data on cross section ratios balewski98 ; COSY11kowina04 ; baldini88 . At the excess energies of 127 MeV a data point is added which is determined from the measured cross sections given in valdau07 and the parametrization (1). At the same energy and at 162 MeV our results (shown as triangles) are also included, where the parametrization (1) and our new cross sections for are used.
The two experimental cross sections of at and at are used to directly calculate the ratio of , as the phase space volume differs by less than 3%. In this ratio systematic uncertainties of the two measurements partly cancel (see introduction). The new experimental value confirms the general trend towards the high energy limit of 2.2, which has been determined experimentally for in the 1960ies and 1970ies. At an excess energy of 204 MeV is found to be more than one standard deviation below the value of three which follows from isospin considerations, and thus, this reasoning is unlikely to be the proper approach to explain the to cross section ratio.
Obviously, the energy region of enhanced over production ends at excess energies of slightly above . This surely is a surprise and will have implications on theory as for example the calculations of sibi06 predict values of at and must be reconciled with the present finding. The same authors, however, point out that the total cross sections for hyperon production are not sufficient to tightly constrain the parameters of any model. Therefore, differential distributions will be presented next.
3.2 Differential distributions:
Differential data for the reaction are presented in figs. 5 to 9. In the one-dimensional differential distributions, data points are included as long as the uncertainty (quadratic sum of statistical error, the uncertainty of signal integration and acceptance correction) in a specific bin is below 80% of its cross section value. In order to base the discussion on a quantitative footing, all one-dimensional distributions have been subjected to a least square fitting with Legendre polynomials . The coefficients are listed in the respective tables 2 to 4 and will be used only to judge anisotropies ( and ) and asymmetries (, representative for all ). The energy dependence of the observable under study can also be inferred and is found to be, in general, rather weak. It should be noted in passing that the total cross section given by the integral of each differential distribution () in all cases is compatible within uncertainty with the values listed in table 1. The results obtained from (filtered) Monte Carlo data and the detector acceptance will be shown where appropriate.
3.2.1 Dalitz plots
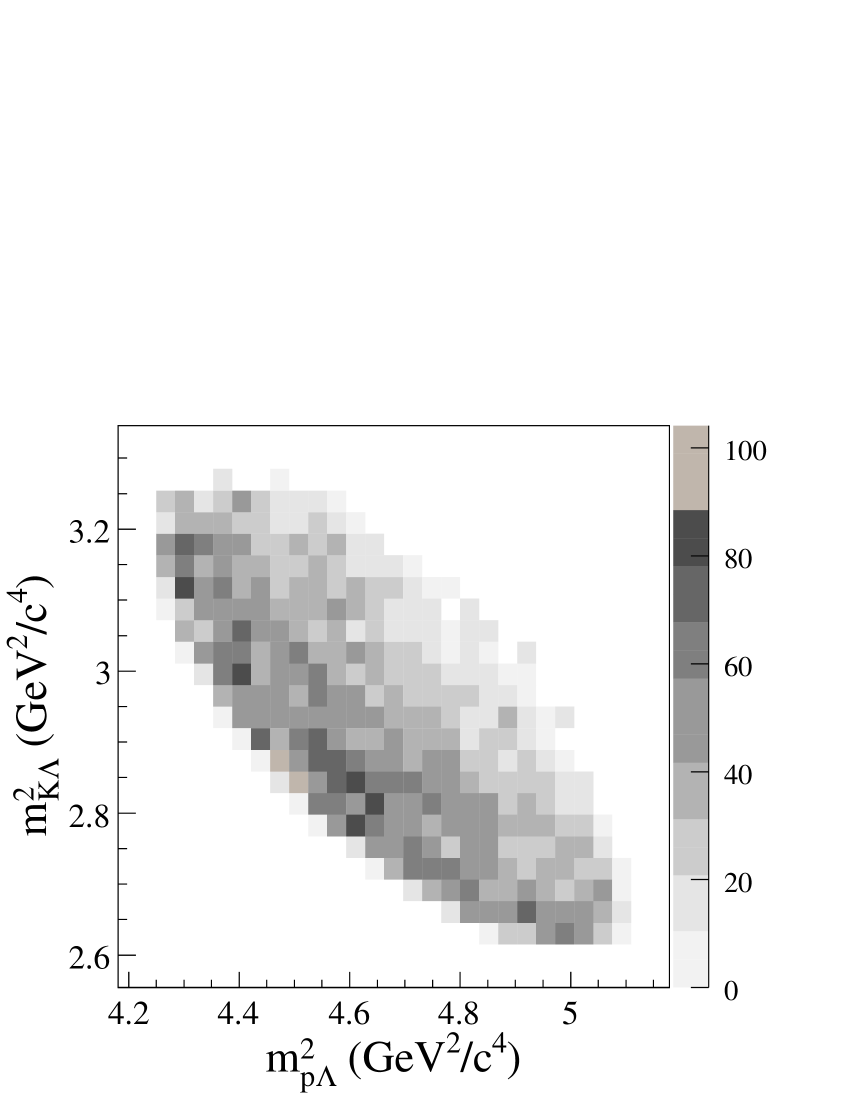
The acceptance corrected Dalitz plot () of the final state is shown in fig. 5 for an excess energy of 204 MeV (). Data is shown for a missing mass region of around the mass, hence reducing the contribution of background and hyperons. The plot is not corrected for background, however, sideband cuts below the -mass have been checked and show the background not to be responsible for the structures seen.
The relative bin occupancy of the Dalitz plot shown in fig. 5 resembles strongly the one presented in toflambda06 , which was determined for a smaller excess energy of (). In both cases the kinematically allowed region is covered, an enhancement of the data is apparent along the lower -mass boundary, and no prominent resonant band is observed along the axis. This signature is explained in toflambda06 by means of a quantitative Dalitz plot analysis. It was found that the nucleon resonances N(1650), N(1710), and N(1720) in conjuction with a sizable p FSI play a decisive role, however, both are strongly interrelated by interference effects. A detailed analysis of a series of Dalitz plots measured at excess energies of 204, 284, and 316 MeV is the subject of a forthcoming publication of the COSY-TOF collaboration erlangenzukunft10 .
The present paper, hence, does not aim at an analysis of the Dalitz plot. We rather focuses on presenting and discussing sets of one-dimensional differential distributions which have not been published so far. Our results substantially complement as well as support the earlier Dalitz plot analsis of toflambda06 .


| cos | ||||
|---|---|---|---|---|
| — | ||||
| — | — | |||
| — | ||||
| — | ||||
| — | ||||
| — | ||||
| — | ||||
| — |
| cos | ||||
|---|---|---|---|---|
| — | ||||
| — | — | |||
| — | ||||
| — | ||||
| — | ||||
| — | ||||
| — | ||||
| — |
| cos | ||||
|---|---|---|---|---|
| — | ||||
| — | — | |||
| — | ||||
| — | ||||
| — | ||||
| — | ||||
| — | ||||
| — |
3.2.2 Angular distributions in the overall CMS
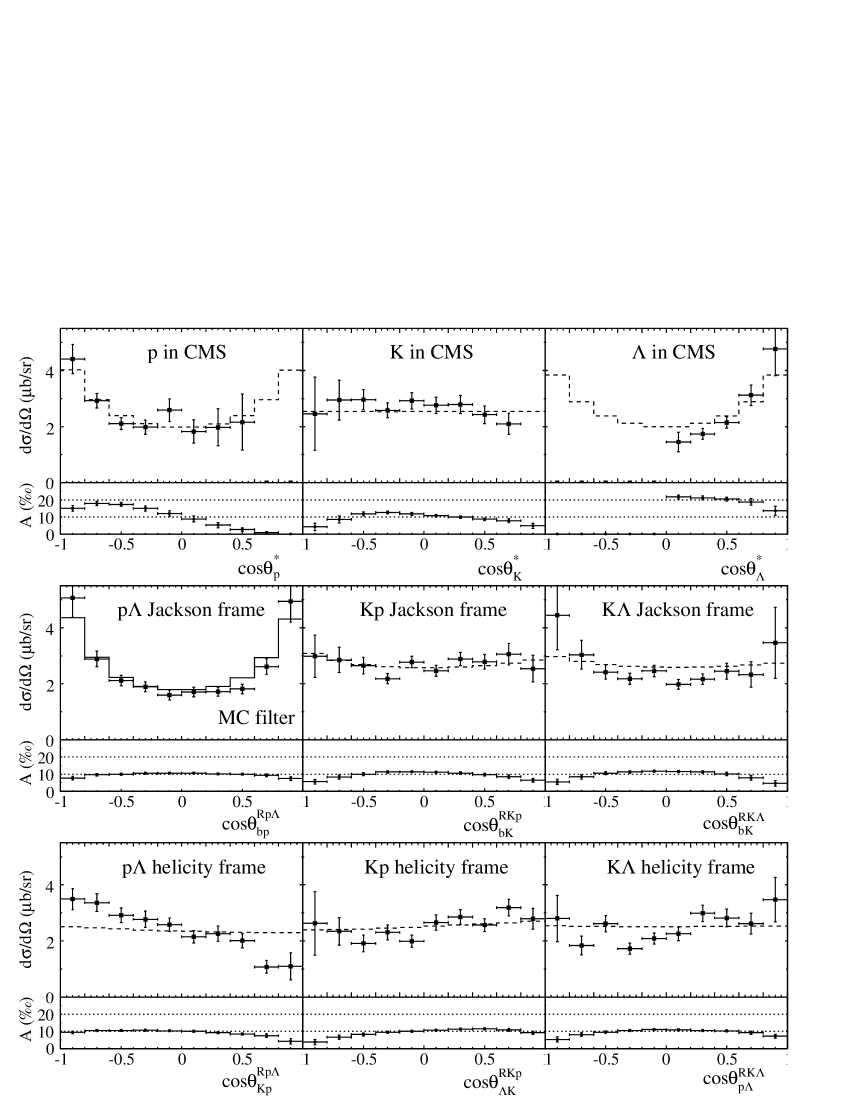
The angular distributions of the three ejectiles in the overall CMS are shown in the upper row of figs. 6 to 8. The dashed histograms shown in the same pictures correspond to filtered Monte Carlo data and will be explained in detail in the following section. The change of acceptance is smooth as shown below each distribution. The steep decline of acceptance towards in the case of the kaon and proton distributions is caused by the requirement of evaluating only hyperons emitted into the forward CMS hemisphere. Nevertheless, the angular distributions of proton and kaon are symmetric with respect to as the coefficients in table 2 to 4 are compatible with zero. This symmetry in the overall CMS is mandatory in the case of identical particles in the entrance channel.
The angular distributions of protons and hyperons show a pronounced anisotropy. The proton distributions even require the inclusion of . These anisotropies reflect relative angular momentum, , in both the and system. From an inspection of the Legendre polynomial coefficients in tables 2 to 4 one deduces () for the former and () for the latter. In contrast, the angular distributions of the kaons are essentially isotropic with coefficients deviating slightly from zero only for the two lower energies. This indicates relative angular momentum in the system, if at all present, to become of even minor importance with increasing excess energy.
The three CMS angular distributions are compatible with each other simply due to kinematics. If the system is assumed, as working hypothesis, to form an -resonance the angular distribution of is the mirror image of that of the associated proton. The -resonance decays in its own rest frame back to back into hyperon and kaon. The available energy in this two-body decay depends on the mass of the resonance and may vary between zero and . However, due to the phase space volume, it will mainly be at intermediate excess energies, i.e. in the order of 100 MeV. Kinematics then constrains the (heavier) hyperon to mainly preserve the direction of flight of the -resonance, while the (lighter) kaon can be emitted isotropically. This kinematic situation holds also true if the resonance has a very large width; then the kinematics becomes similar to that of particles distributed homogeneously according to three-body phase space.
Thus, the angular distributions in the overall CMS are not well suited to directly draw conclusions on resonant or non-resonant production, as the former always displays a convolution of a two step process (, ). It will be shown in the following that Jackson and helicity frames are the much more natural choice of Lorentzian frames in order to study the reaction properties due to intermediate resonances.
3.2.3 Angular distributions in Jackson frames
The motivation for an analysis within Jackson frames222 For reactions of type the Jackson frame is defined as the Lorentzian frame in which the center of mass of the particles (2,3) is at rest (). In this frame the Jackson angle is defined as the angle between the beam direction and that of particle 3, i.e. . This frame connects exit and entrance channel and carries information not accessible by means of a Dalitz plot analysis. In a three-body final state three two-body subsystems can be used to define a Jackson frame (R23, R31, R12; indicating est frame). The nomenclature of Byckling is adopted: For the superscripts denotes the rest frame under consideration, the subscripts indicate the angle of particle 3 with respect to the beam ., introduced by Gottfried and Jackson as early as 1964 GJ , arises by considering the vertex in fig. 1b, c to represent an isolated “” reaction (the following argumentation is similar for the vertex in fig. 1a). In this picture, the inverse reaction () must have the same properties due to time reversal invariance. If one now imagines colliding beams of kaons and hyperons with , which is by definition the Jackson frame, it is self-evident that the distribution of angles of the (in this case emerging) proton with respect to the (in this case beam-axis defining) kaon directly gives information on the relative angular momenta involved. This argumentation holds with or without an intermediate nucleon resonance.
Considering only this vertex four different particles are involved and, hence, the angular distributions are not at all restricted to show any symmetry with respect to . In fact, scattering shows a strong anisotropy which can be traced back to the interference of resonances with opposite parity knasel75 ; baker78 . Of course, the concept of an analysis within a Jackson frame is based on the presumption that there is no difference between a free and a virtual pion, and the form factor entering the vertex is the same for both the two-body and the three-body reaction with no influence of the additional proton in the latter case.
A peculiarity arises in our case from the fact that the entrance channel consists of identical particles which results in symmetric angular distributions in the overall CMS in which beam and target are collinear. However, this collinearity is destroyed when the system is boosted into a Jackson frame (the angle between the two protons is on average). As beam and target particle are indistinguishable, the reference axis for the Jackson angle can be the direction of either proton. Therefore, the quantum mechanical identity of beam and target proton enforces the same angular distributions in the Jackson frame, when measured with respect to either proton. However, as a Jackson frame is some other Lorentzian frame than the CM-system, the distributions are not required to show any symmetry.
The angular distributions in the Jackson frames are shown in the middle rows of figs. 6 to 8. As the two protons of the initial state cannot be distinguished, both Jackson angles with respect to beam and target have been taken into account for each event (maintaining for simplicity the subscript in ).
A pronounced anisotropy is observed in the Jackson frame which is due to a relative angular momentum of in the system (see table 2 to 4). This anisotropy as well as those of the angular distributions of protons and -hyperons in the overall CMS suggest their connection through kinematics. In order to investigate this conjecture all distributions measured in the CMS and the Jackson frames were used as weight functions for Monte Carlo simulations. It was found that solely the filter on the distribution in the Jackson frame (solid histogram in figs. 6 to 8) results in a consistent and satisfactory description of all CMS distributions, illustrated by the dashed histograms. It is concluded that the resonance reaction with angular momentum in this “exit” channel is of importance. The rest frame (which coincides with the CMS) is well represented by the Jackson frame, due to the large mass difference of kaon and hyperon. Hence the Jackson frame is the natural reference frame to study the dynamics of the intermediate system. It should be stressed that this information on angular momentum () in the p- system is accessible neither by inspecting the CMS distributions nor the Dalitz plot. It is explicitly the choice of the respective Jackson frame which enables one to identify this aspect of the reaction dynamics.
The angular distributions in the K+p-Jackson frame are expected to be basically isotropic if the reaction procedes in two steps via an intermediate -resonance as the final state protons and kaons do not originate from the same vertex (cf. fig. 1b,c) and are correlated only through kinematics of the final state. If, however, kaon exchange as indicated in fig. 1a plays an important role the distribution in the K+p-Jackson frame could reflect properties of that process which may even involve a yet unknown intermediate pentaquark-resonance. The experimental angular distributions are symmetric within the experimental uncertainties (cf. coefficients in tables 2 to 4). There is a clear tendency for the coefficient to decrease with increasing excess energy pointing at an angular momentum of at most one unit to be present in the K+p interaction at smaller excess energy while tends towards zero at higher excess energies. The Monte Carlo angular distributions resulting from the filter applied in the Jackson frame reproduce the data quite well. This is taken as evidence for a kinematical correlation rather than a strong indication for kaon exchange, which, however, cannot be excluded to contribute at some level. In fact, Balestra et al. balestra99 concluded from negative spin transfer coefficients , measured in exclusive production from collisions at 3.67 GeV/c, kaon exchange to contribute to the reaction mechanism in conjuction with pion exchange and final state interaction.
The experimental angular distributions in the Jackson frame tend to be both anisotropic and asymmetric. Both effects are only poorly reproduced by filtered phase-space Monte Carlo data. It is thus tempting to assume these angular distributions to be caused by the excitation of -resonances decaying into the channel. All these nucleon resonances have large widths and may contribute through their broad tails to the reaction, even if their central mass is outside the mass region between the threshold (1609 MeV/c2) and 1893 MeV/c2 (for the highest excess energy). An inspection of pdg06 reveals a long list of possibly participating resonances, classified as either , , , , , or . A -resonance cannot contribute due to isospin conservation. The coefficients of table 2 to 4 show to have a tendency to be non-zero while is non-zero. The fact that the inclusion of Legendre polynomials up to suffices for a good description shows that only angular momenta of are participating in this “22 reaction” or, in other words, if -resonances are involved their decay angular momentum must be . This constrains the resonances possibly involved to , , and , where belongs to the former, to the latter two. Contributions of , , or resonances, which would require , are therefore not supported by the data.
The angular distribution of a true two-body resonance reaction is asymmetric () only if resonances with both parities are simultaneously excited through interfering amplitudes BlattBiedenharn - this is observed in scattering knasel75 ; baker78 . Hence, this distribution in the Jackson frame is a strong indication in the present analysis of one-dimensional distributions that more than one resonance with opposite parity participates in the production process, namely , , and . This section is concluded by stressing that this finding is fully consistent with that extracted from the Dalitz plot toflambda06 which describes the correlations of the exit channel only.
3.2.4 Angular distributions in helicity frames
In a reaction of type 123 the helicity angle in a respective helicity frame333For reactions of type the helicity frame is defined as the Lorentzian frame in which the center of mass of the particles (2,3) is at rest (), i.e. it is the identical Lorentzian frame as the respective Jackson frame. The choice of the word “frame” relates to the reference axis, which in case of the helicity frame is the direction of particle 1. As in the case of Jackson frames, three helicity frames can be constructed by cyclic permutation for the three-body final state (R23, R31, R12). Nomenclature: is the angle of particle 3 with respect to the reference axis 1 (subscript), measured in the rest frame of particle 2 and 3 (superscript). interrelates the three particles of the exit channel; in fact, the helicity angle distribution is simply a special type of projection of a Dalitz plot. A uniformly populated Dalitz plot corresponds to isotropic helicity angle distributions whereas all physical and/or kinematical effects distorting the Dalitz plot must result in characteristic distributions in helicity frames. For example, an isolated narrow resonance decaying into the (23) system manifests itself as a “band” extending along the (or likewise ) axis in a Dalitz plot. The properties of mass and width of the resonance are seen in the (12) and (13) helicity frames while the decay pattern characteristic for the angular momentum of the resonance shows up in the (23) helicity frame.
Final state interaction also distorts a Dalitz plot and consequently FSI effects are also seen in helicity angle distributions. A strong FSI, for example, between particle 1 and 3 leads to an enhancement at and . If, however, FSI-effects and various (resonant and non-resonant) reaction mechanisms contribute the situation becomes by far more complicated and quantitative conclusions can only be drawn with caution. Then, theoretical models have to treat all contributions in a coherent manner and their results have to be confronted with the data. Such an approach was adopted for the channel and an excess energy of 130 MeV by Sibirtsev et al. sibi06b . These authors pointed out that helicity distributions are ideally suited to determine the various contributions to the reaction mechanism in a quantitative manner.
The angular distributions in the three helicity frames are shown in the lower rows of figs. 6 to 8. All distributions deviate significantly from isotropy. The dashed histograms, which are isotropic, again are the results of Monte Carlo data filtered with the experimental distribution as measured in the -Jackson frame. The filter is without any effect on the helicity angle as the latter is solely an exit channel property. The parameters of Legendre polynomial fittings to the experimental distributions are shown in tables 2 to 4.
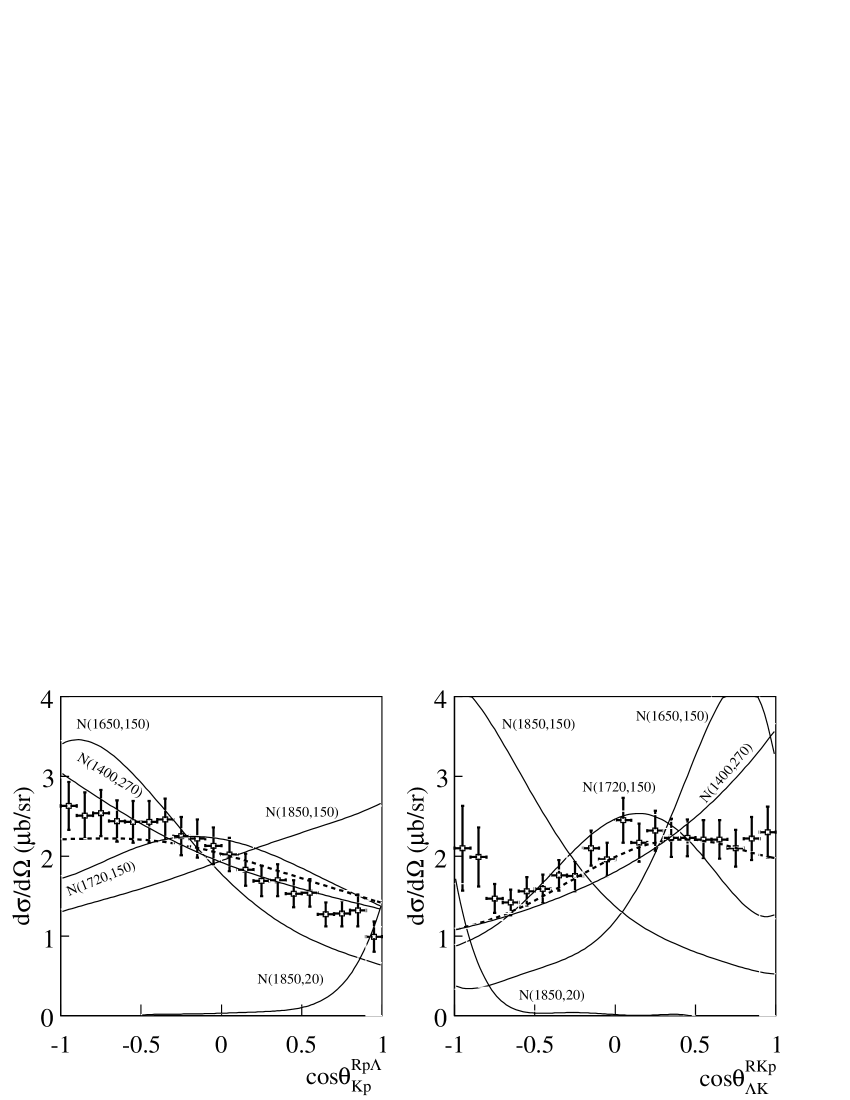
As mentioned above, the distributions in helicity frames both depend on and reflect, via kinematics, the masses and the widths of participating nucleon resonances. In order to stress these aspects, the experimental data taken at are shown in fig. 9 again, left hand side in the , right hand side in the helicity frames. In the same pictures are included the results of Monte Carlo simulations of single nucleon resonances () with mass and width abbreviated as . In addition, the result for an incoherent sum of three Monte Carlo data-sets (phase space, , - all entering with equal weight) is shown as a dashed line. Some general conclusions will now be drawn by comparing these Monte Carlo distributions with the measured ones.
The effect of narrow resonances (N(1600), N(1650), N(1720), N(1850); ) is studied first; they were found to cause strongly localized distortions of the distributions in both helicity frames. As an example the result for , assumed to have a cross section of , is shown in fig. 9. In this case the distribution in the helicity frame would leave room for such a resonance to contribute, however the corresponding characteristic distortion in the helicity frame is not observed experimentally. The results obtained for all the other narrow resonances are incompatible with the data in both frames. Hence, any hypothetical narrow resonance (“missing” or exotic) is excluded to contribute on a level of about .
Resonances with masses and various widths of =150 to yield distributions incompatible with the measured ones. As an example for this class of resonances, the effect of the is shown in fig. 9. The distributions of measured and Monte Carlo data clearly show opposite slopes in either frame. Thus a whole set of resonances, namely pdg06 , sarantsev05 , sarantsev05 , McNabb04 ; glander03 , and pennerNmosel02 is unlikely to contribute to the reaction .
The kinematical effect of a light nucleon resonance was studied by means of a simulation of an resonance. As its central mass is smaller than the sum of the masses of kaon and the production process can only proceed via the broad tail of the resonance. The numerical values for mass and width are chosen according to the result of the resonance isobar model of ref.luizou06 which explains well the energy dependence of the ratio by invoking only this resonance. The distributions generated by this single resonance follow fairly well the experimental one in the but fail to produce that observed in the helicity frame. Hence, a broad sub-threshold resonance alone is not able to account for the kinematic situation found in the final state.
The same observation holds true for both N(1650,150) and N(1720,150) which on their own are not able to describe the observed angular distributions in fig. 9. Similarly, a distribution according to pure three-body phase does not follow the data as it leads to isotropic distributions (not shown). On the other hand, the sum of these two resonances and phase space (represented by the dashed line) follows the experimental data very well. Of course, this mere incoherent superposition reflects only a particular kinematic situation (omitting FSI effects) and does not describe the dynamics of the production process. Therefore, beyond kinematics, it should be interpreted with caution, especially as the analysis of distributions in the Jackson frame strongly indicated interference effects due to resonances with certain spins and opposite parity, namely , , and . These are just the states , / which were included in the Monte Carlo simulation. Thus, the very good reproduction of the experimental data by a curve resulting from an incoherent sum of three Monte Carlo data sets supports, from a kinematical point of view, that the resonances involved are, indeed, , / .
Finally, the implications of the -helicity angle distributions for the explanation of the to cross section ratio near the threshold are discussed. In deswat63 was predicted from the ratio of the coupling constants . Obviously, for this prediction to apply the production process must be dominated by kaon exchange (fig. 1a). Pure kaon exchange, however, should lead to an isotropic distribution in the -helicity frame sibi06b , which is not observed experimentally. Hence, kaon exchange cannot be the dominant production process and nucleon resonances have also to be taken into account at the excess energies considered here. Then it is reasonable to assume that resonant contributions are also present near the threshold, as, e.g., the resonance (width pdg06 ) can easily be produced at threshold energies. Hence, the explanation of the to be solely related to the coupling constants is not likely to be correct.
The angular distributions in the helicity frame are shown in the lower-right frames of figs. 6 to 8. An apparent enhancement towards is observed for all excess energies. This asymmetry cannot be caused by any single nucleon resonance, as in this case the distribution would be either isotropic (decay angular momentum ) or symmetric with respect to ().
The FSI introduces an asymmetry with enhanced cross section towards . However, FSI effects are limited to relative energies of the system of just a few MeV and therefore influence only a limited region of the Dalitz plot at the excess energies considered here. Thus, it is difficult to see how the observed asymmetric distribution in the helicity frame, which is a projection of the whole Dalitz plot, can be explained solely by FSI. If one excludes exotic resonances decaying into the or channel, which would lead via kinematics to an asymmetry in the helicity frame, one is left with the conclusion that a coherent interference of various resonances (including FSI) dominates the reaction. It is known that the interference of resonances of different parity leads to asymmetric angular distributions BlattBiedenharn . The analysis of the distributions in the Jackson frame evidenced that more than one resonance of opposite parity are involved. The discussion of fig. 9 showed that a combined contribution of the and /, which have opposite parity, is kinematically supported. Hence, the mentioned interference of resonances with different parity is possible and likely to cause the asymmetry observed in the helicity frame.
We like to end this section with a comment on a very recent observation of an exotic resonant state (, = 118 MeV/c2) which decays into two baryons, a non-strange proton and a strange hyperon DISTO2010 . The resonance is interpreted to be a deeply bound, compact cluster (binding energy 100 MeV) which, hence, could be a possible gateway towards cold and dense kaonic nuclear matter. The measurement was carried out with a beam momentum of 3670 MeV/c which corresponds to an excess energy of MeV. At this energy, the contribution of this exotic production to the total cross section is found to be about 20%.
Compared to DISTO2010 the beam momenta considered in this paper (2950, 3059, 3200 MeV/) correspond to considerably smaller excess energies of -9, 26, and 71 MeV for production. Due to the width of the resonance the final state is kinematically accessible even at the negative excess energy of -9 MeV. However, all three excess energies are smaller than the width of the resonance. Thus, the strength of possible contributions must consequently be considerably smaller compared to DISTO2010 . Contributing only on a few percent level, such a weak signal is obviously difficult to observe directly in figs. 6-9. Theory is now asked to explore the benefit of adding this exotic state, in addition to “standard” nucleon resonances decaying into , when reproducing our data.
3.3 Differential distributions:
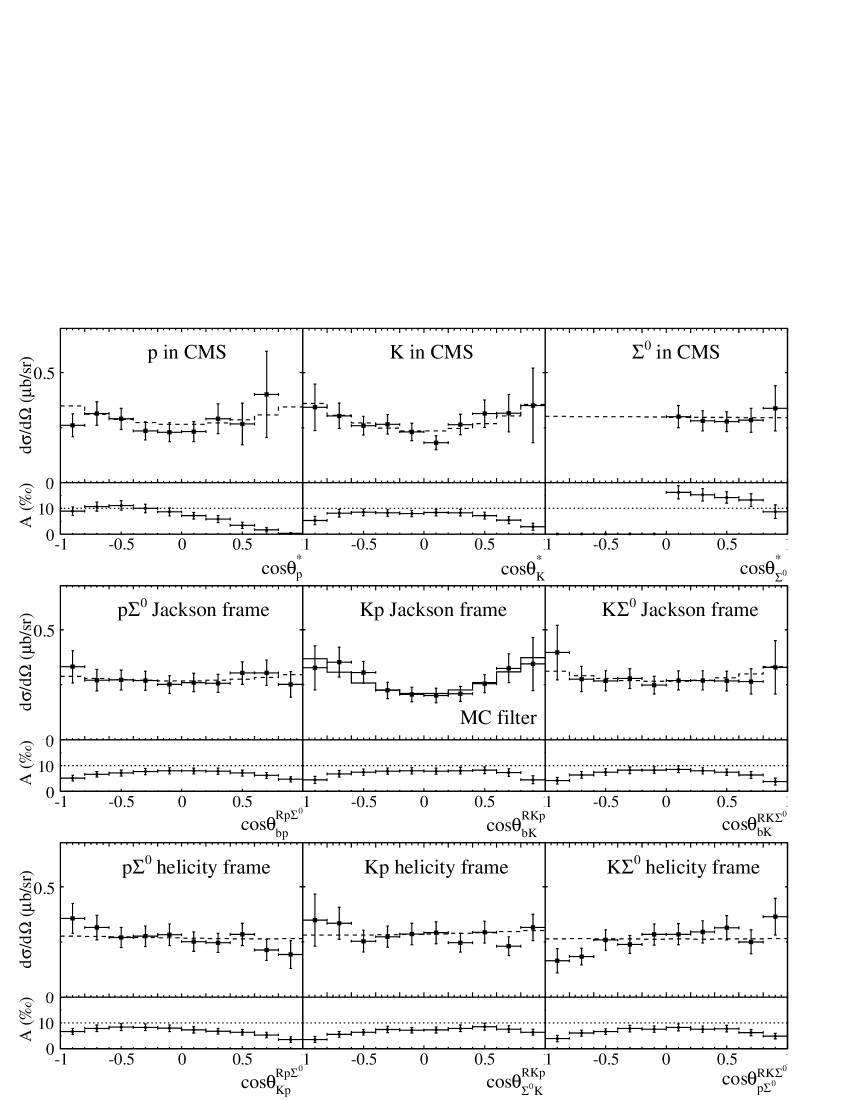
The data set taken at ( ) provides for the first time direct insight into the reaction dynamics of proton-proton induced production as differential observables are accessible. These angular distributions are shown in fig. 10; the coefficients from the least square fitting are listed in table 5. The histograms represent filtered Monte Carlo data, which will be explained in the course of the discussion. The arrangement within the figure is analogous to the case of production (figs. 6 to 8), i.e. the first row shows distributions in the overall CMS while in the second and third row distributions in the Jackson and helicity frames are presented, respectively. In order to avoid repetition, we will draw on arguments presented above in order to directly deduce conclusions on production. Emphasis will be put on a comparison of both hyperon production channels closest in excess energy where, for the time being, the difference in and is ignored. This seems justified as the reaction mechanism for production was found, as shown above, not to change dramatically with excess energy.
| cos | |||
|---|---|---|---|
| — | |||
The distributions in the overall CMS and the Jackson frames for and production (first/second row in figs. 6 and 10) not only differ apparently but in addition show an opposite behavior. An inspection of the parameters given in table 5 shows that the proton and CMS distributions as well as the those in the and Jackson frame are compatible with isotropy whereas the corresponding distributions in the channel (table 2) show strong anisotropy; for the channel the kaon distribution in the CMS and that in the Jackson frame feature a pronounced anisotropy whereas the corresponding distributions in the channel show strong isotropy. These finding are the first proof that the reaction mechanisms differ significantly for the reaction and .
From the CMS distributions one directly concludes that the system shows some indication of while the hyperon has no relative angular momentum with respect to the subsystem. This is in line with the mainly isotropic distribution observed in the Jackson frame. Hence, if intermediate resonances are involved ( or ), the relative angular momentum shared by the or system is , remarkably different from the case of production.
The fact that no angular momentum is involved in the system signifies that only particular partial waves in the entrance channel can participate. The nuclear reaction theory developed by Blatt and Biedenharn BlattBiedenharn shows that isotropic angular distributions are only possible if one of the three following quantities is zero: entrance or exit channel angular momentum or total angular momentum. This condition is always fulfilled for the entrance channel states and , irrespectively of the final state involved. It is also met for if it produces or resonances in the exit channel. Thus, the observed isotropy significantly constrains partial waves being possible in entrance and exit channel. A conclusion like that could not be drawn in the case of the reaction as the corresponding angular distributions are anisotropic.
The distribution in the Jackson frame shows isotropy within uncertainty. Hence, there is only little room for resonances with intrinsic angular momentum. Thus, from the list of nucleon resonances with assumed decay branches to pdg06 , the resonances to be possibly involved are most likely , and while , , and seem less probable to contribute.
The distribution in the Jackson frame shows anisotropy. This indicates that the proton-kaon subsystem carries a relative angular momentum of . This cannot be the decay angular momentum of or resonances as it is impossible for them to disintegrate into a non-strange proton and a strange kaon - only an as yet unknown pentaquark state could feature such a decay. The anisotropy observed is rather conjectured to be a strong indication of the presence of kaon exchange (fig. 1a). This again discriminates between the and the channel.
As in the case of the production a filter was set on those distributions which deviate the most from isotropy. It is found that the filter on the distribution in the Kp Jackson frame (solid line histogram) is well suited to simultaneously describe the data in the CMS and Jackson frames (dashed line histograms).
The distributions in the three helicity frames are presented in the bottom row of fig. 10. Compared to those for the production shown in fig. 6 () these distributions feature a smaller, however, still significant anisotropy. In particular, the asymmetric distribution in the helicity frame show interference effects which, in the present case of production, may involve nucleon as well as resonances, kaon exchange potentially carrying angular momentum as well as all three possible final state interactions.
3.4 Summary
Associated strangeness production was investigated in the reactions and using data collected by the time-of-flight spectrometer COSY-TOF. Data were analyzed for three different beam momenta (), which correspond to excess energies of 204, 239, and in the case of production whereas the neutral is produced 127, 162, and above the threshold.
These measurements extend the experimental knowledge of both reactions by roughly into an energy range formerly believed to show an sizable enhancement of the ratio of the to cross section. At this ratio is found to be and shows the high energy limit, so far measured for , to be reached already in the region of the moderate excess energies considered here.
In the case of differential cross sections were obtained in the CM-, Jackson-, and helicity-frames for all three excess energies. Strong evidence was found for a production scenario including intermediate nucleon resonances. Especially a process which involves , , and/or is deduced from the data; , , and resonances are unlikely to contribute. Kaon exchange with angular momentum is excluded while may be present, however, surely not being the dominant process.
For the reaction the first differential data have been shown (). The distributions in the overall CMS as well as in the various Jackson frames feature an opposite behavior with respect to those observed for production. Only entrance channel partial waves , , and are found to be involved. Strong indication is found for kaon exchange carrying angular momentum. If resonances contribute to production they are likely to be of the type and .
Thus, one of the key results of this paper is the proof that the reaction mechanisms for and production differ decisively. With this differential data at hand theory is now challenged to advance a model which simultaneously describes the data presented.
Acknowledgment
The authors would like to express their gratitude to the COSY staff for the operation of the accelerator during the experiments. Discussions with V. A. Nikonov, A. V. Sarantsev and A. A. Sibirtsev are gratefully acknowledged. This work was supported in part by grants from BMBF and Forschungszentrum Jülich (COSY-FFE).
References
- (1) D. Grzonka and K. Kilian, Nucl. Phys. A 626, 41C-54C (1997)
- (2) J. T. Balewski et al., Nucl. Phys. A 626, 85C-92C (1997)
- (3) J. T. Balewski et al., Phys. Lett. B 420, 211-216 (1998)
- (4) S. Severin et al., Phys. Rev. Lett. 83, 682 (1999)
- (5) P. Kowina et al., Eur. Phys. J. A 22, 293-299 (2004)
- (6) M. Abd El-Samad et al., Phys. Lett. B 632, 27-34 (2006)
- (7) Yu. Valdau et al., Phys. Lett.B 652, 245-249 (2007) (e-Print: nucl-ex/0703044)
- (8) A. Baldini et al., Landolt-Börnstein, New Series, I/12b (1988)
- (9) J. J. De Swart, Rev. Mod. Phys. 35, 916 (1963)
- (10) A. A. Sibirtsev et al., Eur. Phys. J. A 29, 363 (2006)
- (11) R. Shyam, Phys. Rev. C 73, 035211 (2006) [nucl-th/0512007]
- (12) B. C. Lui and B. S. Zou, Phys. Rev. Lett. 96, 042002 (2006)
- (13) A. Gasparian et al., Phys. Lett. B 480 273 (2000)
- (14) M. Dillig and M. Schott, arXiv: nucl-th/0604059v1
- (15) R. Frascaria et al., Nuovo Cimento 102A, 561 (1989),
- (16) R. Siebert, Nucl. Phys. A 567 819 (1994)
- (17) J.-M. Laget, Phys. Lett. B 259 24 (1991), Nucl. Phys. A 691, 11c (2001)
- (18) S. Capstick and W. Roberts, Phys. Rev. D 58, 074011 (1998)
- (19) R. Bradford et al., Phys. Rev. C. 73, 035202 (2006)
- (20) M. Sumihama et al., Phys. Rev. C 73, 035214 (2006)
- (21) K. Hicks et al., Phys. Rev. C 76, 042201(R) (2007)
- (22) T. Mart and A. Sulaksono, Phys. Rev. C 74, 055203 (2006)
- (23) M.Q. Tran et al., Phys.Lett. B 445, 20 (1998)
- (24) PDG06, Journal of Phys. G, 33, 1-1232 (2006)
- (25) A.V. Sarantsev et al., Eur. Phys. J. A 25, 441 (2005)
- (26) J.W.C. McNabb et al., Phys.Rev. C 69, 042201(R) (2004)
- (27) K.-H. Glander et al., Eur. Phys. J. A 19, 251 (2004)
- (28) G. Penner and U. Mosel, Phys. Rev. C 66, 055212 (2002)
- (29) S. Capstick and C. Roberts, Prog. Part. Nucl. Phys 45, 2541 (2000)
- (30) W. Eyrich, Eur. Phys. J. A 31, 435-440 (2007)
- (31) W. Schroeder for the COSY-TOF collaboration, Eur. Phys. J. A 31, 503-505 (2007)
- (32) M. Abdel-Bary et al. (COSY-TOF collaboration), Phys. Lett. B 649, 252 (2007)
- (33) M. Dahmen, PhD Thesis, Rheinische Friedrich-Wilhelm-Universität Bonn, Jül-3140, ISSN 0944-2952 (1995).
- (34) R. Bilger et al., Phys. Lett. B 420, 217-224 (1998)
- (35) A. Hassan et al., Nucl. Instrum. Methods Phys. Res. A 425, 403 (1999)
- (36) M. Dahmen et al., Nucl. Instruments Methods Phys. Res. A 348, 97 (1994)
- (37) A. Böhm et al., Nucl. Instruments Methods Phys. Res. A 443, 238 (2000)
- (38) S. Brand, PhD Thesis, Ruhr-Universität Bochum (1995)
- (39) U. Zielinsky, PhD Thesis, Ruhr-Universität Bochum (1999)
- (40) D. Albers et al., Phys. Rev. Lett. 78, 1652 (1997)
- (41) M. Schulte-Wissermann, PhD Thesis, TU Dresden (2004)
- (42) M. Abdel-Baryet al., Physics Letters B 662, 14-18 (2008)
- (43) M. Abdel-Bary et al., Phys.Lett. B 647, 351-357 (2007)
-
(44)
M. Abdel-Bary et al.,
Accepted by Eur. Phys. J. A (2010)
arXiv:1001.3043v1 [nucl-ex] - (45) J. Dietrich, Diploma Thesis, TU Dresden, 2006
- (46) M. Abdel-Bary et al., Phys. Lett. B (in print)
- (47) W.J. Fickinger et al., PR 125, 2082 (1962)
- (48) E. Byckling and K. Kajantie, Particle Kinematics, John Wiley & Sons (1973)
- (49) K. Gottfried and J. D. Jackson, Nuovo Cimento 33, 309 (1964)
- (50) G. Fäldt and C. Wilkin, Z. Phys. A357, 241 (1997)
- (51) T. M. Knasel et al., Phys. Rev. D 11, 1 (1975)
- (52) R. D. Baker et al., Nucl. Phys. B 141, 29 (1978)
- (53) F. Balestra et al., Phys. Rev. Lett. 83, 1534 (1999)
- (54) I. M. Blatt and L. C. Biedenharn, Rev. Mod. Phys. 24, 258 (1952)
- (55) T. Yamazaki et al., Phys. Rev. Lett. 104, 13250-1 (2010)
- (56) A. A. Sibirtsev et al., Eur. Phys. J. A 27, 269-285 (2006)
Appendix A Datatables
| cos | |||||||||
|---|---|---|---|---|---|---|---|---|---|
| -0.95 | — | ||||||||
| -0.85 | — | ||||||||
| -0.75 | — | ||||||||
| -0.65 | — | ||||||||
| -0.55 | — | ||||||||
| -0.45 | — | ||||||||
| -0.35 | — | ||||||||
| -0.25 | — | ||||||||
| -0.15 | — | ||||||||
| -0.05 | — | ||||||||
| 0.05 | |||||||||
| 0.15 | |||||||||
| 0.25 | |||||||||
| 0.35 | |||||||||
| 0.45 | |||||||||
| 0.55 | |||||||||
| 0.65 | |||||||||
| 0.75 | |||||||||
| 0.85 | |||||||||
| 0.95 | — | — |
| cos | |||||||||
|---|---|---|---|---|---|---|---|---|---|
| -0.90 | — | ||||||||
| -0.70 | — | ||||||||
| -0.50 | — | ||||||||
| -0.30 | — | ||||||||
| -0.10 | — | ||||||||
| 0.10 | |||||||||
| 0.30 | |||||||||
| 0.50 | |||||||||
| 0.70 | — | ||||||||
| 0.90 | — | — |
| cos | |||||||||
|---|---|---|---|---|---|---|---|---|---|
| -0.90 | — | ||||||||
| -0.70 | — | ||||||||
| -0.50 | — | ||||||||
| -0.30 | — | ||||||||
| -0.10 | — | ||||||||
| 0.10 | |||||||||
| 0.30 | |||||||||
| 0.50 | |||||||||
| 0.70 | |||||||||
| 0.90 | — |