Measuring the masses of the charged hadrons using a RICH as a precision velocity spectrometer
Abstract
The Selex experiment measured several billion charged hadron tracks with a high precision magnetic momentum spectrometer and high precision RICH velocity spectrometer. We have analyzed these data to simultaneously measure the masses of all the long lived charged hadrons and anti-hadrons from the to the using the same detector and technique. The statistical precision achievable with this data sample is more than adequate for mass measurements.
We have used these measurements to develop and understand the systematic effects in using a RICH as a precision velocity spectrometer with the goal of measuring 10 masses with precision ranging from 100 KeV for the lightest to 1000 KeV for the heaviest. This requires controlling the radius measurement of RICH rings to the level. Progress in the mass measurements and the required RICH analysis techniques developed are discussed.
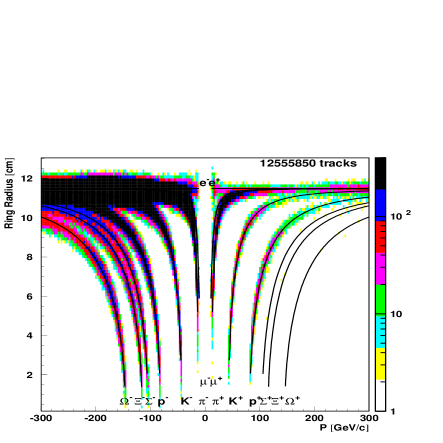
The Selex RICH was orginally conceived as a particle identifier for a fixed target multi-particle spectrometer [1]. Once we saw real data from this detector we learned that this technique had serious potential as a precision velocity spectrometer [2, 3, 4, 5]. Plots like Figure 1 [2] clearly demonstrated that precision mass measurements of many of the hadrons, at the same time with the same detectors, was possible. This paper is an exploration of the systematic limits of this technique.
Recently the MIPP experiment proposed further data taking to resolve the ppm discrepancy in the latest charged kaon x-ray mass measurements [6]. They now have the Selex RICH [7] (with instead of as a radiator) but with insufficient data to reach the ppm level of statistical precision. Selex has large amounts of data already recorded, and analysed, in a well understood apparatus. Selex events are multi-hadronic interactions, not single tracks. Nonetheless we thought it would be good to see how far we could take the idea of making precision particle mass measurements using a precision momentum (magnetic) and velocity (RICH) spectrometers. We have more than enough data to make mass measurements with statistical precsion better than the ppm level, even with very tight cuts to select clean individual track measurements.
The goals of this study are to identify the important systematic uncertainties of RICHs used a precision velocity spectrometers. Only studies with real data can fully illuminate the the systematic limitations of such precision spectrometry. It worth noting that , where is the momentum, and the relativisitic velocity, so that systematics in the magnetic momentum spectrometry are equally important: both must be in control to achieve a precision mass measurement to the ppm level.
Selex was a Fermilab fixed target experiment designed to study the production and decay of charmed baryons. It took data in in a beam with excellent vertex and momentum spectrometers. The Selex RICH, one of the first large multi-pixel PMT RICHes, provided velocity resolution for all particles above threshold (). This is well matched to the momentum resolution for tracks which reach the RICH.
The same detectors and analysis provide common systematics for all particles species. Figure 1 displays 18 particles species from a 12.5M track sample with RICH Ring Radius plotted as a function of measured track momentum. We have no sensitivity to the electron and muon masses and we can’t resolve the from the anti-. We can measure the masses of the other 10 particles.
The usual small angle and ultra-relativistic approximations [] to the Cherenkov equation [ ] is good to . The measured ring radius is related through the spherical mirror focal length () to the momentum, mass and maximum Cherenkov angle by .
Exploiting this relationship to measure mass requires three calibrations; the momentum scale, determined by reconstructing decays, the mirror focal length, which varies from across the 16 mirrors in the Selex RICH, and the maximum Cherenkov angle .
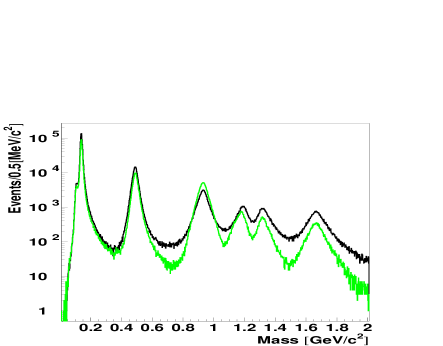
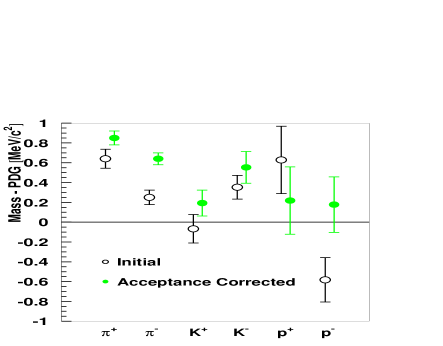
Rings are fit for the radius and center coordinates [8] from a PMT list generated around the measured track angles in the RICH cut around the predicted radius for a given mass hypothesis. At least 5 hits are required. As a clean place to start the Selex data used are low statistics, low rate, low multiplicity data with one of the two spectrometer magnets off. A mass spectrum generated after an initial calibration for tracks with ring radii in the interval () is shown in Figure 2(top). Gaussian mass fits in R bins give poor mass averages shown in Figure 2(bottom, open black points). The difference with the PDG [9] mass values are plotted. The statistical mass uncertainties are (, and ). Systematic uncertainties clearly dominate these mass measurements.
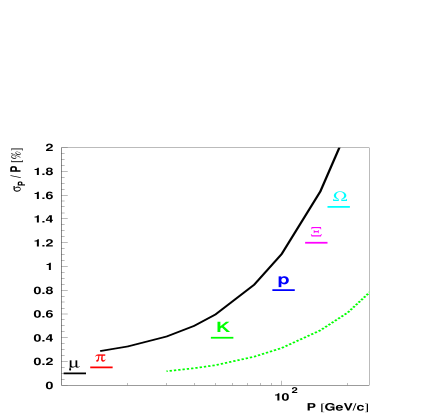
The momentum resolution is shown in Figure 3. For the data set analysed here the momentum cutoff for a track to reach the RICH is . For the Selex charm data the resolution is much better but the cutoff is , putting the pions out of reach but greatly improving the momentum resolution for the hyperons. The momentum scale was calibrated using decays and the mass from the PDG [9]. With this calibration the masses reconstructed with charged particle decays of 12 other hadrons from the through the are correctly reproduced.
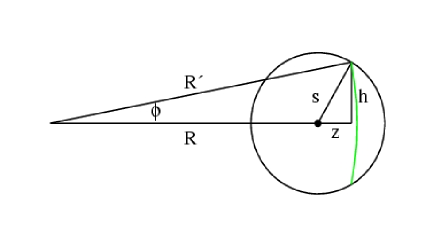
We’ve identified several systematic effects. The first is just geometry; as shown in Figure 4(top), the intersection of a circular ring with a circular tube isn’t symmetric. The acceptance correction (proportional the the arc length shown) is biased towards radii larger than the center of ring to center of tube distance. This acceptance is a just geometric. It is plotted as a function of in Figure 4(bottom) for different ring radii.
We’ve build a second ring radius fitter based on maximizing the joint likelihood for all tubes on a ring where the likelihood for each tube is from the acceptance curves shown. The average shift in ring radius is or for rings in the radius interval ( cm) we use to fit the mass.
This likelihood fitter has an interesting application in pattern recognition. The acceptance plotted goes exactly to zero at the radius difference where the ring no longer crosses the hit tube. To deal with these cases we assign a noise probability of for the minimum likelihood of any tube in the ring fit. The likelihood as a function of fit radius can have one or more maxima. Consider the case of two tubes along a ring radius: only one can fit the ring, the other being “noise” in this model. This likelihood has two maxima (if all the other tubes in the fit are well behaved). Rejecting these ambiguous fits is an objective way to remove non-Gaussian tails due to pattern recognition mistakes from the ring radius resolution function.

Repeating the mass analysis after applying cuts based on the criteria outlined above yield the mas values shown in Figure 2. The for the mass averages as a function of radius are improved but systematics in the mass as a function of ring radius remain for the pions and kaons when the calibration constants are determined using the protons.
We have made some progress. The proton and anti-proton mass now agree with each other. We used the protons for calibration so the proton mass has to agree with the PDG value. The kaon masses are close to each other and to the PDG values but still several 100 KeV and several off. The pion masses are still quite far from the PDG values for reasons which are unclear. We can and will apply these methods to the charged hyperons when the systematics are better understood.
This study is beginning to illuminate some of the systematics of the resolution of RICHs as precision velocity spectrometers. More work will be required to reach and understand the resolution limits of this technique.
We are indebted to Selex for the RICH data, our home institutions, Consejo Nacional de Ciencia y Tecnología (CONACyT), Fondo de Apoyo a la Investigación (UASLP), and the U.S. Department of Energy (contract DE-AC02-76CHO3000), for support.
References
- [1] J. Engelfried et al., “The E781 (SELEX) RICH detector,” Nucl. Instrum. Meth. A409 (1998) 439-442.
- [2] J. Engelfried, I. S. Filimonov, J. Kilmer et al., “SELEX RICH performance and physics results,” Nucl. Instrum. Meth. A502 (2003) 285-288. [hep-ex/0208046].
- [3] J. Engelfried, P. S. Cooper, A. Morelos Pineda et al., “Two RICH detectors as velocity spectrometers in the CKM Experiment,” Nucl. Instrum. Meth. A502 (2003) 62-66. [hep-ex/0209020].
- [4] P. S. Cooper et al., “Redesign of the CKM RICH velocity spectrometers for use in a 1/4 GHz unseparated beam,” Nucl. Instrum. Meth. A553 (2005) 220-224.
- [5] A. Morelos Pineda, J. Mata, P. S. Cooper et al., “Radial tail resolution in the SELEX RICH,” Nucl. Instrum. Meth. A553 (2005) 237-241.
- [6] N. Graf et al., “Charged Kaon Mass Measurement using the Cherenkov Effect,” Nucl. Instrum. Meth. A 615, 27 (2010) [arXiv:0909.0971 [hep-ex]].
- [7] J. Engelfried et al., “The SELEX phototube RICH detector,” Nucl. Instrum. Meth. A 431, 53 (1999) [arXiv:hep-ex/9811001].
- [8] J.F. Crawford, “A Non-Iterative Method for Fitting Circualr Arcs to Measured Points,” Nucl. Instrum. Meth. A 211, 223 (1983).
- [9] K. Nakamura et al. (Particle Data Group), Journal of Physics G 37, 075021 (2010).