A spectropolarimetric view on the nature of the peculiar Type I SN 2005hk111Based on observations made with ESO Telescopes at the Paranal Observatory, under program 076.D-0178(A).
Abstract
We report two spectropolarimetric observations of SN 2005hk, which is a close copy of the “very peculiar” SN 2002cx, showing low peak luminosity, slow decline, high ionization near peak and an unusually low expansion velocity of only about 7,000 . Further to the data presented by Chornock et al., (2006), at -4 days before maximum, we present data of this object taken on 9 November 2005 (near maximum) and 23 November (+ two weeks) that show the continuum and most of the spectral lines to be polarized at levels of about 0.2-0.3%. At both epochs the data corresponds to the Spectropolarimetric Type D1. The general low level of line polarization suggests that the line forming regions for most species observed in the spectrum have a similar shape to that of the photosphere, which deviates from a spherical symmetry by . In comparison with spectropolarimetry of Type Ia and Core-collapse SNe at similar epochs, we find that the properties of SN 2005hk are most similar to those of Type Ia SNe. In particular, we find the low levels of continuum and line polarization to indicate that the explosion mechanism is approximately spherical, with homogeneous ejecta (unlike the chemically segregated ejecta of CCSNe). We discuss the possibility that SN 2005hk was the result of the pure deflagration of a white dwarf and note the issues concerning this interpretation.
Subject headings:
supernovae – spectropolarimetry1. Introduction
The nature of the complex explosion mechanisms thought to be behind
Supernovae (SNe), of all types, is expected to leave a signature in
the resulting geometry of the explosion. The study of the polarized
light arising from SN explosions provides a unique and powerful method
for directly measuring asymmetries in SNe. The power of
spectropolarimetry is demonstrated by its application to the study of
the shapes of SNe at large distances, providing an effective spatial
resolution far superior to any current or currently planned imaging
technique (see Wang & Wheeler 2008, for a review).
In SN photospheres, the predominant form of opacity is due to electron
scattering, which is also a polarizing process. In a spherical
symmetry, light originating from different quadrants of the
photosphere have opposite but equal polarization components, leading
to a zero net observed polarization. In the presence of asymmetries,
the cancellation of the polarization components arising from different
portions of the ejecta is incomplete, leading to an observable
polarization whose magnitude is related to the degree of the
asymmetry. In addition to the polarization of continuum light, the
absorption due to line forming species exterior to the photosphere
“cast shadows” on the photosphere. If the photosphere is not
completely covered, a polarization signature will be associated with
wavelength-dependent absorption features, with the degree of
polarization related to the amount and orientation of the coverage of
the photosphere by the line forming region.
Previous polarimetric studies of SNe have shown that Type Ia SNe and
Core-collapse Supernovae (CCSNe) have different polarization
properties. Type Ia SNe are observed to have generally low
polarizations, indicative of a close-to-spherical symmetry. The
degree of polarization of these events decreases with time, as deeper
layers of ejecta are revealed, implying the ionization/ density structure becomes more
spherically symmetric with depth. In contrast, CCSNe have been
observed with a wide variety of polarizations, generally larger than
those observed for Type Ia SNe. In addition, the degree of
polarization is observed to increase with time for CCSNe, suggesting
the ejecta become more asymmetric at increasing depth.
In the classical observing modes of photometry and spectroscopy, Type
Ia SNe at certain phases can be confused upon casual inspection with Type
Ic SNe at other phases due to the common display of Fe II
lines. Special care must be given when trying to determine the type
and the physics of “peculiar” Type Ia and “peculiar” Type Ic SNe.
The application of spectropolarimetry can provide additional
constraints, both in the abstract sense of the Stokes parameters and
in the inferred geometries, that can help separate events belonging to
the different distinct classifications.
One particular class of SNe, which have been previously classified as
Type Ia SNe (albeit “the most peculiar Type Ia”;
Li et al. 2003), are the so-called “2002cx-like” SNe.
It has recently been suggested that members of this class may be
representative of Type Ia SN events that result from a
pure-deflagration (see Branch et al. 2004, and references
therein)
or instead may be peculiar, low-luminosity Type Ic SNe (Foley et al. 2009; Valenti et al. 2009).
Here we report two epochs of spectropolarimetry of the 2002cx-like
SN 2005hk, acquired at approximately maximum light and two weeks later
using the Very Large Telescope (VLT) of the European Southern
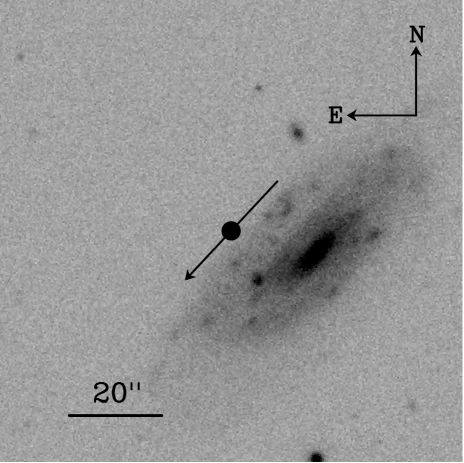
Observatory (ESO). SN 2005hk was discovered in UGC 272 by
Burket & Li (2005). The location of SN 2005hk, relative to
its host galaxy, is shown as Fig. 1. Early
spectroscopy was presented by Jha et al. (2006),
Chornock et al. (2006), Phillips et al. (2007) and Sahu et al. (2008). They
identify the early high ionization (e.g. Fe III) species typical
of SN 2002cx-like SNe, as well as the bright Type Ia SN 1991T (see
also Serduke et al. 2005), and the low velocities characteristic of SN 2002cx
( 6000 ). The spectra of Jha et al.
and Chornock et al. showed intermediate-mass elements
with weaker features than regular SNe Ia, but stronger than SN 1991T.
Chornock et al. suggested that Ni and Co may be
present in the early spectra and hence in the outermost layers of the
ejecta. The red portions of the spectra show appreciable features of
O I and Mg II between 7500 and 9000Å, whereas SN 1991T, a
possible analog, showed a basically featureless spectrum in that phase
and wavelength range. Both SN 2002cx and SN 2005hk showed similar fine
scale structure suggesting that the structure was systematic and hence
not the product of random clumping in the ejecta of either
event. Phillips et al. (2007) present extensive u’g’r’i’BVRIJHK photometry and optical spectroscopy of SN 2005hk,
including the spectral data of Jha et al. and
Chornock et al.. Importantly, they note that the
light curves of these two events are very similar, with neither
showing the typical secondary maxima in R and I displayed by normal
SNe Ia, but light curves that are also distinctly different than
under-luminous SNe Ia such as SN 1991bg. In addition, the bolometric
light curve, including Swift UV data, shows a
rather slow light curve (; Phillips et al. 2007), uncharacteristic of under-luminous SN Ia and similar to normal Type Ia SNe over a magnitude brighter at maximum.
Chornock et al. (2006) presented spectropolarimetry of SN 2005hk,
at 4 days prior to our first observation. They determined that the
continuum was polarized in the red, with the data
represented by a dominant axis. They also identified a weak modulation
of the polarization of the Fe III
line at .
In Section 2 we present our spectropolarimetric
observations and our adopted reduction procedure. The results from
these observations are presented in §3 and these
results are discussed in
§4. In §5 we present our conclusions.
2. Observations
Spectropolarimetry of SN 2005hk was acquired using the ESO-VLT on 2005
Nov 9 and 23, with the FORS1 instrument in polarization PMOS mode. A
log of these observations is presented in Table 1. The
data were reduced following the scheme outlined in Maund et al. (2007a).
At each epoch, the observations consisted of four exposures with the
half-wavelength retarder plate positioned at four position angles
, , , and , to derive the two
linear Stokes parameters and 111We adopt the notation of
Wang & Wheeler (2008), where the normalized Stokes
parameters are given by and .. Both observations
were conducted with the 300V grism, without an order separation
filter, providing a spectral resolution of as measured from
arc line calibration data. Telluric lines were removed from flux
spectra in the standard manner. Flux standard stars were observed,
with the full polarimetry optics in place, to calibrate the flux
levels of the SN data and remove telluric features. The telluric
features are not expected to affect the polarimetry, except to
decrease the level of signal-to-noise across the absorption, provided
there is no significant change in the strength of absorptions between
exposures with the retarder plate rotated by .
The instrumental stability between the observations at the two epochs
was assessed by calculating the difference between the instrumental
signature corrections and (Maund 2008). At both epochs the
difference was found to be , implying a limit on the
instrumental stability and the measurement of the Stokes parameters to
. This is consistent with previous reported measurements of
the instrumental signature corrections and limits on stability of the
VLT FORS instrument (Maund et al. 2009).
The degree of polarization was corrected for biases due to
observational noise using the equations derived in
Wang et al. (1997), and, additionally, using a Monte Carlo
simulation of the FORS1 instruments in the manner of
Patat & Romaniello (2006) and Maund (2008). The
wavelength scales were corrected for the heliocentric recessional
velocity of the host galaxy of 3895
.222http://nedwww.ipac.caltech.edu/
3. Observational Results
3.1. The Distinguishing Spectral Features
The spectroscopic properties of SN 2005hk have already been described
in some detail in other works
(Chornock et al. 2006; Phillips et al. 2007). Here the prominent
spectroscopic features, which characterise SN 2005hk at the epochs at
which spectropolarimetry was acquired, will be briefly reviewed to
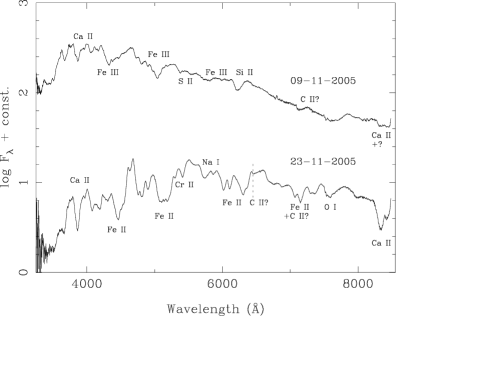
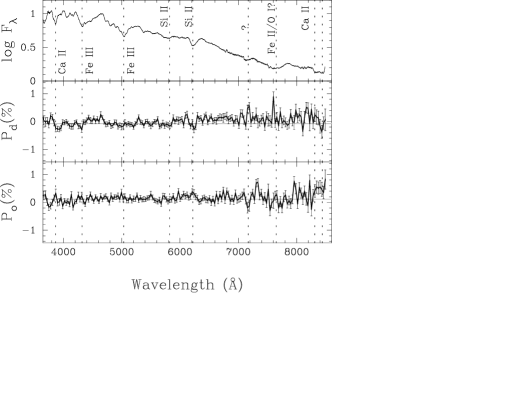
orient the reader. The flux spectra from our two spectropolarimetric observations are presented as Fig. 2.
Our data from 2005 November 9 are interleaved with the coverage presented by
Phillips et al. (2007) who give spectra from 7 and 14 November
that they assign to -3 and +4 days with respect to B maximum which
they determine to be JD2,453,685.1. This means our data are from very
near B maximum, perhaps a day earlier. We confirm that the spectral
features are very similar to those of SN 2002cx at the same epoch
(Li et al. 2003). Furthermore, Chornock et al. (2006)
acquired a flux spectrum of SN 2005hk in the course of acquiring
spectropolarimetry at November 5.4, 4 days prior to our first
observation. Chornock et al. performed line
identifications using the SYNOW333http://www.nhn.ou.edu/ parrent/synow.html code for their spectrum. They found
that the strongest lines were from Fe III with other lines of
intermediate mass elements being present, but relatively weaker. They
obtained a better fit in the blue by adding lines of Ni II,
Co II, Ti II and C III. They used an excitation
temperature of 10,000 K for the low-ionization stage elements and
15,000 K for the higher ionization stages, Fe III and
Si III. Our flux spectrum from the 2005 November 09 observation,
despite being acquired 4 days later, requires similar identifications
to those made by Chornock et al.. In the red portion
of the spectrum, we identify the Ca II IR triplet, although the
synthetic spectra of Chornock et al. suggested that
at the epoch of their observations this was mostly due to O I
and Mg II. The feature at is identified by
Phillips et al. (2007) as Fe II, while
Chornock et al. (2006) suggested it was a mixture of O I
and Mg II. Li et al. (2003) observed the appearance
of O I after maximum in spectra of SN 2002cx,
which suggests that at 0 days for SN 2005hk this feature could be
at least partially due to O I.
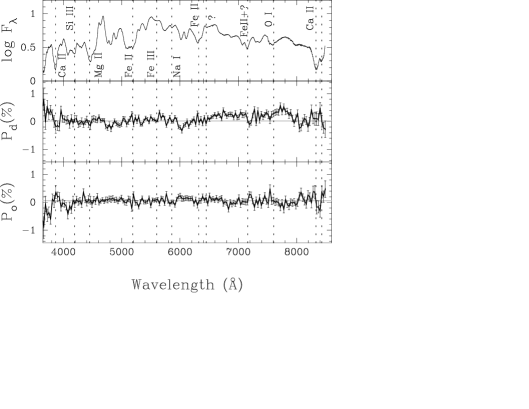
Our spectrum from 2005 November 23 corresponds to an epoch two weeks
after B maximum. Our data are very similar to spectra of that date
presented by Phillips et al. (2007), but our data have higher
signal to noise and broader wavelength coverage. The spectrum of Phillips et al. 2007 from November 25
(+15 days) has similar wavelength coverage to ours of November 23 and
remains very similar to our flux spectrum. At this epoch, the
underlying continuum is cooler with a relative paucity of flux in the
blue compared to the spectrum of 9 November. The spectrum is
characterized by the growth in amplitude of small scale features.
SYNOW was used by us, in conjunction with previously published line
identifications, to determine line identifications specific to the
spectrum at this epoch. The degree of blending of multiple lines is
lower at the second epoch, due to the relative decrease in the
expansion velocity. The truncation of the red-side of the
O I emission line profile at may be evidence for Mg II,
but it is located close to strong telluric absorption features. The
identification of Si II at +14 days is debatable,
and is likely to be due to an increase in Fe II (Li et al. 2003). Branch et al. (2004)
similarly found that Si II was no longer required to fit spectra
of SN 2002cx at a similar epoch. The photospheric velocity was
estimated, using lines of Fe II(42), to be .
At the second epoch, there are also two distinct absorption features
that are likely to be caused by the Ca II IR triplet. The
Ca II IR triplet was identified at 12 days after maximum in the
spectrum of SN 2002cx (Branch et al. 2004). The two features
might be due to partially resolving the triplet in this low velocity
photosphere ( ), or there could be two kinematically separate components
such as those observed in normal Type Ia SNe
(Mazzali et al. 2005). If the latter, the absorption minima
correspond to velocities of and , respectively, taking
the mean wavelength of the Ca II blend to be 8579Å. The bluer
of these two components is moving somewhat more rapidly than the
typical range identified for photospheric features for Type Ia SNe at
similar epochs (Mazzali et al. 2005). Comparison with SN 2002cx
at 12 days (Branch et al. 2004) leads to the identification of
the strong absorption observed at 5730Å as Na I intrinsic
to the SN, corresponding to a velocity of (which is
similar to the high velocity Ca II feature).
At the first epoch, there is a feature at . Chornock et al. (2006) argue it is unlikely to be due to
C II due to absence of other stronger lines that should occur in
the wavelength range of these observations (e.g. ).
Rather Sahu et al. (2008) suggests the may arise
from Fe II . Branch et al. (2004) could not identify C I features in
spectra of SN 2002cx. At the second epoch, however, there is a suggestion of
an absorption (blended with an Fe II line giving rise to a flat
topped emission line profile for that line) which is consistent with
the expected position of C II with a velocity of
(similar to the low velocity component of Ca II).
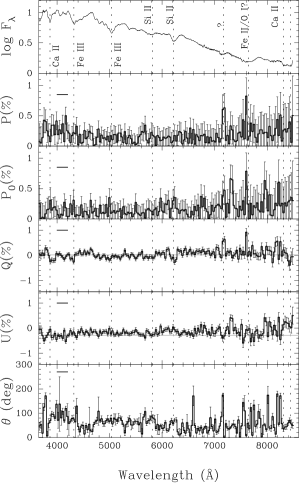
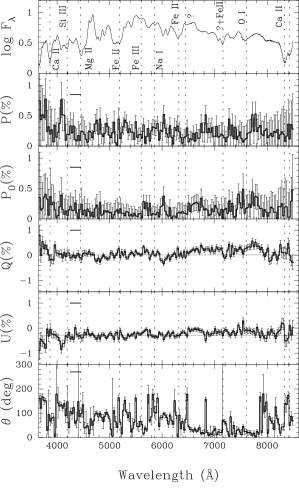
3.2. The Polarization of SN 2005hk
Spectropolarimetry of SN 2005hk at the two epochs is presented in Figs. 3 and 4.
The correct measurement of the intrinsic polarization of SNe requires
the subtraction of the polarization contribution of the interstellar
medium, both in the Galaxy and in the host. In the first instance, a
general limit can be placed on the degree of the Interstellar
Polarization (ISP) by the amount of reddening measured towards SN
2005hk. For Galactic-type dust the maximum degree of the ISP is
related to the reddening by the limit
(Serkowski et al. 1975). The degree of Galactic foreground
reddening in the direction of SN 2005hk has been reported to be
(Schlegel et al. 1998). The limit on ISP arising in the foreground is .
The reddening towards SN 2005hk can be estimated, if we assume that the narrow Na I D absorption component
arises in the interstellar medium (ISM) of the host. The equivalent width of the Na I D absorption
feature at the first epoch was measured to be
. This value is smaller than the value
reported by Chornock et al. (2006), for observations 4 days prior
to our first observations, although the difference between the two
measured values is . We note
Chornock et al. do not quote errors on their
determined equivalent width. It is not clear if this difference is
within the measurement errors or if it reflects evolution triggered by the SN (Patat et al. 2007). We
follow Chornock et al. (2006), who adopt the results of
Munari & Zwitter (1997) for evaluating the relationship between
Na ID absorption and the reddening. This relationship is based
on Galactic-type extinction laws (e.g. Cardelli et al. 1989). It is,
therefore, implicitly assumed that the reddening component, measured
from the narrow Na I absorption component in the host galaxy,
follows a similar law. As the Na I D component lines are not
resolved in our data, we also adopt a range of flux ratios between
Na I D1 and D2 of 1.1 to 2 (Chornock et al. 2006). This
limits the reddening of the host to . The total
reddening, for Galactic type reddening and ISP law, yields a
constraint on the total
ISP of .
Howell et al. (2001) present a technique for the determination
of the ISP for specific wavelength ranges which have null intrinsic
polarization. This assumes that, for
these specific wavelength ranges, there is sufficient overlap between
groups of lines such that there is complete intrinsic depolarization
over these wavelengths. Howell et al. suggest that
the wavelength region of 4800-5600Å is intrinsically
depolarized, where line blanketing opacity dominates over electron
scattering opacity. Any polarization, observed over this wavelength
range, is expected to be due to the ISP alone. For SN 2005hk, at both
epochs, the lack of significant overlap and blending of lines leads to
the complex behaviour of the Stokes parameters.
Chornock et al. (2006) find that the wavelength range of
4000-4200Å satisfies the criteria for intrinsic depolarization,
namely significant line blanketing. The observation of
Chornock et al. at November 5.4 is sufficiently close
to our observation at the first epoch that we observed similar
features in the polarization spectrum and the Stokes parameter
spectra. Importantly, we too determine that this wavelength range
provides the best approximation to a line blanketed regime. The
measured Stokes parameters across this range at the first epoch are
and . The
uncertainties on these quantities are the combined systematic and
statistical uncertainties.
The spectral evolution of SN 2005hk by the second epoch, with the
increase in the strengths of individual Mg II and Fe III lines in the
range of 4000-4200Å, leads to the presence of intrinsic polarization
( and
). Instead, we identify the region of
4250-4450Å as being spectroscopically similar to a line blanketed
regime with no unblended line structure. Over this wavelength range
the average values of the Stokes parameters are measured as
and . The
measured Stokes parameters, over the depolarized wavelength range,
agree with those determined at the first epoch.
We adopt values of the ISP Stokes parameters of
and , for both the
Galactic and host ISP components, which are
approximately consistent with the values measured by
Chornock et al. (who calculate separate Galactic and host components). The value of the ISP relative to
the observed Stokes parameters is shown on Figs. 3 and 4. These values correspond to a
polarization of with an angle of
. The orientation of the ISP component is
shown on Fig. 1. As previously observed for
other SNe (Maund et al. 2007b; Patat et al. 2009, 2010), the ISP component is aligned
with the spiral arm pattern at the SN location, due to alignment of
magnetic field lines and, hence, dust grains along
spiral arms (Scarrott et al. 1987).
Given the limited wavelength range over which it can be determined, it
is not clear if and how the ISP component varies with wavelength.
Although a standard Serkowski-type law could be applied, it is unclear
what the appropriate values of and would be.
Furthermore, it has been observed for a number of SNe with significant
ISPs that the ISP does not necessarily even follow a Galactic-Serkowski
type law of wavelength dependence (e.g. SN2006X; Patat et al. 2009). Given
the small value of the ISP, we subtract, therefore, a constant ISP
component from the observed data, to recover the intrinsic
polarization of the SN (as shown by in
Figs. 3 and
4), under the assumption that any wavelength
dependence of the ISP is smaller than the uncertainties derived above.
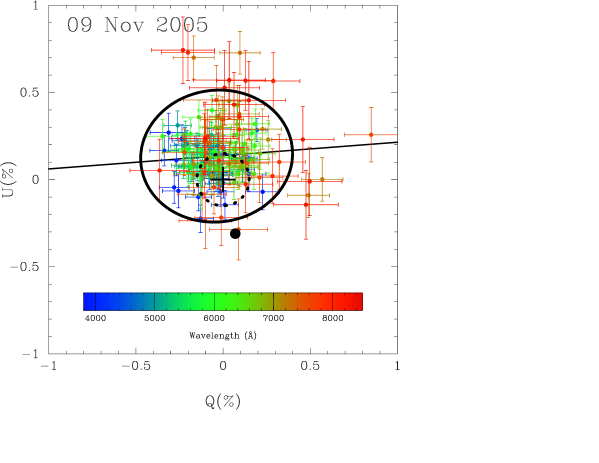
On the Stokes plane (see Figs. 5 and
6), the ISP component is located close to the centroid of the SN 2005hk data. The calculated weighted centroids for the ISP-corrected data are listed in Table 3.
After correction for the ISP, the intrinsic polarization of SN 2005hk
is observed to be extremely low across the observed wavelength range.
The degree of polarization of a number of features observed to be
relatively strongly polarized in the uncorrected polarization spectrum,
are no longer as polarized once the data have been corrected for the
ISP. Utilising the data across the range as
representative of a region of pure continuum emission, the level of
the continuum polarization is measured as and
at the first and second epochs, respectively. At the
second epoch the assumption that this wavelength range represents a
true continuum region is most likely invalid, due to the presence of a
number of minor, broad undulations which are most likely due to the
lines (rather than incorrect flatfielding of the flux spectrum). This
wavelength range avoids any polarization associated with the feature
at , and is less than the continuum polarization measured by
Chornock et al. (2006) at 2005 Nov 5.4 of . This level of
polarization is consistent with a spheroidal configuration
with axial ratio (Höflich 1991).
The significance of the polarization signal is given by (Patat & Romaniello 2006). At both
epochs there are no features, at either or binning,
which are detected in the intrinsic polarization spectrum at
and only a small number of bins detected at .
Chornock et al. (2006) argue that in their data from 5 November,
only the line of Fe III is polarized and at a
rather small level. On inspection, their data suggest that Fe III
is also somewhat polarized. There is another feature
of similar amplitude showing a minimum at in the
polarized flux that has no strong component in the total flux
spectrum, but is likely to correspond to Si II .
Our data at the first
epoch also show possible modulation in the polarization spectrum
associated with Fe III , as well as Si II and
the feature. At redder wavelengths there are a number of
peaks which are associated with telluric features, suggesting that
these were variable over the course of the observations. The apparent
significance of these features is therefore overestimated, as the
possible variability of telluric features was not considered in the
reduction process and not accounted for in the final error analysis.
By the second epoch, there are possible peaks in the intrinsic polarization associated
with the absorptions of the Fe II multiplet 42, the intrinsic
Na I feature and the absorption of Fe II .
The absence of a significant signal in the polarization spectrum does
not necessarily imply that the intrinsic polarization of spectral
features is also not significant. Wang et al. (1997) and
Leonard et al. (2002) studied the change in polarization across particular spectral features, by comparing the modulation in
the Stokes and parameters from the approximate “continuum”
level and at the wavelength of absorption minimum, where:
| (1) |
is independent of the choice of the ISP component. The values of for particular spectral features, at both epochs, are presented in Table 2.
Even when assessed by modulation of the Stokes parameters, the data at
both epochs show few significant features. At the first epoch,
Ca II H&K, Fe II and, importantly, Si II show significant modulation, whereas at the second epoch the
significant modulation is associated with the, now stronger,
Fe II lines. The interpretation of the data presented in Table
2 requires some caution, however, as the selection of
and , by eye, can lead to a bias in
favour of selecting those wavelengths that yield the maximum change in
the Stokes parameters.
The principal differences between the data presented by Chornock et al. at -4 days, compared to our data at 0 days, is due to much larger S/N achieved in their observation. We estimate that at , at 50Å binning, Chornock et al. achieved a final , whereas our observation reached .
At the first epoch, two sets of two contiguous bins (at 30Å) are
observed at both the 7200Å feature and immediately redward at
7315Å. An obvious line feature is associated with the
former spectral line in the flux spectrum. The latter feature
corresponds to a telluric feature that, although it should be equally
cancelled between the two beams at each retarder plate position, may
appear polarized due to variability in
the telluric line between the pair of observations used to derive each
Stokes parameter.
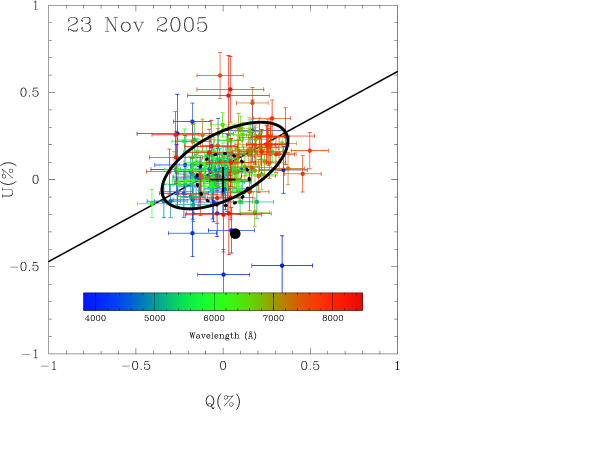
On the Stokes plane (see Figs. 5 and
6), the data at both epochs assume an approximate
elliptical distribution, with no major structure deviating from the
main concentration of points. At the first epoch, the data have no
obvious preferred direction. By the second epoch the data are more
extended across the plane, although again with no major
deviations from the main concentration of data points. From
Fig. 6 it is also evident that, by the second
epoch, the degree of polarization has become more wavelength
dependent, with data at bluer wavelengths being concentrated at lower values
of and than the data at the red extreme of the observed
wavelength range. Our lower data does not show the wavelength
dependent elongation to the same degree as observed at -4 days, for
which a dominant axis is clear to the eye. The behaviour of the data
on the Stokes plane, at both epochs, is quantified and discussed
in Section 3.3.
3.3. Decomposition of the Stokes parameters
The determination of the dominant axis, and the decomposition of the
Stokes vector, permits a correction for the random position angle at
which target SNe have been observed, as well as determination of the
principal axis of symmetry of the data, the relative orientations of
the different line forming species and, ultimately, the underlying
geometry. The dominant axis forms a line across the Stokes
plane, and the decomposition process involves rotating the data so
that the principal rotated Stokes axis is aligned with the axis of
greatest variance for the data on the Stokes plane. The polarization signal is measured in the two orthogonal directions, which are
effectively the “rotated Stokes parameters”, along the dominant axis
() and along the orthogonal axis (). A polarization
component in the orthogonal direction permits the identification of
deviations from the single axial
symmetry represented by the dominant axis.
Here we explore two complementary techniques for determining the
dominant axis: least-squares fitting of a straight line and a
principal components analysis of the data on the Stokes plane.
Importantly, these two different analyses should give identical
measures of the dominant axis, but provide different parametrisation
of the data on the Stokes plane. This latter point is
particularly crucial for applying the SN spectropolarimetric
classification scheme of Wang & Wheeler (2008).
3.3.1 Least-squares fit to the data
Straight lines, of the form , were fit to the data
of both epochs, using a weighted least-squares fitting technique,
where the data were weighted according to the errors in both and
(Press et al. 1992). In order to confirm the validity of
this technique, the form of the straight line was reversed and the best fit was calculated
for , giving identical results. The value of yields the
angle of the dominant axis with respect to the Stokes -axis,
through which the data are to be rotated to decompose the Stokes
vector onto the dominant and orthogonal axes. For a single axial
symmetry, the dominant axis will pass through the origin of the Stokes
plane. In instances where the data are offset from the origin
(e.g. by a wavelength-independent continuum polarization component)
the offset will be partially manifested in the
measured parameter.
Dominant axes were calculated for the data at both epochs over two
different wavelength ranges: 3700 to 8600Å and 4000-7000Å. The
former range wavelength encompasses the entire wavelength range of the
observed data, whereas the latter excludes regimes with poor levels of
signal-to-noise (). The regions of low signal-to-noise
arise at the blue and red extremes of the data, due to line-blanketing
and the blue spectral energy distribution significantly reducing the
observed flux in the blue and red,
respectively, and the declining detector response (in the red).
The results of the least-squares analysis and the properties of the
determined dominant axes are presented in Table 3.
The values of , , and the polarization angle of the
dominant axis () were found to
be relatively insensitive, within the uncertainties, to the choice of
the wavelength range over which the dominant axis was calculated. The
dominant axes are shown on the Stokes plane on
Figs. 5
and 6. The large values of for the
straight line fit, at both epochs, indicate that the data are poorly
described by a straight line, with a significant polarization
component in the orthogonal direction. At the first epoch, simple
inspection of the data on the Stokes plane would suggest that
the data are evenly distributed in angle about the centroid (as is
illustrated in Section 3.3.2). At the second epoch, a
dominant axis is more clearly observed.
3.3.2 Principal Components Analysis
In order to better understand and quantify the distribution of the
data on the Stokes plane and, in particular, the degree of the orthogonal polarization component, a principal component analysis of the
data was conducted.
The elements of the covariance matrix take the form:
| (2) |
where , ,
(see Bevington & Robinson 2003), and the weighted average of the
Stokes parameters are , as shown in Table
3, over the wavelength bins. The eigenvectors
and eigenvalues of the covariance matrix provide an alternative measure
of the angles of the dominant and orthogonal axes () and
the ratio of the
degrees of polarization in the dominant and orthogonal directions (an axial ratio for the resulting ellipse ), respectively. This latter quantity can be used to describe an ellipse on the Stokes plane which contains the data. The results of the principal component analysis are presented in Table 3, and corresponding ellipses are presented on Figs. 5 and 6. As expected, the polarization angle of the dominant axis determined using this analysis agrees, within the uncertainties, with the result from the least-squares fit.
The non-zero values of determined from the principal components
analysis show that the data at the two epochs are inconsistent with both
straight lines and null polarization. This suggests that, although the polarization
measured at both epochs is low, we have measured a real polarization
signal for SN 2005hk. The ratio of the dominant and orthogonal
components measured at the second epoch is smaller than
that measured at the first, implying that at the first epoch the
ejecta were approximately round and, with time, departed more
significantly from the spherical symmetry.
This interpretation requires some caution, however, as
Chornock et al. observed data that corresponded to a
dominant axis four days prior to our first observation, which we do
not see in our data at the first epoch. This may reflect the low
of our first observation, rather than an “oscillating”
evolution in shape of the structure
of the ejecta; with the ejecta appearing approximately spherical at
maximum but departing from a spherical symmetry both before and after
maximum light.
3.3.3 The data on the dominant and orthogonal axes
The data were rotated onto the dominant and orthogonal axes, using the
angles determined from the least-squares fit analysis (for the limited
wavelength range of 4000-7000Å). The rotated data are presented as
Figs. 7 and 8. Despite the apparent
increase in the polarization angle from the first to second epochs,
the determined polarization angles for the dominant axes are different
from the angle measured at -4 days, for which
Chornock et al. determined
.
At the first epoch, the dominant and orthogonal polarization
components are similar to Stokes and , due to the small angle
through which the data were rotated. The polarization modulations
associated with Ca II, Fe III, Si II are
predominantly
observed in the dominant polarization component, and over the range
4000-7000Å the deviations observed in the orthogonal polarization
spectrum are consistent with the expected noise level. Similar to the
Chornock et al. observations at -4 days, an important
exception is the 7200Å absorption feature (and possibly Fe III
) which has both dominant and orthogonal polarization
components (although Chornock et al. refer to the
rotated Stokes parameters and , these are
equivalent to our dominant and orthogonal axes). At our second epoch,
the majority of features, associated with Fe II, Na I
and, particularly, the feature show some
modulation in both the dominant and orthogonal polarization components. While
Chornock et al. observed an obvious wavelength
dependence in the dominant polarization component, with increasing
at redder wavelengths (which we estimate to be ), 4 days later we found the wavelength
dependence to be shallower .
At days we measure a similar wavelength dependence . This wavelength dependence is clearly
seen on Fig. 6. The change may not be evidence
for evolution in the wavelength dependence of the dominant
polarization component, in itself, as the observations of
Chornock et al. were acquired with higher .
Such wavelength dependence of the polarization, increasing at redder
wavelengths was observed for SN 1999by (Howell et al. 2001).
At the temperatures determined for SN 2005hk, and for Fe-rich matter,
the opacity at the photosphere is dominated by blends of line transitions for
(see Fig. 2 of Höflich et al. 1993). At
redder wavelengths, the opacity is primarily due to electron
scattering. The continuum polarization may indicate an aspherical
Thomson scattering region, e.g. by a global asymmetry induced by the
rotation of the White Dwarf progenitor (Howell et al. 2001) or
off-center delayed detonations (Höflich et al. 2006).
Because multiple line scatterings are effectively
depolarizing, the observation of increasing polarization with
wavelength may be understood in terms of the decrease of the role of line opacity
at redder wavelengths. If the dominant axis corresponds to a principal axial
symmetry, then the line forming regions of the species observed in the
flux spectrum follow the same axial symmetry as that of the continuum
at the first epoch, but not at the second epoch.
3.4. The Inferred Ejecta Geometry
On the basis of the continuum polarizations measured at 0 and 14 days,
any asymmetry in the shape of the photosphere (assuming a spheroidal
configuration) requires an axial ratio
(Höflich 1991). A similar limit on the asphericity of
the photosphere is achieved if one uses the higher value of continuum
polarization () determined by
Chornock et al.
The general level of line polarization is low, suggesting that the
line forming regions cover an approximately spherically symmetric
photosphere homogeneously. Limits on the amount of polarization
expected to be observed can be calculated, given a level of continuum polarization and
line depth, under the assumption that the line forming region blocks only
unpolarized light from the photosphere, while not blocking
polarized light arising from the limb (i.e. that the photosphere can be
separated into discrete polarized and unpolarized zones):
| (3) |
where and are the observed fluxes in the
continuum and in the absorption line minimum, respectively (i.e. such
that the line depth is - this convention is
chosen as the observed polarization arises from the light that is not absorbed). As Chornock et al. (2006) calculated for their observation of SN 2005hk, we also calculate the theoretical limits on the line polarization for measured absorption line depths in our observations.
At the first epoch, the maximum polarization for the Si II
line is only 0.14%. As
Chornock et al. suggest, that the lines are not
strongly polarized is commensurate with their apparent weakness. This
is true at the first epoch, where line strengths of only are
observed. At the second epoch, however, absorption line depths of
are observed, and with the increase in depth of these
lines it might be expected that, should the line forming regions be
asymmetric, that there would also be a commensurate increase in the
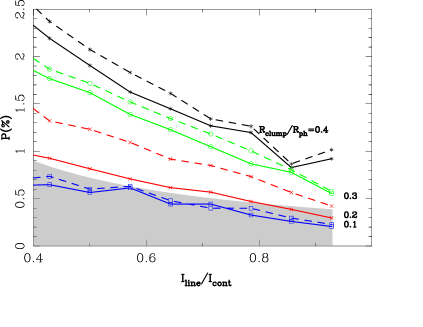
polarization observed across these lines (see Fig. 9).
Eqn. 3 assumes that all of the polarization is due to the continuum, which implicitly assumes that the photosphere itself is asymmetric.
In a number of cases, in particular for core-collapse SNe, the
classical limit for line polarization is exceeded (see
e.g. Maund et al. 2007a, 2009), for low values of continuum
polarization which suggest approximately spherical photospheres.
Violations of this criterion can be explained by large scale structure,
with a dissimilar geometry to that of the photosphere, or clumping,
which may produce polarization irrespective of the shape of the
photosphere or the degree of continuum polarization. The degree of
observed polarization, for a clumpy line forming region, should depend
on the size of the clumps: for a given line absorption depth, fewer larger clumps block larger areas
with contiguous polarization vectors, whereas more smaller clumps can
be distributed more evenly across the photosphere.
In order to explore the possible role of clumping, and the expectation
for the production of polarization across shallow lines, a Monte-Carlo
toy model of a simple photosphere and obscuring clumped line forming
region was constructed following the scheme of
Wang et al. (2007). A circular continuum emitting
photosphere was adopted, with the luminosity as a function of
projected radius across a photosphere of radius set to:
| (4) |
with limb darkening modelled using the coefficient , which for
yields no limb darkening. For a three-dimensional spherical
photosphere, this would correspond to to a limb darkening law of
. The radial dependence of the polarization was
assumed to follow a quadratic form ,
with the constant of proportionality chosen to yield 15% polarization
for light emitted at the limb of the photosphere
(Chandrasekhar 1960). Opaque circular clumps were assumed, with
, such that all photospheric flux from the region
underlying the clump was blocked. For each iteration of the model,
clumps of size were randomly positioned across
the photosphere and the corresponding flux of the uncovered regions,
and their polarization components, were summed. Clumps were permitted
to overlap and only partially cover the photosphere. For each size of clumps, 3000 simulations were conducted.
This permits a comparison of the expected polarization for a given
absorption line depth, assuming a particular clump size in the line
forming region. The results of this model (for , ,
and ) are shown as Fig. 9.
For some of the models, zero polarization was achieved for uniform
coverage of the photosphere by the clumps, however the difference
between the average polarizations expected (as shown in
Fig. 9) and null polarization was for all
the calculated models. These models suggest that, for a clumpy line
forming region, the clump scale for SN 2005hk is very small () to produce lines of the depths observed, in the flux
spectra at both epochs, with low polarization. The uniformly low
polarization observed for lines arising from different species suggest
that the ejecta are generally mixed, with no separate structures on the plane of the sky for different elements or ionization
stages(e.g Fe II and Fe III). The element responsible for
the absorption at 7200Å may be an exception, with a line
forming region that is more aspherical than other species. The data for
SN 2005hk, at the two epochs presented here and those presented by
Chornock et al. (2006), are consistent with an approximately
spherical symmetric photosphere surrounded by similar line forming
regions for all species.
The principal assumption of the model presented above is that the line
forming region and the photosphere are separate. As discussed in
§3.3.3, the opacity at the photosphere (where the
quasi-continuum forms) is not due to electron scattering alone, but
rather includes a significant wavelength dependent contribution from
atomic transitions; this implies that line forming regions are not, in
reality, separate entities except in the most high-velocity regions
such as those discussed by Kasen et al. (2003).
The size of the clumps and their relation to
”large-scale” structure within the ejecta, leads to an interesting
problem of semantics: since very large clumps ()
may be considered large scale structure and very small clumps
() tend towards constituting an effectively
homogeneous medium. Large opacities require that a large fraction of
the photosphere, the last Thomson scattering distance, are reprocessed
by lines, mostly due to iron-group elements (which will result in a
significantly altered spectrum).
4. Discussion
4.1. SN 2005hk as a Type Ia SN
The class of SNe similar to SN 2002cx currently has 15 members,
including 2005hk and 2008ha (Foley et al. 2009). As discussed
in detail by Li et al. (2003) and
Phillips et al. (2007), both SN 2002cx and SN 2005hk were of
especially low velocity at the photosphere near maximum light, , had early relatively high ionization, and low peak
luminosity. Neither showed the typical secondary maxima in R and I of
normal SN Ia, but were also dissimilar to previously studied
under-luminous SN Ia that do not show the secondary maxima (e.g. Filippenko et al. 1992). There is
also extreme diversity within the class, with SN 2008ha being magnitudes fainter than SN 2002cx (Foley et al. 2009). The
light curve decline is rather slow, unlike previous under-luminous
SN Ia that serve to define the light curve brightness/decline
relation prominently used in cosmology studies.
Li et al. (2003) pointed out that no published model of a
SN Ia corresponds to all the behavior of SN 2002cx, but suggested that
a pulsating delayed detonation (Khokhlov 1991) model might
be worth considering further. Jha et al. (2006) suggested
that the nebular spectral characteristics that they determined might
be consistent with a pure deflagration model since the models in the
literature have insufficient energy to correspond to normal SNe Ia and
hence tend to have smaller expansion velocities and produce less
56Ni and hence tend to be dim. Phillips et al. (2007)
suggest that the low expansion velocities, low peak luminosity, and
the absence of secondary maxima in the NIR light curves may be
reproduced by a 3D pure-deflagration model
(Gamezo et al. 2004; Röpke et al. 2006) that produces
0.25 of 56Ni.
A key issue with the hypothesis that this class of explosions
represents pure deflagrations of white dwarfs is that the pure
deflagration models leave a substantial amount of unburned C and O in
the outer layers. This C and O should show up in the early phases and while
O I is clearly present at the second epoch (and
possibly the first), the case for C II (and possibly
for a contribution to the feature) is less clear but it is not
conclusively absent. In addition, Kozma et al. (2005) suggest that the late-time
spectra of pure deflagration models show no similarity to that of
SN 2002cx either, in particular the absence of strong features due to C and
O. Jha et al. (2006) claim a marginal detection of
O I in late-time nebular spectra of SN 2002cx, with the
suggestion that more unburned C and O may be contained inside the
dense, still optically thick core at late times.
Sahu et al. claim that at early times O I
is suppressed by high temperatures and, at late times,
nebular O I lines are also suppressed by high temperatures.
The lack of observation of O I for SN 2005hk at
very early times (before our observations) is uncertain, due to poor spectral coverage at early times
(Phillips et al. 2007) and low S/N (Sahu et al. 2008).
Sahu et al. (2008) are able to approximately model the
photospheric spectrum of SN 2005hk, based on the W7 deflagration
explosion model (Nomoto et al. 1984). Importantly,
Sahu et al. find that, given the conditions of
the SN, their spectral synthesis suggests large amounts of unburned O.
Their model also assumes spherical symmetry, for which they achieve a
reasonable approximation to the line profiles (which are somewhat
sensitive to any departures from spherical symmetry; see
e.g. Tanaka et al. 2009 for a counter example). The
features remain too broad, are forbidden rather than permitted, and
show prominent emission of [O I] . High
densities, as evidenced by the low expansion velocities and P Cygni
profiles observed at late nebular epochs, might suppress the
[O I] feature, but it is predicted in the models and so its
absence is a definite constraint on the nature of SN 2005hk.
Chornock et al. (2006) consider the possibility that these events
may be related to normal SNe Ia, but viewed along the “hole” left by
having the binary companion nearly directly along the line of sight
(Marietta et al. 2000; Kasen et al. 2004). Such an aspect might
increase the prominence of high-ionization species, weaken absorption
lines, reduce the photospheric velocity and induce some polarization
due to the non-spherical geometry of the ejecta. One issue with this
model for SN 2002cx and related explosions is that it would result in
higher luminosities than when viewed from other aspect angles. Even if
the underlying explosion were a subluminous event such as SN 1991bg,
if the view were “down the hole,” the result would be brighter than
SN 1991bg. Both SN 2002cx and SN 2005hk were subluminous by about 1
magnitude in all bands (except H; Phillips et al. 2007). It
is certainly not clear that this is consistent with a “hole”
model. Chornock et al. 2006 comment
that their measurement of a small but appreciable continuum
polarization and weak line features was inconsistent with the
prediction of Kasen et al. (2004) of a continuum
polarization of 0.1 percent and strong line polarization peaks
for an explosion viewed slightly off the axis of the hole. As the SN
evolves, the relative size of the hole and the photosphere will change
(in particular if the hole closes, which Kasen et al. 2004
expect to be a slow process if it occurs), which should lead to a
commensurate change in the polarization properties. Importantly, we
see only moderate change in the polarization, despite the significant changes
in the flux spectrum, between the epochs at which SN 2005hk was
observed. In addition, it is not at all clear how such a model would
account for the late-time permitted line spectrum delineated by
Jha et al. (2006). Our observations do suggest some line
polarization. This demands some asymmetry in the ejecta, consistent
with a single axial symmetry, but
does not spell out quantitative agreement with the “hole” model.
An alternative model might be a “plume” model
(Plewa et al. 2004; Livne et al. 2005) in which a single
plume (or very few plumes) reach the surface, spreading fresh
56Ni. If the plume burned little, the expansion might be slow
and leave high densities at late times. Our spectropolarimetry
suggests that the outer layers of the ejecta are approximately
homogeneously mixed, although stratified, which suggests mixing in a
large number of
smaller plumes (with size at the first epoch).
This class of objects thus presents many conundra. They show high
excitation early on but otherwise have none of the properties of SNe Ia
like SN 1991T that show early Fe III. Their light curves are dim
but broad, violating the “Phillips relation”. They have very slow
expansion velocities and may remain partially optically thick at
nearly 300 days after the explosion. They are mildly asymmetric in the
continuum, in the Fe III early on and in Si II near
maximum. The polarization of SN 2005hk is completely compatible with
the observed range of polarization properties for Type Ia SNe (see
Table 4). The level of polarization of SN 2005hk is
not the lowest detected for a SN, with SN 1996X (a normal Type Ia SN;
Wang et al. 1997) showing polarization just above
statistical significance and with no apparent dominant axis. The
observations of SN 2005hk show it to have a spectropolarimetric type
of D1 (Wang & Wheeler 2008), similar to most Type Ia SNe, indicating that there is a
principal axis of symmetry to the ejecta. Importantly, there are no
apparent loop like features, even for the strongest lines (which is
particularly pertinent for the observations at the second epoch) which
would indicate a significant departure from this main axial symmetry.
Normal Type Ia SNe, such as SN 2001el
(Wang et al. 2003a) and SN 2004S (Chornock & Filippenko 2008),
show some structure in their ejecta principally in the Si II, as
well as the high velocity component of the Ca II IR3 (see
also Wang et al. 2003a; Patat et al. 2009). Conversely, there
are Type Ia SNe, such as SN 2004dt (Wang et al. 2006), whose
line polarization is principally in the dominant polarization
component which is consistent with a single axial symmetry. In the
case of SN 2004dt, however, the observed line polarization was . In summary, the similarity between the spectropolarimetry of
SN 2005hk and Type Ia SNe indicates that their respective explosion
mechanisms are both approximately spherical (see Table 4).
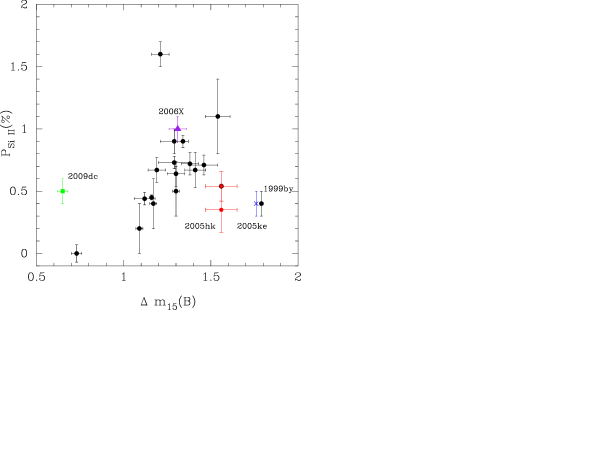
Wang et al. (2007) identified a correlation between the
degree of polarization of Si II, at -5 days, with the decline
rate () of the light curve. At some wavelengths
SN 2005hk is an outlier from the Phillips brightness-decline
relationship, although it is consistent with the relationship in the
and bands (Phillips et al. 2007). While the polarization measurements of
SN 2005hk is offset from the measured relation derived for normal
Type Ia SNe by Wang et al., it is not as significant an outlier as the subluminous
Type Ia SNe 1999by and 2005ke (see Fig. 10).
4.2. SN 2005hk as a Core-Collapse SN
Jha et al. (2006), Valenti et al. (2009) and
Foley et al. (2009) consider the possibility that events such
as SN 2002cx and 2005hk are not related to Type Ia SNe, but may
instead be a type of CCSN. Based on the photometric and spectroscopic
similarity between SN 2008ha and SN 2005hk with low-luminosity Type
IIP and Type Ic SNe (2005cs and 2007gr, respectively) and the
occurrence of these events in late-type galaxies,
Valenti et al. (2009) suggest 2002cx-like SNe are low-luminosity
Type Ic SNe, potentially associated with Gamma Ray Bursts (GRBs).
Foley et al. (2009) present additional events in this class,
which are claimed to have taken place in lenticular S0 galaxies, which
may argue against massive stars as the universal progenitors for this
type of event. Spectropolarimetry provides additional parameter space
in which to examine the similarities between different types of SNe.
Valenti et al. (2009) and Foley et al. (2009) note the
spectroscopic similarity between SN 2005hk and SN 2008ha at +15 and +8
days (after optical maximum), respectively, as well as their similarity with the subluminous
Type IIP SN 2005cs at +44 days, whilst it was still on the photometric
plateau (Pastorello et al. 2009). At such times Type IIP SNe have generally
low polarizations (Leonard et al. 2006), seemingly similar to
that observed by us for SN 2005hk. From a spectropolarimetric
perspective, however, comparison of SN 2005hk with SN 2005cs whilst on
the plateau is inappropriate. During the plateau phase, in Type IIP
SNe, the photosphere is located in the hydrogen envelope. Due to the
low ionization energy of H, the shape of the photosphere is
approximately spherical. Once the photosphere has descended below the
H envelope, into the He layer (He being harder to ionize and excite),
the shape of the photosphere more closely follows the shape of the
underlying exciting material. Despite an asymmetric explosion,
Leonard et al. (2006) observed that during the plateau SN 2004dj
had a low polarization, which increased significantly once the plateau
phase had ended. Given the H-deficient nature of SN 2002cx-like SNe,
a more appropriate comparison is with the H-deficient CCSNe, which
have been observed (as listed in Table 4) to have
significant continuum and line polarization for different species
indicating the role of highly asymmetric explosion mechanisms. Highly
asymmetric interiors have also been observed for the Type IIP SNe
2001dh and 2003gd (Maund et al., 2010, in prep.), which suggest that
an asymmetric explosion mechanism is common to all these CCSN events.
It is interesting to note another ongoing controversy
involving SNe Ia and SNe Ic. SN 2002ic was revealed by
Hamuy et al. (2003) to resemble a SN Ia embedded in a
hydrogen-rich medium. Hamuy et al. interpreted this
as a SN Ia exploding with an evolved binary companion.
Wang et al. (2004) showed that the hydrogen component was
strongly polarized and argued that the geometry was consistent with an
extended, clumpy, disk-like structure such as observed in
proto-planetary nebula stars. Hamuy et al. and
Wang et al. (2004) identified other events of this category
that were originally identified as Type IIn events, but which, on
closer inspection and comparison with SN 2002ic, revealed an
underlying Type I spectrum. More recently, Benetti et al. (2006)
have challenged this interpretation, arguing that the underlying
supernova in SN 2002ic more closely matched a SN Ic than a SN Ia.
In summary, the nature of the polarization of SN 2005hk is
inconsistent with the polarization measured for CCSNe, in particular
those of Type Ibc which have been generally observed to have very
large polarization (especially line polarization) that increases with time.
5. Conclusions
SN 2005hk has been observed at two epochs, corresponding to maximum
light and two weeks after maximum. After subtraction of the ISP
component, the SN is observed to have a very low to null intrinsic
polarization. A modulation in the Stokes parameters is observed across the
Si II line being the most significant feature, at
the first epoch, with .
At both epochs, a dominant axis can be fit to the data, although the
data are poorly described by simple straight line fits on the Stokes
plane. While there is modulation in the dominant polarization
component, at the first epoch, that is associated with line features in
the flux spectrum, the absence of similar modulations in the
orthogonal polarization component implies that the line forming
regions of the species in the flux spectrum share the same axial
symmetry as that of the photosphere. The data at both epochs is
classified as being of Spectropolarimetric Type D1.
In comparison with previously published high S/N observations of
SN 2005hk at -4 days (Chornock et al. 2006), we
observe a possible rotation of the polarization angle of the dominant
axis, but it is unclear (due to the differences in S/N) if this
represents a real rotation of the principal axis of symmetry with depth
into the ejecta.
The low level of continuum polarization limits the asymmetry of the
photosphere, at both epochs, to . The low line polarization is
suggestive that the line forming regions are mixed, that different
species occupy similar locations within the ejecta, and that they have
a similar geometry to that of the photosphere. This is similar to the
general behaviour of Type Ia SNe, and different from the chemically
segregated ejecta observed for
CCSNe.
We conclude that the spectropolarimetry of SN 2005hk is not
inconsistent with some of the expectations of the deflagration
explosion model. We find that, in order to preserve the
approximate spherical symmetry of the photosphere and the line forming regions,
any plume-like structures would be required to have a scale, in the
plane of the sky, of at both epochs. This would give
the overall appearance of homogeneously mixed ejecta containing both
the products of nucleosynthesis (Fe, Ni, Co) and unburned O at
all depths.
Spectral similarities between SN 2002cx-like events and low-luminosity
Type IIP SNe are likely to be merely superficial. The differences in
the observed spectropolarimetry of SN 2005hk with CCSNe suggests, from
a geometry perspective, that these events have different underlying
explosion mechanisms. Unfortunately, with spectropolarimetry of only
one SN from the 2002cx-like class it is not possible to determine if
these results are applicable to the entire class, in particular to the
most peculiar member of this class, SN 2008ha.
Acknowledgements
The research of JRM is funded through the Sophie & Tycho Brahe Fellowship. The Dark Cosmology Centre is supported by the DNRF. The research of JCW is supported in part by NSF grant AST-0707769. PAH is supported by the NSF grants AST 0708855 and 0703902. The authors are grateful to the European Organisation for Astronomical Research in the Southern Hemisphere for the generous allocation of observing time. They especially thank the staff of the Paranal Observatory for their competent and never-tiring support of this project in service mode. The authors thank the anonymous referee for useful comments and suggestions that have improved the manuscript.
References
- Benetti et al. (2006) Benetti, S., Cappellaro, E., Turatto, M., Taubenberger, S., Harutyunyan, A., & Valenti, S. 2006, ApJL, 653, L129
- Bevington & Robinson (2003) Bevington, P. R., & Robinson, D. K. 2003, Data reduction and error analysis for the physical sciences (Boston, MA: McGraw-Hill)
- Branch et al. (2004) Branch, D., Baron, E., Thomas, R. C., Kasen, D., Li, W., & Filippenko, A. V. 2004, PASP, 116, 903
- Burket & Li (2005) Burket, J., & Li, W. 2005, IAUC, 8625
- Cardelli et al. (1989) Cardelli, J. A., Clayton, G. C., & Mathis, J. S. 1989, ApJ, 345, 245
- Chandrasekhar (1960) Chandrasekhar, S. 1960, Radiative transfer (New York: Dover, 1960)
- Chornock & Filippenko (2008) Chornock, R., & Filippenko, A. V. 2008, AJ, 136, 2227
- Chornock et al. (2006) Chornock, R., Filippenko, A. V., Branch, D., Foley, R. J., Jha, S., & Li, W. 2006, PASP, 118, 722
- Filippenko et al. (1992) Filippenko, A. V., Richmond, M. W., Branch, D., Gaskell, M., Herbst, W., Ford, C. H., Treffers, R. R., Matheson, T., Ho, L. C., Dey, A., Sargent, W. L. W., Small, T. A., & van Breugel, W. J. M. 1992, AJ, 104, 1543
- Foley et al. (2009) Foley, R. J., Chornock, R., Filippenko, A. V., Ganeshalingam, M., Kirshner, R. P., Li, W., Cenko, S. B., Challis, P. J., Friedman, A. S., Modjaz, M., Silverman, J. M., & Wood-Vasey, W. M. 2009, AJ, 138, 376
- Gamezo et al. (2004) Gamezo, V. N., Khokhlov, A. M., & Oran, E. S. 2004, Physical Review Letters, 92, 211102
- Hamuy et al. (2003) Hamuy, M., Phillips, M. M., Suntzeff, N. B., Maza, J., González, L. E., Roth, M., Krisciunas, K., Morrell, N., Green, E. M., Persson, S. E., & McCarthy, P. J. 2003, Nature, 424, 651
- Höflich et al. (1993) Höflich, P., Mueller, E., & Khokhlov, A. 1993, A&A, 268, 570
- Höflich (1991) Höflich, P. 1991, A&A, 246, 481
- Höflich et al. (2006) Höflich, P., Gerardy, C. L., Marion, H., & Quimby, R. 2006, New Astronomy Review, 50, 470
- Howell et al. (2001) Howell, D. A., Höflich, P., Wang, L., & Wheeler, J. C. 2001, ApJ, 556, 302
- Jha et al. (2006) Jha, S., Branch, D., Chornock, R., Foley, R. J., Li, W., Swift, B. J., Casebeer, D., & Filippenko, A. V. 2006, AJ, 132, 189
- Kasen et al. (2004) Kasen, D., Nugent, P., Thomas, R. C., & Wang, L. 2004, ApJ, 610, 876
- Kasen et al. (2003) Kasen, D., Nugent, P., Wang, L., Howell, D. A., Wheeler, J. C., Höflich, P., Baade, D., Baron, E., & Hauschildt, P. H. 2003, ApJ, 593, 788
- Kawabata et al. (2002) Kawabata, K. S., Jeffery, D. J., Iye, M., Ohyama, Y., Kosugi, G., Kashikawa, N., Ebizuka, N., et al. 2002, ApJL, 580, L39
- Khokhlov (1991) Khokhlov, A. M. 1991, A&A, 245, 114
- Kozma et al. (2005) Kozma, C., Fransson, C., Hillebrandt, W., Travaglio, C., Sollerman, J., Reinecke, M., Röpke, F. K., & Spyromilio, J. 2005, A&A, 437, 983
- Leonard et al. (2002) Leonard, D. C., Filippenko, A. V., Chornock, R., & Foley, R. J. 2002, PASP, 114, 1333
- Leonard et al. (2006) Leonard, D. C., Filippenko, A. V., Ganeshalingam, M., Serduke, F. J. D., Li, W., Swift, B. J., Gal-Yam, A., Foley, R. J., Fox, D. B., Park, S., Hoffman, J. L., & Wong, D. S. 2006, Nature, 440, 505
- Leonard et al. (2005) Leonard, D. C., Li, W., Filippenko, A. V., Foley, R. J., & Chornock, R. 2005, ApJ, 632, 450
- Li et al. (2003) Li, W., Filippenko, A. V., Chornock, R., Berger, E., Berlind, P., Calkins, M. L., Challis, P., Fassnacht, C., Jha, S., Kirshner, R. P., Matheson, T., Sargent, W. L. W., Simcoe, R. A., Smith, G. H., & Squires, G. 2003, PASP, 115, 453
- Livne et al. (2005) Livne, E., Asida, S. M., & Höflich, P. 2005, ApJ, 632, 443
- Marietta et al. (2000) Marietta, E., Burrows, A., & Fryxell, B. 2000, ApJS, 128, 615
- Maund et al. (2007a) Maund, J., Wheeler, J., Patat, F., Baade, D., Wang, L., & Höflich, P. 2007a, MNRAS, 381, 201
- Maund et al. (2007b) Maund, J., Wheeler, J., Patat, F., Wang, L., Baade, D., & Höflich, P. 2007b, ApJ, 671, 1944
- Maund (2008) Maund, J. R. 2008, A&A, 481, 913
- Maund et al. (2009) Maund, J. R., Wheeler, J. C., Baade, D., Patat, F., Höflich, P., Wang, L., & Clocchiatti, A. 2009, ApJ, 705, 1139
- Mazzali et al. (2005) Mazzali, P. A., Benetti, S., Altavilla, G., Blanc, G., Cappellaro, E., Elias-Rosa, N., Garavini, G., Goobar, A., Harutyunyan, A., Kotak, R., Leibundgut, B., Lundqvist, P., Mattila, S., Mendez, J., Nobili, S., Pain, R., Pastorello, A., Patat, F., Pignata, G., Podsiadlowski, P., Ruiz-Lapuente, P., Salvo, M., Schmidt, B. P., Sollerman, J., Stanishev, V., Stehle, M., Tout, C., Turatto, M., & Hillebrandt, W. 2005, ApJL, 623, L37
- Munari & Zwitter (1997) Munari, U., & Zwitter, T. 1997, A&A, 318, 269
- Nomoto et al. (1984) Nomoto, K., Thielemann, F., & Yokoi, K. 1984, ApJ, 286, 644
- Pastorello et al. (2009) Pastorello, A., Valenti, S., Zampieri, L., Navasardyan, H., Taubenberger, S., Smartt, S. J., Arkharov, A. A., et al. 2009, MNRAS, 394, 2266
- Patat et al. (2009) Patat, F., Baade, D., Höflich, P., Maund, J. R., Wang, L., & Wheeler, J. C. 2009, A&A, 508, 229
- Patat et al. (2007) Patat, F., Chandra, P., Chevalier, R., Justham, S., Podsiadlowski, P., Wolf, C., Gal-Yam, A., Pasquini, L., Crawford, I. A., Mazzali, P. A., Pauldrach, A. W. A., Nomoto, K., Benetti, S., Cappellaro, E., Elias-Rosa, N., Hillebrandt, W., Leonard, D. C., Pastorello, A., Renzini, A., Sabbadin, F., Simon, J. D., & Turatto, M. 2007, Science, 317, 924
- Patat et al. (2010) Patat, F., Maund, J. R., Benetti, S., Botticella, M. T., Cappellaro, E., Harutyunyan, A., & Turatto, M. 2010, A&A, 510, A108+
- Patat & Romaniello (2006) Patat, F., & Romaniello, M. 2006, PASP, 118, 146
- Phillips et al. (2007) Phillips, M. M., Li, W., Frieman, J. A., Blinnikov, S. I., DePoy, D., Prieto, J. L., Milne, P., Contreras, C., Folatelli, G., Morrell, N., Hamuy, M., Suntzeff, N. B., Roth, M., González, S., Krzeminski, W., Filippenko, A. V., Freedman, W. L., Chornock, R., Jha, S., Madore, B. F., Persson, S. E., Burns, C. R., Wyatt, P., Murphy, D., Foley, R. J., Ganeshalingam, M., Serduke, F. J. D., Krisciunas, K., Bassett, B., Becker, A., Dilday, B., Eastman, J., Garnavich, P. M., Holtzman, J., Kessler, R., Lampeitl, H., Marriner, J., Frank, S., Marshall, J. L., Miknaitis, G., Sako, M., Schneider, D. P., van der Heyden, K., & Yasuda, N. 2007, PASP, 119, 360
- Plewa et al. (2004) Plewa, T., Calder, A. C., & Lamb, D. Q. 2004, ApJL, 612, L37
- Press et al. (1992) Press, W. H., Teukolsky, S. A., Vetterling, W. T., & Flannery, B. P. 1992, Numerical recipes in C. The art of scientific computing, ed. W. H. Press, S. A. Teukolsky, W. T. Vetterling, & B. P. Flannery
- Röpke et al. (2006) Röpke, F. K., Gieseler, M., Reinecke, M., Travaglio, C., & Hillebrandt, W. 2006, A&A, 453, 203
- Sahu et al. (2008) Sahu, D. K., Tanaka, M., Anupama, G. C., Kawabata, K. S., Maeda, K., Tominaga, N., Nomoto, K., Mazzali, P. A., & Prabhu, T. P. 2008, ApJ, 680, 580
- Scarrott et al. (1987) Scarrott, S. M., Ward-Thompson, D., & Warren-Smith, R. F. 1987, MNRAS, 224, 299
- Schlegel et al. (1998) Schlegel, D. J., Finkbeiner, D. P., & Davis, M. 1998, ApJ, 500, 525
- Serduke et al. (2005) Serduke, F. J. D., Wong, D. S., & Filippenko, A. V. 2005, Central Bureau Electronic Telegrams, 269
- Serkowski et al. (1975) Serkowski, K., Mathewson, D. L., & Ford, V. L. 1975, ApJ, 196, 261
- Tanaka et al. (2008) Tanaka, M., Kawabata, K. S., Maeda, K., Hattori, T., & Nomoto, K. 2008, ApJ, 689, 1191
- Tanaka et al. (2009) Tanaka, M., Tominaga, N., Nomoto, K., Valenti, S., Sahu, D. K., Minezaki, T., Yoshii, Y., Yoshida, M., Anupama, G. C., Benetti, S., Chincarini, G., Della Valle, M., Mazzali, P. A., & Pian, E. 2009, ApJ, 692, 1131
- Tanaka et al. (2010) Tanaka, M., Kawabata, K. S., Yamanaka, M., Maeda, K., Hattori, T., Aoki, K., Nomoto, K., Iye, M., Sasaki, T., Mazzali, P. A., & Pian, E. 2010, ApJ, 714, 1209
- Valenti et al. (2009) Valenti, S., Pastorello, A., Cappellaro, E., Benetti, S., Mazzali, P. A., Manteca, J., Taubenberger, S., Elias-Rosa, N., Ferrando, R., Harutyunyan, A., Hentunen, V. P., Nissinen, M., Pian, E., Turatto, M., Zampieri, L., & Smartt, S. J. 2009, Nature, 459, 674
- Wang et al. (2003a) Wang, L., Baade, D., Höflich, P., Khokhlov, A., Wheeler, J. C., Kasen, D., Nugent, P. E., & et al. 2003a, ApJ, 591, 1110
- Wang et al. (2003b) Wang, L., Baade, D., Höflich, P., & Wheeler, J. C. 2003b, ApJ, 592, 457
- Wang et al. (2006) Wang, L., Baade, D., Höflich, P., Wheeler, J. C., Kawabata, K., Khokhlov, A., Nomoto, K., & Patat, F. 2006, ApJ, 653, 490
- Wang et al. (2004) Wang, L., Baade, D., Höflich, P., Wheeler, J. C., Kawabata, K., & Nomoto, K. 2004, ApJL, 604, L53
- Wang et al. (2007) Wang, L., Baade, D., & Patat, F. 2007, Science, 315, 212
- Wang & Wheeler (2008) Wang, L., & Wheeler, J. C. 2008, ARAA, 46, 433
- Wang et al. (1997) Wang, L., Wheeler, J. C., & Hoeflich, P. 1997, ApJL, 476, L27+
| Object | Date | Exposure | Median | Type |
|---|---|---|---|---|
| UT | (s) | Airmass | ||
| SN 2005hk | 2005 Nov 09.163 | 1.255 | SN | |
| HD 49798 | 2005 Nov 09.363 | 5 | 1.067 | Flux Std. |
| SN 2005hk | 2005 Nov 23.096 | 1.160 | SN | |
| LTT 1020 | 2005 Nov 23.132 | 5 | 1.139 | Flux Std. |
| Species | |||
|---|---|---|---|
| 2005 Nov 09 | |||
| Ca II H &K | 3780 | 3960 | |
| Fe II | 4225 | 4315 | |
| Si II | 6120 | 6270 | |
| Fe II? | 7070 | 7215 | |
| Ca II IR3 | 8340 | 8490 | |
| 2005 Nov 23 | |||
| Ca II H &K | 3750 | 3930 | |
| Fe II | 4017 | 4077 | |
| Fe II | 4610 | 4910 | |
| Fe II | 5910 | 6030 | |
| Fe II? | 7130 | 7220 | |
| Least Squares Fit Analysis | Principal Components | Centroids | |||||||||
| Date | Axial Ratio | ||||||||||
| 09 Nov 2005A | 347.2/154 | 0.87 | 3.7 | ||||||||
| 09 Nov 2005B | 202.3/98 | 0.78 | 8.7 | ||||||||
| 23 Nov 2005A | 288.8/154 | 0.47 | 14.0 | ||||||||
| 23 Nov 2005B | 160.9/98 | 0.42 | 18.55 | ||||||||
| A for data over the wavelength range 3700-8600Å | |||||||||||
| B for data over the wavelength range 4000-7000Å | |||||||||||
| SN | Spectral | Epoch† | SP | Continuum | Line | Ref. |
| Type | Type‡ | Pol. (%) | Pol. (%) | |||
| 1996X | Ia (normal) | -7 | N1 | Si II: | 1 | |
| 1999by | Ia (sub) | -1 | D1 | 2 | ||
| 2001el | Ia (normal) | +2 | D1+L(Ca) | Si:0.3;Ca:0.7 | 3 | |
| 2003du | Ia (normal) | +18 | D1 | 4 | ||
| 2004S | Ia (normal) | +9 | D | 5 | ||
| 2004dt | Ia (normal) | -7 | D1(Si+Mg) | Si II: | 6 | |
| 2006X | Ia (normal) | 0 | D1+L | Si II: | 7 | |
| 2005hk | 2002cx-like | -4 | D1 | 8 | ||
| 0 | D1 | this work | ||||
| 14 | D1 | this work | ||||
| 2002ap | Ic (broad-lined) | 0 | DL | O I:4 | 9 | |
| 2005bf | Ib (pec) | -6∗ | D1,L(He+Ca) | He I:1.3,Ca II:4 | 10 | |
| 2007gr | Ic | +21 | D1+L(Ca) | Ca II:2.5 | 11 | |
| 2008D | Ib | 0 | D1+L(He+Ca) | He I:0.6,Ca II:1.8 | 12 | |
| 14 | D1+L(He+Ca) | He I:1.1,Ca II:2.5 | 12 |
† Relative to optical maximum; ‡ SN
Spectropolarimetric types see Wang & Wheeler (2008); ∗
relative to the second maximum; References (1) Wang et al. (1997); (2) Howell et al. (2001); (3) Wang et al. (2003a); (4) Leonard et al. (2005); (5) Chornock & Filippenko (2008); (6) Wang et al. (2006); (7) Patat et al. (2009); (8) Chornock et al. (2006); (9) Wang et al. (2003b), Kawabata et al. (2002), Leonard et al. (2002); (10) Maund et al. (2007a); (11) Tanaka et al. (2008); (12) Maund et al. (2009).