The chemical evolution of elliptical galaxies with stellar and QSO dust production
Abstract
Context. The presence of dust strongly affects the way we see galaxies and also the chemical abundances we measure in gas. It is therefore important to study the chemical evolution of galaxies by taking into account dust evolution.
Aims. We aim at performing a detailed study of abundance ratios of high redshift objects and their dust properties. We focus on Lyman-Break galaxies (LBGs) and Quasar (QSO) hosts and likely progenitors of low- and high-mass present-day elliptical galaxies, respectively.
Methods. We have adopted a chemical evolution model for elliptical galaxies taking account the dust production from low and intermediate mass stars, supernovae Ia, supernovae II, QSOs and both dust destruction and accretion processes. By means of such a model we have followed the chemical evolution of ellipticals of different baryonic masses. Our model complies with chemical downsizing.
Results. We made predictions for the abundance ratios versus metallicity trends for models of differing masses that can be used to constrain the star formation rate, initial mass function and dust mass in observed galaxies. We predict the existence of a high redshift dust mass-stellar mass relationship. We have found a good agreement with the properties of LBGs if we assume that they formed at redshift z=2-4. In particular, a non-negligible amount of dust is needed to explain the observed abundance pattern. We studied the QSO SDSS J114816, one of the most distant QSO ever observed (z=6.4), and we have been able to reproduce the amount of dust measured in this object. The dust is clearly due to the production from supernovae and the most massive AGB stars as well as from the grain growth in the interstellar medium. The QSO dust is likely to dominate only in the very central regions of the galaxies and during the early development of the galactic wind.
Key Words.:
ISM: dust, extinction; ISM: abundances; galaxies: ellipticals: chemical abundances, formation and evolution ; individual: SDSS J114816.64+525150.3, MS1512-cB58.1 Introduction
Dust modifies the physical and chemical conditions of the interstellar medium (ISM), in particular it prevents stellar radiation from penetrating dense clouds, affects the cooling process, and depletes elements into grains. Dust absorbs and scatters photons mostly at wavelengths , and reemits them as infrared photons. Those processes affect our interpretation of the observational results, for instance those concerning the spectral energy distribution (SED) and the chemical abundances of the gas. Dust is a fundamental component which cannot be neglected especially when comparing model results to high redshift observations. There are clear evidences that a non-negligible amount of dust exists at high redshift as indicated by the extinction curves for Lyman break galaxies (LBGs) (Shapley et al., 2001) and by the far infrared (IR) to millimeter (mm) dust thermal emission of distant quasars (Beelen et al., 2006; Bertoldi et al., 2003a; Wang et al., 2008). The main stellar sites for dust production are the cool dense atmospheres of Asymptotic Giant Branch (AGB) stars and the supernovae (SNe), and the type of dust formed depends on the chemical composition of the ejecta. Despite the fact that AGB stars and SNe Ia contribute to dust already after 30 Myr (i.e. the lifetime of a 8 ) since the beginning of star formation, the large observed amount of dust at high redshift in some quasars needs perhaps an additional dust source. The SNe II are one obvious stellar site (Maiolino et al. 2004), but it is not clear how dust evolution proceeds in SN II enviroments (Dwek et al., 2007b; Kozasa et al., 2009). In fact, while submillimetre observations of the Kepler and CasA SN remnants yield 0.1-1 of dust (e.g. Morgan et al., 2003, Dunne et al., 2009, Gomez et al., 2009), infrared observations give 0.1 of dust (Helmhamdi et al., 2003, Sugerman, et al. 2006, Kotak et al., 2009; Rho J. et al., 2008, 2009; Meikle et al., 2007; Takaya et al. 2008). A possibility is that such a discrepancy could be traced back to a difference in the instrument sensitivity to the different dust phases (cold for submillimetre, warm for Spitzer). On the other hand, theoretical calculations may yield up to 1 of dust, with the exact value depending on the progenitor mass and chemical composition of the ejecta111For instance in Calura et al. (2008) we assume that a 20 star forms 0.8 of dust (e.g. Dwek, 1998 and references therein). However, a large fraction of this dust can be destroyed by the reverse shock inside the SN remnant (e.g. Bianchi & Schneider, 2007), with the details depending on the degree of asymmetry in the explosion (Nozawa et al., 2010).
The so-called smoking quasars, namely quasars produced in the clouds in the broad line regions (Elvis et al., 2002), might be one of the few sources of high redshift dust, but how much dust can be formed by the QSO wind is still unknown. Markwick-Kemper et al.(2007) determined the composition of dust in the broad absorption line (BAL) quasar PG 2112+059. They argued that the derived crystalline silicate fraction requires high temperatures such as those found in the immediate quasar environment in order to counteract the rapid destruction from cosmic rays, thus lending support to Elvis et al. (2002) idea.
The measurement of metallicity and dust depletion, which are products of the (inter-)stellar evolution, provides an important constraint on chemical models. The formation and evolution of dust in primordial SNe as well as the dust evolution effects on SED of galaxies have been studied by Nozawa et al. (2008) and Schurer et al. (2009), respectively. Studies of the gas, metal and dust evolution have been performed by means of analytical models (Dwek et al., 2007a) and simulations (Dwek, 1998; Morganet al., 2003; Inoue, 2003; Valiante et al., 2009a). Calura et al. (2008) applied a detailed formulation of dust production and destruction to a detailed chemical evolution model. In that paper the model was mostly constrained by means of the solar neighbourhood dust determination, and then it was proven to be quite flexible, since it can be readily applied to models for elliptical and irregular galaxies. The qualitative dust mass evolution with time in high mass spheroids was depicted and Calura et al. (2008) showed how the dust is an important factor also in the very late phases of their lives, namely when the star formation is over. In this paper we aim at studying in detail the dust evolution in elliptical galaxies by starting from the model by Calura et al. (2008). We update the dust production by changing the dust condensation efficiency in supernova Ia and II (in order to take into account the above mentioned new observational constraints) and adding the possibility of QSO dust. We also revise the accretion process timescale. We present models of ellipticals of different baryonic masses in the range , and compare them with LBGs and with QSO hosts. In particular, after some general predictions, we focus on the particular cases: LBG MS 1512-cB58(as a proxy for a relatively low mass elliptical) and the host galaxy of QSO J1148+5251(as a proxy for the most massive spheroids).
The paper is organized as follows. The chemical evolution model and the dust model are described in §2 and §3, respectively. Observational data are briefly summarized in §4 . We predict the chemical and dust evolution of elliptical galaxies in different conditions and apply them to interpret the observational data in §5-7. Our conclusions are summarized in §8.
2 The chemical evolution model for elliptical galaxy
2.1 The chemical evolution code
The model adopted here is basically the multi-zone model of Pipino & Matteucci (2004). The model galaxy is divided into spherical shells 0.1 thick. Most of the results presented below refer to global galactic properties and are calculated by considering all the shells. In practice, quantities like the total mass in stars are computed by summing up the single shell contributions, whereas the chemical abundances are (gas) mass-weighted averages. The galaxy evolves as an open box in which the initial gas mass, with primordial chemical composition, rapidly collapses, on a time scale , into the potential well of a dark matter halo.
The rapid collapse triggers an intense and rapid star formation process, which can be considered as a starburst and lasts until a galactic wind, powered by the thermal energy injected by stellar winds and SN (Ia, II) explosions, occurs. At that time, the gas thermal energy equates the gas binding energy of and all the residual interstellar medium is assumed to be lost. After that time, the galaxies evolve passively.
The equation of chemical evolution for the element in each galactic shell takes the following form:
| (1) | |||||
where is the fractional mass of the element i at the time t in the ISM. The quantity is defined as the abundance by mass of the element i. By definition .
The first term on the right side of eq. 1 gives the rate at which the element is subtracted from ISM by the SF process. The variable is the star formation rate calculated according to the following law:
| (2) |
namely it is assumed to be proportional to the gas mass via a constant which represents the star formation efficiency. In order to reproduce the ’inverse wind model’ of (Matteucci, 1994), an earlier version of the now popular ”downsizing”, we assume as an increasing function of the galactic mass, (see Table 1) following the findings of our previous work (Pipino & Matteucci, 2004).
The second term is the rate at which each element is restored into the ISM by single stars with masses in the range - , where is the minimum mass contributing, at a given time , to chemical enrichment and is the minimum binary mass allowed for binary systems giving rise to SNIa (, Greggio & Renzini, 1983). The initial mass function (IMF) is , (Salpeter 1955), and it is normalized to unity in the mass interval . In particular, , is a matrix which calculates for any star of a given mass the amount of the newly processed and already present element , which is returned to the ISM. The quantity is the lifetime of a star of mass (Padovani & Matteucci, 1993).
The third term represents the enrichment by SN Ia for which we assume the single degenerate scenario: a C-O white dwarf plus a red giant (Whelan & Iben 1973). We refer to Greggio Renzini (1983), Matteucci Greggio (1986) and Matteucci & Recchi (2001) for further details. The predicted SNIa explosion rate is constrained to reproduce the present day observed value (Mannucci et al., 2008), by fixing the parameter in eq. (1).
The fourth and fifth terms represent the enrichment by single massive stars. The initial galactic infall phase enters the equation via the sixth term, for which we adopt the formula:
| (3) |
where describes the chemical composition of the accreted gas, assumed to be primordial. is the normalization constant obtained by integrating the infall law over a Hubble time. For instance, for a model, the accretion history is such that 90% of the initial gas has already been accreted at (in fact, we halt the infall of the gas at the occurrence of the galactic wind). Finally, in order to calculate the potential energy of gas, we take into account the presence of a dark matter halo. The assumed prescriptions are the same as in our previous models (e.g. Pipino & Matteucci 2004).
2.2 Stellar yields
The yields used in this paper are as follows:
-
1.
For single low and intermediate mass stars () we make use of the yields by van den Hoek & Gronewegen (1997) as a function of metallicity.
-
2.
For SNIa and SNII we adopt the recently suggested empirical yields by François et al. (2004). These yields are a revised version of the Woosley & Weaver (1995, for SNII) and Iwamoto et al. (1999, for SNIa) calculations adjusted to best fit the chemical abundances in the Milky Way. When discussing J1148+5251we will also present a case in which for O and C we have adopted the yields computed assuming mass loss in massive stars for as in Maeder (1992). In fact, including mass loss in massive stars produces a large loss of C and He, thus lowering the O production, and this effect is significant only for over-solar metallicity. Recent papers (McWilliam & al. 2008; Cescutti & al. 2009) have shown that these yields are required to reproduce the [O/Mg] and [C/O] ratios at high metallicities in the Galactic bulge.
| model | |||||||||||||||
|---|---|---|---|---|---|---|---|---|---|---|---|---|---|---|---|
| name | C,O yields | N | stellar | recipe | QSO | BEL | |||||||||
| () | (kpc) | () | (Gyr) | (Gyr) | primary | dust | dust | () | (Gyr) | metall. | |||||
| M9 | 0.4 | 1.2 | 0.8 | 1.2 | +0.28 | François | no | off | - | - | - | - | - | - | |
| M9d | 0.4 | 1.2 | 0.8 | 1.2 | +0.28 | François | no | on | this work | 0.1 | off | - | - | - | |
| M10 | 1 | 3 | 0.5 | 1.1 | +0.29 | François | no | off | - | - | - | - | - | - | |
| M10d | 1 | 3 | 0.5 | 1.1 | +0.29 | François | no | on | this work | 0.08 | off | - | - | - | |
| M310 | 2 | 5 | 0.5 | 1.0 | +0.30 | François | no | off | - | - | - | - | - | - | |
| M310N | 2 | 5 | 0.5 | 1.0 | +0.30 | François | yes | off | - | - | - | - | - | ||
| M310d | 2 | 5 | 0.5 | 1.0 | +0.30 | François | no | on | this work | 0.05 | off | - | - | - | |
| M310Nd | 2 | 5 | 0.5 | 1.0 | +0.30 | François | yes | on | this work | 0.05 | off | - | - | - | |
| M310Cd | 2 | 5 | 0.5 | 1.0 | +0.30 | François | no | on | Calura | 0.05 | off | - | - | - | |
| M310MD | 2 | 5 | 0.5 | 1.0 | +0.30 | Maeder | no | off | - | - | - | - | - | - | |
| M310MDd | 2 | 5 | 0.5 | 1.0 | +0.30 | Maeder | no | on | this work | 0.01 | off | - | - | - | |
| M11 | 3 | 10 | 0.4 | 0.9 | +0.33 | François | no | off | - | - | - | - | - | - | |
| M11d | 3 | 10 | 0.4 | 0.9 | +0.33 | François | no | on | this work | 0.03 | on | - | - | - | |
| M12 | 10 | 20 | 0.2 | 0.7 | +0.39 | François | no | off | - | - | - | - | - | - | |
| M12d | 10 | 20 | 0.2 | 0.7 | +0.39 | François | no | on | this work | 0.01 | on | 0.049 | mod | ||
| M12MDd | 10 | 20 | 0.2 | 0.7 | +0.39 | Maeder | no | on | this work | 0.01 | on | 0.049 | mod | ||
| M12dcaseA | 10 | 20 | 0.2 | 0.7 | +0.39 | François | no | on | this work | 0.01 | on | 0.049 | 5x | ||
| M12dcaseB | 10 | 20 | 0.2 | 0.7 | +0.39 | François | no | on | this work | 0.01 | on | 0.049 | mod | ||
| M12dcaseC | 10 | 20 | 0.2 | 0.7 | +0.39 | François | no | on | this work | 0.01 | on | 0.049 | mod | ||
| M12dcaseD | 10 | 20 | 0.2 | 0.7 | +0.39 | François | no | off | - | 0.01 | on | 0.49 | mod |
The values for and refer to the central regions of the galaxy. These values are determined only by (and hence and ). At each given mass models differ by C, O and N yields - fiducial, Maeder (1992) and primary production, respectively - dust (on/off, prescriptions for stellar dust, and QSO dust production). The BEL metallicity is the metallicity of the gas out of which the QSO dust forms: mod refer to a model self-consistently calculated metallicity, 5x is for the case in which the adopted metallicity is 5 times higher than the average mod one.
3 Dust model
3.1 Stellar dust
We adopt the dust model of Calura et al. (2008) which uses the formalism developed by Dwek (1998). Let us define as the abundance by mass of the element at the time in the dust and since is the ISM fraction at the time , the quantity represents the normalized mass of the element at the time in the dust. The time evolution of is therefore computed as:
| (4) | |||||
where . We refer the reader to Calura et al. (2008) for further details and we note that in this equation we neglected the wind term which allows us to take into account the fraction of dust which is ejected during the galactic wind. The main reason is that we are focusing on the evolution. The dust mass after the wind depends on several assumptions (e.g. fate of the dust in the wind stage, wind mass loading, sputtering in the hot medium) and we are planning to improve upon the Calura et al. (2008) formulation in a future work. Here recall the general features of the model as well as the main assumptions. Only the main refractory elements, C, O, Mg, Si, S, Ca, Fe, are depleted into dust, and we assume that stars can produce two different types of grains: i) silicate dust, composed of O, Mg, Si, S, Ca and Fe, and ii) carbon dust, composed of C. As suggested by Dwek (1998), we consider that the dust producers are low and intermediate mass stars, SNIa and SNII. The condensation efficiencies , and , for low and intermediate mass stars, SNIa and SNII, respectively, are as follows.
In low and intermediate-mass stars, dust is produced during the Asymptotic Giant Branch (AGB) phase
(Ferrarotti & Gail 2006 and references therein). We assume that
dust formation depends mainly on the composition of the stellar envelopes.
If and represent the O and C mass fractions in the stellar envelopes, respectively, we assume that
stars with 1 are producers of silicate dust, i.e. dust particles composed by O, Mg, Si, S, Ca, Fe. On the other hand, C rich stars,
characterized by 1, are producers of carbonaceous solids, i.e. carbon dust (Draine 1990).
Being and the total ejected mass and the dust mass formed by a star of initial mass
for the element ,
respectively, we assume that for stars with 1:
with
for all the other elements.
For stars with 1 in the envelope, we assume:
with for Mg, Si, S, Ca, Fe and
with being the mass of the element in atomic mass units.
For SNIa we assume:
For SNII, we adopt the same prescriptions as for SNIa.
The terms and represent the timescales for the destruction and accretion of dust, respectively. For a given element , the accretion timescale can be expressed as:
| (5) |
where
| (6) |
Dust accretion occurs in dense molecular clouds, where volatile elements can condensate onto pre-existing grain cores, originating a volatile part called mantle (Dwek, 1998, Inoue, 2003). Direct evidences for dust accretion come from the observed large variations of the depletion levels as a function of density (Savage & Sembach 1996) and from the observed infrared emission of cold molecular clouds (Flagey et al. 2006), which is characterized by the absence of small grain emission. These features can be accounted for by the coagulation of small grains on and into larger particles. Indirect evidence for dust accretion comes from the estimation of the grain lifetimes, which would be very small if no process could allow the grains to recondense and grow (McKee 1989, Draine & Salpeter 1979) .
Dust destruction is primarily due to the propagation of SN shock waves in the warm/ionized interstellar medium (McKee 1989, Jones et al. 1994). Following the suggestions by McKee (1989) and D98, for a given element the destruction timescale can be expressed as:
| (7) |
Hence the destruction timescale is independent of the dust mass. is the mass of the interstellar gas swept up by the SN remnant. For this quantity, McKee (1989) suggests a typical value of as well as a value for the destruction efficiency in a three-phase medium as the present-day local ISM are around 0.2, Hence Calura et al. (2008) assumed:
| (8) |
In Calura et al. (2008), is the total SNe rate at any given timestep, including the contributions by both SNIa and SNII.
Below we discuss the different prescriptions adopted here with respect to the original model presented in Calura et al. (2008).
We note here that the modifications have been made through changes in the parameters (e.g. , ),
whereas the general scheme and the above equations hold for both the Calura et al. and the present
formulations.
Dust production:
-
•
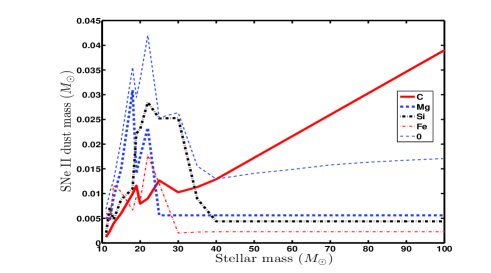
We reduced the values for in order to reproduce recent observational constraints (e.g. Kotak et al., 2009, Gomez et al., 2009). In practice, since the main unknown quantity is the efficiency with which newly created dust might be destroyed by reverse shocks inside the SN remnant - that we cannot model - before it either becomes observable or is ejected in to the ISM, we include this uncertainty in the quantity (see also Valiante et al., 2009a, and Zhukovska et al., 2008). In particular, we decreased the by a factor of 10 with respect to the Calura et al.’s fiducial case. This implies that a typical 20 star now produces nearly 0.08 of dust. This is 2-3 times higher than the maximum amount of warm dust observed in SNII (Rho et al., 2008, 2009), yet lower than the most recent estimates of the cold dust mass in the Kepler and CasA SN remnants (Gomez et al., 2009, Dunne et al., 2009). The dust “yields” as a function of stellar mass for SNeII are shown in Fig. 1, whereas a comparison between the new efficiencies and those in Calura et al. is shown in Table LABEL:tablediff.
-
•
We reduced by a factor of 10 also the values for and the reason is that there is no clear indication that SNe Ia produce dust and certainly they cannot produce more dust than SNe II.
Dust accretion in the ISM:
We have improved the calculation of the dust growth rate for systems with a SFR (and hence a cloud destruction rate) much higher than in the MW.
We assumed that the dust accretion occurs only during the starburst epoch222After the galactic wind occurs and star formation stops there is only dust production from long living stars and SNIa. in dense molecular clouds, where volatile elements can condensate onto pre-existing grain cores. In particular, in order to calculate the effective growth timescale we took into account the two following facts: i) the growth timescale is in the range 10-70 Myr and quickly decreases with the metallicity of the ISM (c.f Zhukovska et al. 2008, their Fig. 12), and ii) the effective growth timescale depends on the fraction of ISM in molecular clouds. As far as the former is concerned, given the high SF rates in model ellipticals (see below) the metallicity quickly increases; therefore, for a sizeable fraction of the galaxy evolution, we are in the regime in which is shorter than the typical survival time of molecular clouds, (20-30 Myr, e.g. Krumholz & al. 2006). This implies that the dust growth regime is basically determined by the cycling frequency of the ISM between clouds rather than by the inner processes occurring inside the clouds (Zhukovska et al., 2008), which we will neglect. Namely, if we consider a fraction of ISM which collapses into a cloud which is in turn dispersed by the young stars, there is always a net increase in the dust mass. The more frequently the single regions of the ISM collapse into clouds, form stars and become diffuse ISM again, the faster the gain in dust mass by growth. In other words, the only difference between galaxies of different mass/SF history might arise from the fraction of ISM in molecular clouds at any time and by the speed at which these clouds are (re-)created. In the revised monolithic formation scenario, the formation of the most massive galaxies occurs in a very intense and short burst, with SFRs exceeding 1000 M⊙/yr (Fig. 2). Therefore we expect that most of the ISM is in the form of clouds for most of the time, during the active star forming phase. The high mass galaxy model forms twice as fast (in terms of infall timescale, 4 times if the star formation timescale is considered) as the low mass galaxy model. Therefore, relatively speaking, we expect that the high mass model will have an effective growth timescale which is a factor of 2-4 shorter than in the low mass model. In this latter case we adopt the fiducial value (=0.05 Gyr) from Calura et al. (2008), whereas in the former, namely the most massive galaxy, we assume =0.01 Gyr.
Dust destruction:
We accounted for the effect of correlated SNe II, which strongly suppresses the destruction of the interstellar dust with respect to the case in which all SNe could be treated as isolated and random explosions. McKee (1989), estimates that in an association with 10-40 SNeII, the dust mass which can be destroyed amounts to times the mass of dust destroyed by a single isolated explosion, namely the mean efficiency per SNII is a factor of 0.05-0.2 the efficiency of an isolated explosion. To mimic this effect we made use of an effective SNII rate (equal to the 1/10 of the actual SNII rate) when computing the destruction rate (Eq. 7). The SNIa explosions are not correlated, therefore we still used their actual rate for computing the destruction due to them.
Table LABEL:tablediff shows the values adopted for the dust depletion efficiencies and both the growth and the destrunction timescale in both the old (Dwek et al., 1998, Calura et al., 2008) and in the revised (this paper) formulation for the dust evolution.
| parameter | Calura et al. | new value | element |
| 1 | 1 | C333Refer to Sec. 3.1 for the formula for the C dust. | |
| (C/O1) | 0 | 0 | O,Mg,Si,S,Ca,Ti,Fe |
| 0 | 0 | C | |
| (C/O1) | 1 | 1 | Mg,Si,S,Ca,Ti,Fe |
| 0.5 | 0.05 | C | |
| 0.8 | 0.08 | Mg,Si,S,Ca,Ti,Fe444Refer to Sec. 3.1 for the formula for the O dust. | |
| 0.5 | 0.05 | C | |
| 0.8 | 0.08 | Mg,Si,S,Ca,Ti,Fe | |
| const with gal. mass | dependent on gal. mass | ||
| true SNII rate | effective555A factor of 10 lower than the true rate SNII rate | ||
| +true SNIa rate | +true SNIa rate | ||
| QSO dust | - | Elvis et al. (2002) |
3.2 QSO dust
A non-stellar mechanism for dust production in the early universe was proposed by Elvis et al. (2002). These authors showed that the physical conditions in the clouds of the Broad Emission Line (BEL) regions which undergo cooling and adiabatic expansion may become similar to the conditions of AGB stellar envelopes, and therefore may provide sites for dust formation. The QSO wind can then enhance the pressure, hence boosting the dust production. Elvis et al. (2002) estimate that this process starts when the BEL clouds are about 3pc from the QSO center. Also, they estimate that dust sublimation due to the QSO radiation should be prevented by the cloud geometry and composition even in the most luminous QSOs.
To take into account this dust production channel we assumed a simple model suggested by Maiolino et al. (2006) with the main difference that we use a self-consistent estimate of the gas metallicity in the dust formation site. The main ingredients are the following:
-
1
In order to reproduce the correlation between BH and stellar mass, we expect a BH mass (Ferrarese & Cote, 2007) at the wind time . Since now on, we will refer to the above “fiducial” set-up, unless stated otherwise. In Sec. 6 we will also discuss cases in which the BH-to-stellar mass ratio is higher, as it seems to be the case at high redshifts (e.g. Lamastra et al., 2010).
-
2
In order to achieve (1) it is enough to let the BH grow at the Eddington rate over the time 0- (Padovani & Matteucci 1993), starting from a seed mass of .
-
3
We assume that the mass flow rate from QSO wind is in units of (Proga et al, 2000).
-
4
We assume that the QSO dust creation rate scales as the mass flow rate in the QSO wind. The factor of proportionality being the elemental abundance in the gas which is calculated at each timestep. Our model predicts average metallicities in each shell. Therefore, the abundances in the central region of the galaxies are lower than the ones measured in BLRs (Nagao et al., 2006b, Juarez et al., 2009). In Sec. 6 we will show a case in which we estimate the effect of the enhanced BLR metallicity in the creation of QSO dust.
-
5
We use the same depletion efficiencies as for low- and intermediate-mass stars, hence .
Interestingly, several studies (e.g. Maiolino et al. 2004) show that the extinction curve in high redshift QSOs is similar to the one expected for a medium dominated by SN dust. Indeed, some SNeII (and possibly “prompt” SNeIa, see Mannucci et al, 2006) can provide the metal seeds out of which the QSO dust can condense. The effect of the QSO dust amount and composition on the spectral properties of high redshift spheroids can possibly constrain the above scheme and it will be the topic of a forthcoming paper.
We will study the QSO contribution to the dust only in the highest mass galaxy model. The reasons are many: i) the observations we compare with are for high redshift very massive galaxies which host QSOs; ii) the fraction of QSO in z3 LBGs is lower than 3% (Reddy et al., 2008), and iii) there is no indication of a QSO in MS 1512-cB58.
4 Observational Data
In this section we briefly summarize the observations to which we will compare our model predictions in the rest of the paper.
4.1 Lyman break galaxies
From the discovery of LBGs (see Steidel et al. 1996a,b), only a handful of objects whose abundance pattern has been studied in great detail. One of the first of such objects for which abundance measurements were available is MS 1512-cB58, studied by Pettini et al. (2002). Owing to its gravitationally lensed nature, MS 1512-cB58 is one of the brightest known LBGs. This object is at and has a luminous mass of , a star formation rate (Pettini et al., 2002) and an effective radius of (Seitz et al. 1998), for a cosmology. Pettini et al. (2002) concluded that the abundances of O, Mg and Si are of their solar values, whereas [Fe/H]=-1.15, hence underabundant by a further factor of with respect to the other elements. This underabundance is probably caused by depletion into dust. Pettini et al. (2002) took into account the effect of dust depletion on Fe-peak elements and suggested that is of the order of a factor of two. Matteucci & Pipino (2002) modeled the chemical abundances of such a galaxy by taking into account the dust depletion, as suggested by Pettini et al. (2002) and concluded that this galaxy is a small young elliptical undergoing a burst of star formation and a galactic wind. We suggested an age of 35 Myr for this object. However, that original formulation of the chemical evolution model did not take into account the dust evolution as we have here. Further confirmation of the presence of the dust came from 3D transfer models (Schaerer & Verhamme, 2008) and dust emission models (Takeuchi & Ishii, 2004).
More recently, other lensed LBGs have been observed (e.g., Quider et al., 2009, 2010, Dessauges-Zavadsky et al., 2010) but the presence of either line emission or intervening systems, as well as the different spectral coverage, hampered the measurement of an extended set of abudance ratios as in MS1512-cB58.
For the oxygen abundance, we will also use data from the AMAZE (Assessing the Mass-Abundance redshift(Z) Evolution, Maiolino et al., 2008) and LSD (Lyman-break galaxies Stellar populations and Dynamics, Mannucci et al., 2009) programs at z as well as data from Hainline et al. (2009).
4.2 Quasars
The chemical abundances in QSOs are measured either from the broad line region (BLR) or from the narrow line region (NLR). The BLR traces a region of very small size (of the order of parsecs) around the QSO, whereas the NLR extends on sizes (of the order of kpc) comparable to the size of the host galaxy. The most remarkable facts about abundances in QSOs are: i) most of QSOs show oversolar metallicities, even at very high redshift() (Maiolino et al., 2006) ii) the lack of evolution in the QSOs metallicities in a redshift range for both BLR and NLR (e.g. Nagao et al., 2006a, 2006b, Matsuoka et al., 2009, Juarez et al., 2009). The most reasonable conclusion from this is that the host galaxies of QSO formed at very high redshift and evolved very fast due to a very intense star formation which produced a lot of metals by means of SNe II. Therefore, over-solar metallicities are attained on timescales of hundreds of Myr and after that the metallicity cannot increase anymore since the host galaxies lose their residual gas by means of galactic winds (Matteucci & Padovani, 1993). However, Juarez & al. (2009) suggested that the lack of evolution can be due to selection effects.
Recent data on NLR can be found in D’Odorico et al. (2004). They derived the abundances of C, N and elements from the NLR of six QSOs. We will also use these data for comparison with our models.
A non-negligible amount of dust exists in QSO and the different extinction curve between QSOs and local galaxies are challenges for models.
Here we concentrate on the quasar J1148+5251, which is at (Bertoldi et al., 2003b; Iwamuro et al., 2004), and is one of the most distant QSOs detected (Fan et al. 2003). This object is only 375-800 Myr old. Using the FIR luminosity , the estimated dust mass ranges from to (e.g. Bertoldi et al., 2003a, Robson et al. 2004; Carilli et al. 2004; Beelen et al. 2006).
Several studies (Barth et al. 2003; Maiolino et al. 2005; Becker et al. 2006) indicate a near solar metallicity in the quasar host. SDSS J1148 shows a bolometric luminosity of powered by accretion onto a supermassive black hole (SMBH) of mass 1-5 (Willott et al., 2003, Barth et al. 2003). The estimated SFR of the host galaxy is (Bertoldi et al. 2003b; Carilli et al. 2004). Several other high redshift quasars are now detected at submillimeter wavelengths (Priddey et al. 2003, Wang et al., 2008 and references therein), which indicate the presence of dust grains in excess of .
5 Overall results
The main parameters of the model are shown in Table 1. In particular, the model mass is uniquely associated to effective radius , star formation efficiency , infall timescale . These quantities set the predicted time for the occurrence of a wind and the average [Mg/Fe] in the stars. These last two values are for the central (), because observations typically constrain [Mg/Fe] in such a region. The adopted empirical relation between , and the galaxy mass is motivated by our previous works (e.g. Pipino & Matteucci, 2004). For each model mass, we will then consider cases where the C and O yields are taken from Maeder (1992), the N yields include primary production in massive stars, as well as different dust recipes. These prescriptions, however, do not affect the galactic wind timescale and the SFR. Here we briefly mention some general properties of the models, such as the star formation histories (which comply with downsizing, e.g. Thomas et al., 2005), the dust masses and the abundance ratio evolution. In Pipino & Matteucci (2004) the mean formation redshift of the model galaxies was constrained to the observed ages (inferred from optical line-strength indices) and the mean colours at a given mass. For the purpose of this paper, we leave the formation redshift free in order to find the best fit to the single objects that we try to reproduce.
5.1 Star formation rates
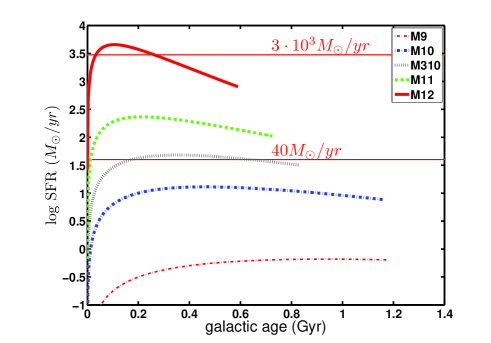
Fig. 2 shows the predicted SFR for our model galaxies summed over the shells and truncated at the average . It is worth noting that the average value of is lower than that calculated for the inner regions and reported in table 1. The reason is that, in the adopted framework, elliptical galaxies form outside-in (e.g. Martinelli et al., 1998, Pipino et al., 2008), hence a wind developes first in the outskirts, whereas the innermost regions are still experiencing star formation (and QSO growth). The star formation efficiencies have been chosen to reproduce the observations - including those in local ellipticals - and are not considered as free parameters in the remainder of the paper. As discussed also in Matteucci & Pipino (2002) and it is also clear from Fig. 2, as far as the SF histories are concerned, a model with mass in the range is the only one which must be compared to MS1512-cB58, whereas the most massive galaxy should be compared to the host of the QSO J1148+5251. In particular, the star formation rate evolution in Fig. 2 shows the downsizing, namely that massive galaxies have more efficient star formation with a shorter duration than less massive galaxies.
5.2 Dust masses
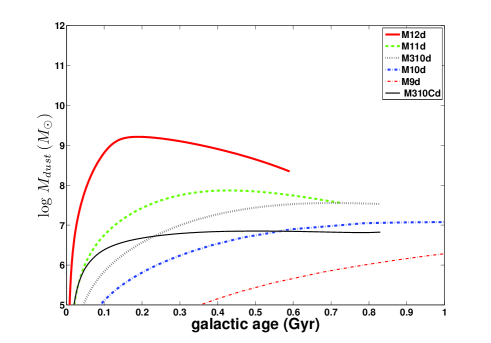
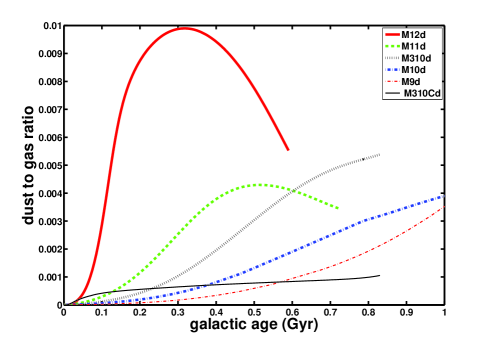
The evolution of the dust mass and of the dust-to-gas ratio are shown in Figs. 3 and 4, respectively. A dust mass-galaxy mass relation, namely that dust content is higher and increases faster in more massive galaxies, is evident. A linear regression analysis yields the following relations
| (9) |
when the dust mass at the peak is considered, whereas
| (10) |
after 0.5Gyr of evolution. Such a relation stems from the SFR-mass relation in Fig. 2 and it is likely to present a redshift evolution similar to the observed one in the mass-metallicity relation (Maiolino et al., 2008). This is a clear and novel prediction of our set of models. Future observations can provide a confirmation of this picture. For the mass case we also show the dust mass which would be obtained by using the prescriptions by Calura et al. (2008, thin solid line) compared to a model with same mass, but the new prescriptions for the dust (dotted line). This latter model will be considered the fiducial case to study the galaxy MS 1512-cB58. The Calura et al. prescriptions yield a faster and earlier increase in the dust mass, due to the larger . At later times, however, the effect of the stronger destruction term hampers further increase in the dust mass as opposed to the model with the new prescriptions. The implications of such a different behavior will be further discussed below by means of the chemical abundance ratios.
5.3 Abundance ratios in the gas
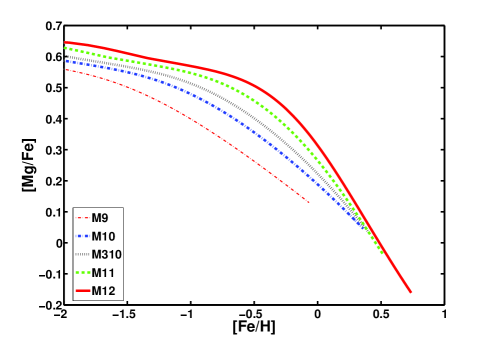
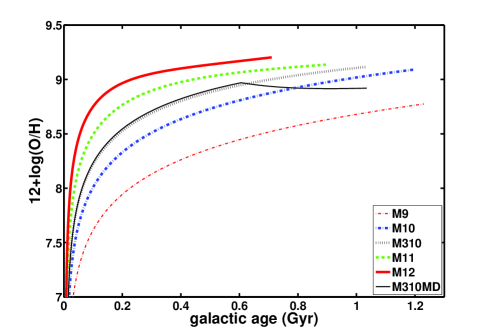
The different timescales of the enrichment processes for (massive star ending as SNe II), and iron (dominated by intermediate mass stars in binary systems ending as SNe Ia) imply an enrichment delay of iron and this explains the evolution of all curves in Fig. 5 (upper panel). If we then compare the various models in Fig. 5 (upper panel) we can see the effect of downsizing very well. Due to the relation between star formation efficiency , infall time scale and the total luminous mass mentioned in §2 , we predict that the [Mg/Fe] ratio in the gas out of which stars form is higher for more massive galaxies. This ensures the fit of the [/Fe] versus mass for ellipticals, as shown by Pipino & Matteucci (2004). Moreover (Fig. 5, lower panel), the increase in the [X/H] with time is much faster and saturates at higher (over-solar) values in the more massive galaxies than in low mass ones. This ensures that, despite more massive galaxies have less time to convert gas into stars, they do it more efficiently than lower mass systems, thus reproducing the mass-metallicity relation that we observe in the stars of local ellipticals, namely a increase of a factor of 3 in the metallicity in the mass range . Until recently, only the mass-stellar metallicity relation (e.g. Thomas et al., 2005) could be measured, namely a relation that is inferred from the integrated light of local ellipticals. While important in constraining the galaxy formation process, such a measure reflects an average metallicity and, hence, does not allow to capture the details of the star formation histories as opposed to the study of the, e.g., O/H ratio versus time. Very recent observations (e.g. Maiolino et al., 2008), provided the opportunity to directly compare model predictions with gas abundances of z3 star forming galaxies. Indeed Calura et al., (2009) find that the observed mass-gas metallicity relation at such high redshift can be explained only by models of elliptical galaxy progenitors as the ones studied here. Here we do not repeat the analysis. Moreover, we show all the models as if they were forming at the same time. In principle, both panels of Fig. 5 can be used as a diagnostic plot for high redshift galaxies: the measurement of the chemical abundance of one element which is not easily dust depleted (like O) and the abundance ratio of two elements which have very similar condensation efficiencies (like Mg and Fe) can immediately tell the age and the mass of the galaxy as well as the past SF history, hence the likely morphology at z=0.
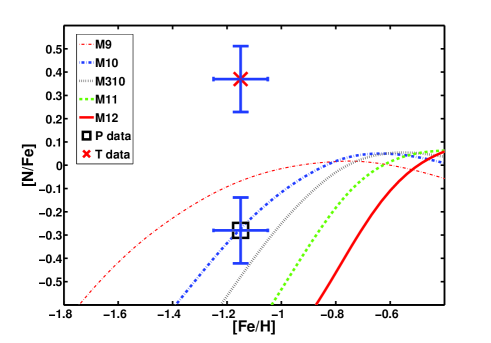
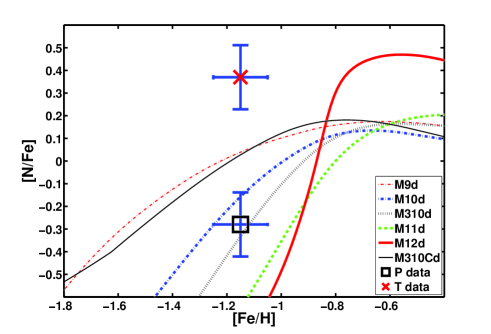
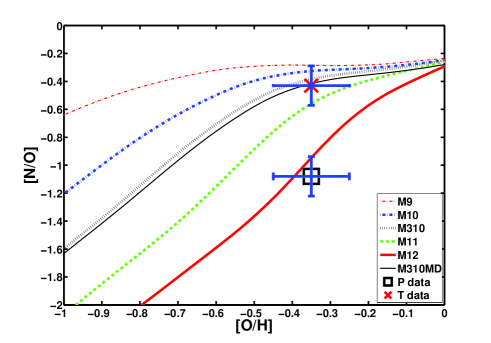
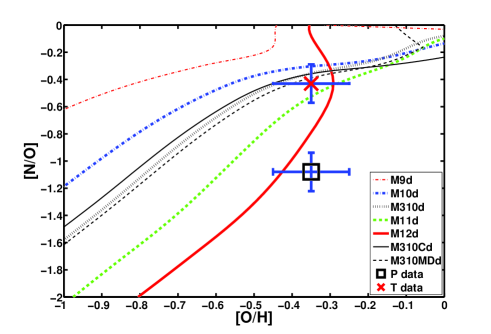
Finally, we show the [N/Fe] (Fig. 6) and [N/O] (Fig. 7) ratios as a function of the metallicity for galaxies of differing masses. The predictions are made for models with (lower panels) and without dust (upper panels). Here we anticipate from the next section the observed values in the galaxy MS 1512-cB58 , since they represent a valuable reference point to guide the eye. These data are taken from Teplitz et al. (2000) (Red Cross, T data, emission lines), Pettini et al. (2002)(Black Square,P data, absorption lines). Only the Pettini et al. data have been used as constraint in our previous works. Here we assume that the two datasets limit the observed region and the [N/Fe] from Pettini et al. as a lower limit which must be necessarily reproduced by the models. From a joint analysis of Figs. 6 and 7 we infer that only models with mass lower than predict the [N/Fe] within the observed range at [Fe/H]=-1.15. On the other hand, only models with mass larger than predict values for the [N/O] ratio consistent with observations. Therefore, in agreement with what has been inferred from the SFR analysis (Fig.2), we will focus on a model to study the galaxy MS 1512-cB58. For this model, the predictions based on the Calura et al. (2008) prescriptions are also shown. Since N is not depleted into dust and O has a very small depletion, both the new and the Calura et al. prescriptions lead to basically identical results in Fig. 7. On the other hand, the change is more evident in Fig. 6. As seen above, in fact, the Calura et al. prescriptions give more dust at earlier times with the net effect of increasing the predicted [N/Fe] ratio by 0.3 dex. At [Fe/H]1.15, nearly 50% of the Fe is locked into dust following the Calura et al. prescriptions, whereas the fraction is only 12% with the new ones.
Here it is worth mentioning that [Fe/H] = -1.15 is attained at 0.05 Gyr in model M11, and at 0.15 Gyr in the M10 case. In other words, at a fixed metallicity [Fe/H] = -1.15, the model M11 has [N/H], whereas the model M10 has [N/H] , hence a much higher [N/Fe]. This happens because the smaller galaxy takes a longer time to attain the same metallicity. A similar explanation holds for the [N/O]-[O/H] diagram. It can be shown that this is a consequence of assuming increasing with mass (i.e.the downsizing), whereas, if one assumes that decreases with mass as in the original monolithic collapse model by Matteucci & Pipino (2002), more massive galaxies will exhibit systematically higher [N/O] values than low mass ones at a fixed [O/H] (see, e.g., Figs. 2 and 4 in Matteucci & Pipino, 2002). Such a difference in the mass dependence of the predicted abundance ratios trends with metallicity is a non trivial effect of downsizing that, to our knowledge, has not been shown elsewhere and still awaits confirmation by observations.
We remind the reader should that the uncertainties in the stellar yields (e.g. Romano et al., 2010) affect the galaxy properties, e.g. the age, that we infer when comparing models to observations and indeed it is difficult to assign a quantitative measure (i.e. an error) to this effect. For instance, since low mass models have a subsolar gas metallicity for most of their evolution, we expect a negligible impact of the mass-loss dependent O yield which seem to be required to explain the abundance pattern in metal rich systems as the Galactic bulge (McWilliam & al. 2008; Cescutti & al. 2009). Indeed, as it can be seen from Figs. 5 and 6, a mass model which differs from the fiducial case only for the C and O yields, modified according to Maeder (1992), does not predict any significant departure in the abundance ratios in the metallicity regime which is relevant for our study. We do see, however, a 0.2 dex lower O abundance (lower panel of Fig. 5) with respect to the fiducial case at times later than 0.6 Gyr. This happens when the metallicity exceeds the solar value (8.7 - Asplund et al., 2005 - in the units used in the figure) and the strong mass loss in the Maeder (1992) yields does not allow the O abundance to increase futher. We will see that this is not the case for the most massive and metal rich objects in Sec. 7. In the next section we show some examples of modifications to N yields. Here we note that not only the yields, but also the prescriptions for binary stars which explode as SNIa may affect our results. We checked that, given the relatively short time needed to attain [Fe/H]-1.2 in the models, most of the Fe has been produced by SNII and changes in the SNIa prescriptions do not really affect the predicted abundance ratios. This can be easily verified by looking at the upper panel of Fig. 5: all the models are still in the plateau phase. Therefore the results in this age/metallicity regime that we will present in Sec. 6 are robust against changes in the SNIa prescriptions. However, we expect more relevant effects at later ages/larger [Fe/H]. Adopting recent observationally motivated prescriptions for both prompt and late SNIa as in Mannucci et al. (2006), the changes in the abundance ratio evolution as a function of [Fe/H] are minimal (c.f. Fig. 8 in Matteucci et al., 2006). If instead, one assumes the Double-Degenerate scenario (Iben & Tutukov, 1984) as opposed to the Single-Degenerate one adopted here, recent work by Greggio (2005) and Valiante et al. (2009b) show that the expected number of SNIa event in the former case, and hence the Fe produced, is much lower than in the latter. Note that, in order to make a meaningful comparison, all the different channels must be constrained to reproduce the observed present-day SNIa rate.
6 The low mass case: comparison with LBGs
In this section we focus on our low mass model in comparison to the class of the LBG galaxies. As noted in the Introduction, MS1512-cB58 is still the best candidate for having an extesive sample of well measured abundance ratios. Therefore, this galaxy will is the best case to test our model.
Absolute abundance evolution usually depends on all the chemical evolution model assumptions, whereas the abundance ratio evolution only depends on stellar yields, stellar lifetimes, and IMF. Therefore, abundance ratios can be used as cosmic clocks if they involve two elements enriching the ISM on quite different timescales, such as and ratios. These ratios, when plotted as functions of metallicity tracers such as [Fe/H], allow us to clarify the particular star formation history (see Matteucci 2001).
6.1 [N/O] and [N/Fe] ratio
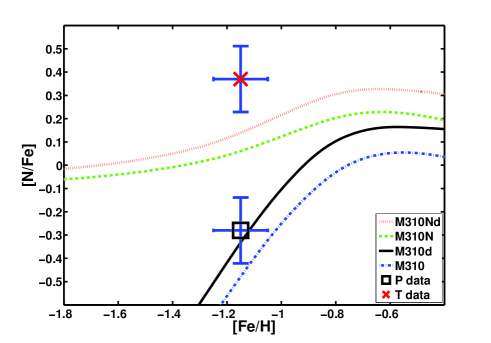
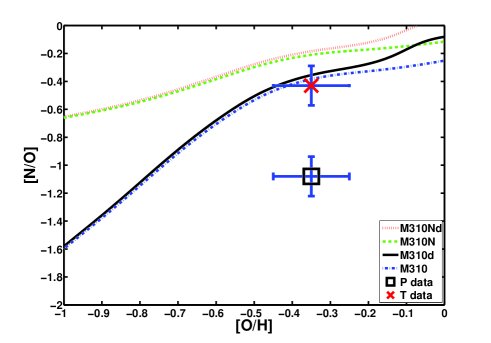
As shown by Matteucci & Pipino (2002), it is useful to study the abundance ratio of a refractory element (like Fe) to an undepleted one (like N) in order to measure the amount of dust depletion for the Fe-peak elements. In Fig. 8 we show the predictions from the galaxy model with different prescriptions regarding the dust and the N primary production. Fig. 8 shows that in order to predict a value for [N/Fe] in the observed range, dust depletion is needed, although such a conclusion suffers from a degeneracy with the N production. Nitrogen is generally considered mainly a secondary element, in the sense that N needs the C and O, originally present in the star, to be created during the CNO burning cycle. However, N can also be produced as a primary element in some special situations, such as in AGB stars (Renzini & Voli, 1981; Van den Hoeck & Groenewegen, 1997; Marigo 2001) and massive rotating stars (Meynet & Maeder, 2002). In fact, the C and O going to form N are not the original ones present in the gas out of which the star formed, but they have been synthesized by the star itself. In the two different cases N production changes significantly, especially at low metallicities. From a look at Figure 9 we can derive the following considerations: it is difficult to say whether the N is primary or secondary in massive stars. First of all because Fe is depleted into dust and second because of the discrepancy between the N measured from emission and absorption lines. On the other hand, Figure 10 can give more indications. In particular, it seems that assuming primary N from massive stars overproduces N with respect to O in the gas by more than a factor of three. On the other hand, the model which best reproduces the [N/Fe] value from Pettini et al. (2002), namely the fiducial model with dust and without primary N, is offset by Pettini et al.’s [N/O] ratio by 0.8 dex. Here we add that at [Fe/H]=-1.15 the model has an age of 100 Myr, therefore we confirm that MS 1512-cB58 must be young.
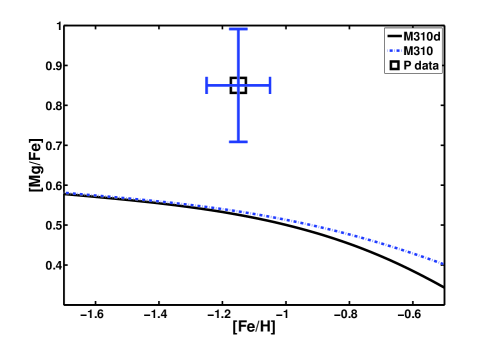
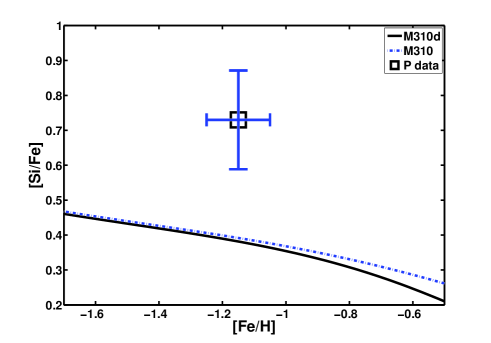
6.2 to iron ratios
Fig. 10 and Fig. 11 show the predicted [Mg/Fe] and [Si/Fe] vs. [Fe/H] compared to observational data for the LBG MS 1512-cB58 (Pettini et al. 2002). Our predicted [Mg/Fe] and [Si/Fe] ratios are still lower than observed in MS 1512-cB58. On the other hand, the predicted values are higher by 0.2 dex than predicted by Matteucci & Pipino (2002), because the yields adopted in this work consider a sligthly higher Mg production from massive stars with respect to the Woosley & Weaver (1995) yields (namely the yields adopted by Matteucci & Pipino, 2002). Note that in the so-called “horseshoe” LBG (Quider et al., 2009), the Si/Fe ratio is very close to the one observed in cB58, thus confirming the discrepancy between theory and observations. We do not believe that the discrepancy could indicate a problem related to too low Mg and Si yields in the adopted nucleosynthesis, since a [Mg/Fe] 0.6 dex in the gas for a large fraction of the galaxy evolution would imply [Mg/Fe] 0.3-0.4 dex, which exceeds the observed value observed in present day low mass ellipticals.
When the metallicity is measured from the photospheric absorption features of the stellar light (Rix et al., 2004), instead, the [Fe/H] is 1.5-4 times higher than those reported by Pettini et al. (2002), hence there is the possibility that this disagreement originates from the dust, i.e. a possibility could be that in MS 1512 -cB58 Si and Mg are not as depleted as much as Fe, at variance with our prescriptions. For instance, if we leave =0.08 as prescribed by the new model presented in this paper and increase to 0.5, we predict [Mg/Fe]=0.75 and [Si/Fe]=0.6 at [Fe/H]=-1.15, hence formally in agreement with the observed value, within the error. This, however, cannot be justified on theoretical grounds since we assume the same efficiencies for Mg, Si and Fe because they have nearly the same condensation temperature (see Calura et al.2008 for details). However, such a differential depletion effect, which is known to affect the abundance pattern of the cold gas in Damped Lyman Alpha systems (Vladilo 2002, Calura et al. 2003), could partially alleviate the discrepancies between models and observations. The difference between predicted and observed values is not so evident in the Si/C abundance in QSOs (see below).
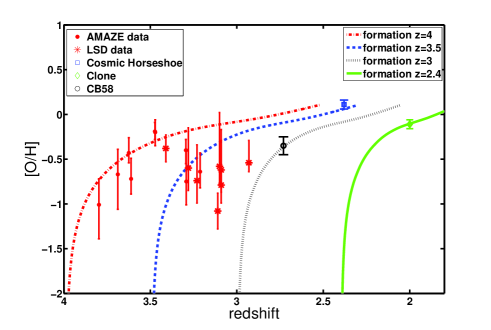
6.3 The O/H ratio and the age of LBGs
Finally, in Fig. 12 we show the predicted age-oxygen relation for Lyman-break galaxies, compared with the recent data from Maiolino et al. (2009, AMAZE), Mannucci et al. (2009, LSD), Hainline et al. (2009) and Teplitz et al. (2000). Here we obtain a good fit to the data if we assume a galaxy formation redshift for these galaxies in the redshift interval 2.3-4. Note that all the galaxies have masses around a few 10, therefore the inferred spread in the formation epoch can be understood as the redshift range in which low mass ellipticals form. In particular, the curve which gives the best agreement with MS 1512-cB58 data in Fig. 12 requires a formation redshift z3, that is, in the standard LCDM cosmology, an age of at least 0.2 Gyr (we recall that MS 1512-cB58is at z=2.73). A similar conclusion can be reached from the analysis of Fig. 2, where the best agreement with the observed SFR is obtained at ages larger than 0.2 Gyr. However, given the uncertainties in the observational values and the flat trend with time in the predicted one, such a constraint is rather weak. Finally, we showed above that the time at which our model reaches the metallicity [Fe/H]=-1.15 is 0.1 Gyr, again hinting for a very young age for the galaxy MS 1512-cB58 .
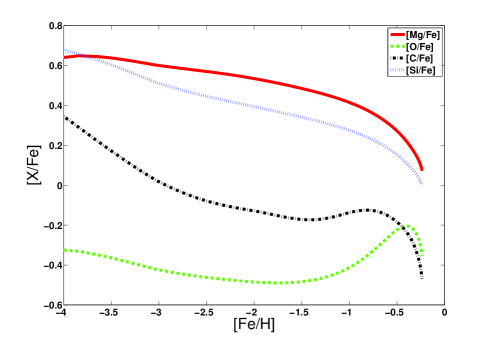
6.4 Abundance ratios in the dust
Finally, in Fig. 13 we show the predicted abundance ratios in the dust for the lowest (M9d) and highest (M12d) mass cases compared to an intermediate mass one (M310d). The high [Mg/Fe] and [Si/Fe] are easily explained by the fact that Mg, Si and Fe have similar condensation efficiencies, therefore the abundance ratios in the dust mirror those in the gas. On the other hand O - the dominant metal in the gas - is underabundant with respect to Fe in the dust. In passing, we note that the trend in the dust [Mg/Fe], [Si/Fe] and [O/Fe] ratios versus [Fe/H] does not significantly with the galaxy mass. We stress that these are actual predictions of the models which await observational confirmation and, if so, will help in understanding the abundance pattern in high redshift galaxies.
7 The high mass case: comparison to a QSO host
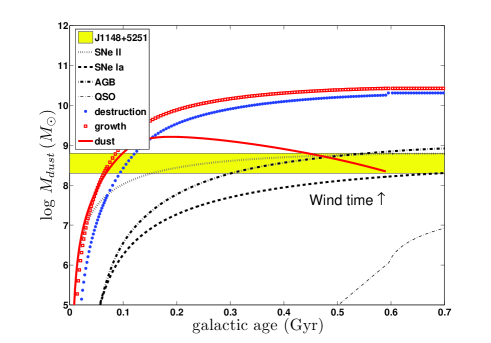
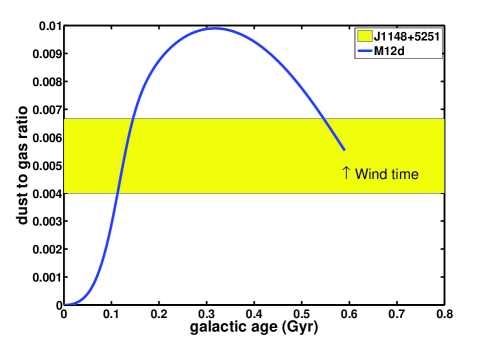
In this section we apply our model to the challenging case of the J1148+5251 host galaxy. In the first place, we note that our model predicts a stellar mass of and a gas mass of within 2.5 kpc (i.e. 1/4 ) in agreement with the observations within the same aperture (e.g. Wang et al., 2010). The predicted BH mass at the onset of the galactic wind is , as required by observations (e.g. Barth et al., 2003). In the upper panel of Fig. 14 we show the predicted dust mass as a function of galactic age and compare it with the observed dust mass (shaded area). The model, which has been calibrated on the LBGs and present-day properties of ellipticals, does reproduce the necessary amount of dust mass at Gyr. The fact that the dust content is even higher at earlier times is perhaps suggestive of the evolution from a relatively long period of dust enshrouded star formation to a phase in which stellar + AGN driven winds make the galaxy visible and the QSO shine. Similar conclusions can be derived by using the predicted dust-to-gas ratio (Fig. 15).
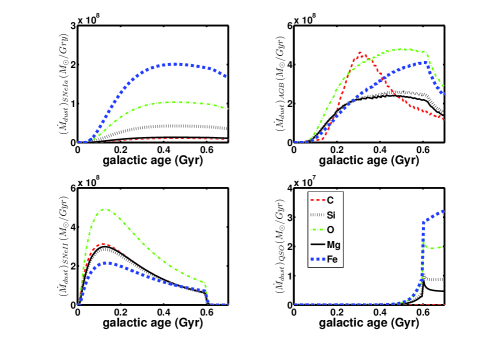
We now turn our attention to the details of the dust production. In Fig. 14 (upper panel) we also show the cumulative mass of dust produced by each single channel (including the dust growth) as well as the total mass of dust destroyed. As it happens in the solar vicinity (Calura et al., 2008), dust growth and destruction dominate at times larger than 0.1 Gyr. The QSO production seems to be relatively unimportant. However, we must stress that while SNII production stops and the dust growth is strongly suppressed after the galactic wind, the QSO dust production rate should be at its maximum, as shown in Fig. 16, at the time of the galactic wind. It is also important to stress that the QSO dust should be confined to the very central regions of the galaxy, whereas the dust ejected by SNe Ia and AGBs will be more diffuse, therefore the QSO is likely to be the dominant source right after the galactic wind in the inner regions of the galaxy.
Although similarly high dust masses have been observed in other high redshift QSOs (Beelen et al., 2006), J1148+5251is interesting because at its redshift in the favored cosmology, the star formation, BH growth and dust production can be reproduced only assuming a very fast evolution. Several other authors have attempted to reproduce the observed dust mass: some (e.g. Dwek et al., 2007a) claim that the host galaxy is too young to have had any AGB contribution to the dust, whereas others (e.g. Valiante et al., 2009a) claim that AGB stars are actually a viable channel. Moreover, the observed dust mass might be consistent with QSO production (see Maiolino et al, 2006). However, it is rather difficult to make detailed comparison between different models because of their different assumptions.
For instance, Valiante et al. (2009a) do not consider dust growth, have a less efficient destruction (since they do not take into account SNe Ia), but adopt much smaller dust depletion efficiencies. Dwek et al. (2007a) assumed that, owing to the young ( 0.5 Gyr) inferred age of the host galaxy, only SNII contribute to the dust production and neglected the role of AGB. According to stellar evolution theory, instead, intermediate mass stars evolve out of the main sequence after just 30 Myr. Therefore, we argue that Dwek (2007)’s assumption is too simplistic (see also Valiante et al., 2009a) and a more detailed models of chemical evolution as the one used in this paper is required to assess the AGB contribution. On the other hand, our fiducial model needs only 0.6 Gyr to reproduce dust, stellar, gas and QSO masses at the redshift (6.4) at which we observe J1148+5251. Such a time lapse would imply a (maximum) formation redshift of 13. This is the value that we adopt for our model, so that redshift 6.4 corresponds to . We note that the predicted dust mass for our fiducial model crosses the region of the observed values in Fig. 14 also at earlier times (0.05 Gyr) which would imply - in the current favoured cosmology - a (minimum) formation redshift of 6.8. Finally, according to Fig. 2, the predicted SFR crosses the observed value at 0.4 Gyr, hence implying a formation redshift of 10.
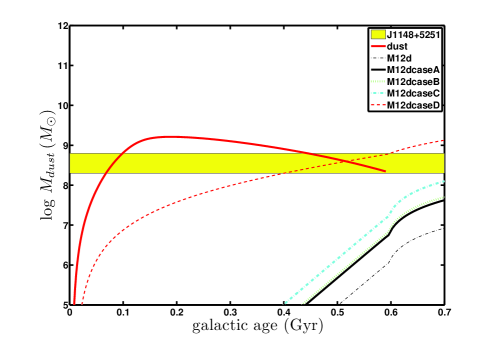
In a sense, our predictions give lower limits to the QSO contribution, which can be higher if either the BH “seed” is larger and pre-existing to the galaxy or the growth is super-Eddington in the very early stages and quieter near the time of the galactic wind. Such a situation is depicted in the lower panel of Fig. 14, where the fiducial QSO production (dot-dashed line) adopted here is compared to other cases to show the sensitivity to our different assumptions. The main properties are summarized in Table 1. Case A (solid line) shows the case in which we consider the metallicity of the region where the QSO dust forms 0.8 dex higher than the mean metallicity predicted by our model. This is because BLRs exhibit metallicities up to 10 times the solar value, whereas our model predicts the average gas metallicity of the central zone to be twice than solar. Such a change in metallicity increases the QSO dust mass by about one order of magnitude. A similar change can be achieved if we take into account the fact that the BH-to-stellar mass ratio is a factor of 2 higher at high redshift with respect to the local one (Case B, dotted line, e.g. Walter et al., 2004, Maiolino et al., 2007, Lamastra et al., 2010, Merloni et al., 2010, Wang et al. 2010, but see Willott et al., 2010). To take into account the uncertainty in the BH-to-stellar mass ratio at high redshift, we make an additional model in which this ratio is a factor of 4 higher than the local value (Case C, light dot-dashed line). It is worth noting that in both Case B and C the final predicted is still consistent with observations, within the uncertainties. Finally, Case D is a model in which we switch off the dust production from stars and assume that all the dust seen at has been produced by the QSO. As it can be inferred from comparing the fiducial model to cases A, B, C and D, even if the QSO is the only source of dust, there will still be degeneracy between the accretion timescale, the initial BH seed mass and the metallicity of the clouds where the dust forms. The purpose of model M12caseD is, therefore, to give just an example and show that a QSO alone might produce enough dust if, for instance, we start from a quite high seed mass (), while the accretion timescale (0.49 Gyr) is 10 times longer than the adopted one in the fiducial case. Such a situation mirrors the state of the art: the channels for dust production are many, and their relative role cannot be constrained by using only the observed dust mass.
7.1 The QSO abundance ratios
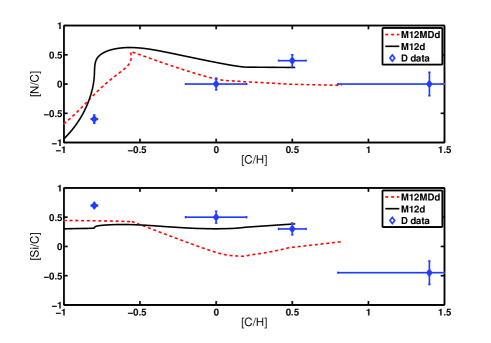
D’Odorico et al. (2004) determined C, N and -element relative abundances in the gas surrounding six QSOs (from the NLR) at an average redshift of 2.4, by studying six narrow associated absorption systems in Ultraviolet Visual Echelle Spectrograph (UVES) high-resolution spectra. They found five systems with a metallicity (measured by C/H) consistent with or above the solar value. They also found a possible correlation of [N/C] with [C/H] and an anticorrelation of [Si/C] vs. [C/H]. They suggested that to explain such abundance ratios the chemical enrichment in the host galaxy had to be very fast, not longer than 1 Gyr. This conclusion is in agreement with a previous work by Matteucci & Padovani (1993) who reproduced the abundaces measured in the BLR of QSOs, in particular the oversolar Fe abundance and solar O abundance by means of a model of a large elliptical suffering a strong burst of star formation. In particular, the high [Fe/Mg] ratio claimed in some objects was interpreted as the value in the gas around the QSO after star formation has stopped. In fact, in such a situation, -elements are no more produced whereas Fe and N, formed in low and intermediate mass stars, are continuously produced, thus creating a situation where N and Fe are oversolar and the elements are solar. Our model predicts oversolar [Mg/Fe] for the dominant stellar population and undersolar [Mg/Fe] in the gas after the galactic wind, in particular the average ratios after the galactic wind in the gas are [Mg/Fe]-0.2 dex. That explains also the almost constant metal content in QSOs at all redshifts and consequently the similar metallicities found in BLR at high redshift and in NLR at lower redshift (e.g. Nagao et al., 2006a, 2006b, Juarez et al., 2009): most of the evolution in these objects has occurred at very ealy epochs where SNe II produced most of the metals. After star formation stopped due to either galactic winds (Matteucci & Padovani 1993) or AGN feedback (Romano et al. 2002), the SNe Ia produced the bulk of Fe and low mass stars the bulk of N which kept increasing for a while and then settled on a rather constant value due to the decrease of Fe an N producers with time (no star formation takes place). In Fig. 17 we show our predictions (solid line) for [N/C] and [Si/C] versus D’Odorico et al.’s data. There is good agreement with the observational trends. A marginal agreement (within ) with the high [C/H] observed in QSOs (exceeding dex) can be obtained only by adopting the Maeder (1992) yields with mass loss from massive stars (dotted lines), which allow the model to reach [C/H] values slightly larger than 0.8 dex. With normal yields (e.g. Woosley & Weaver 1995) we would no go beyond [C/H]=+0.5 dex.
This result confirms that of Cescutti & al. (2009) who found that the Galactic bulge high C abundances can be reproduced only by adopting yields from massive stars with mass loss strongly dependent on metallicity.
8 Conclusions
In this paper we have studied the evolution of several chemical elements (C, N, O, Si, Mg, Fe) both in the gas and in the dust in elliptical galaxies of different masses (from to ). Our aim was to study the evolution of gas and dust at high redshift and the effect of different environments. We assumed that dust is produced in: i) SNe II, ii) SNe Ia, iii) AGB stars and iv) QSOs. We took into account also dust destruction and accretion. These models will help up-coming observations of distant objects in quantifying their morphologies, past SFR and mass by means of abundances and abundance ratios, as well as the role of the dust in the measurement of the above quantities. In particular, our general predictions are that:
-
•
The downsizing implies that at [Fe/H] the most massive objects have lower [N/Fe] ratios than the lower mass ones, irrespective of the presence of dust. The same is true for the [N/O] ratios in a broader range of metallicities.
-
•
A dust mass-stellar mass relation exists, with more massive galaxies attaining a higher dust content at earlier time. Thererefore the expected evolution is similar to the observed high redshift evolution of the mass-metallicity relation.
These predictions await confirmation from future observations. In order to test the model we compared our results for the lower mass galaxies with LBG galaxies and for the highest mass limit with QSOs. In particular, we compared our model for LBGs also with the specific galaxy MS 1512-cB58. Unfortunately, the observed abundance ratios from different authors show very different values. Our predicted [N/Fe] ratio assuming no primary production of N from massive stars and with dust reproduces very well tha data of Pettini & al. (2002). On the other hand, the model assuming dust and primary N production from massive stars predicts the [N/Fe] ratio in very good agreement with the data of Teplitz et al. (2000). Therefore, no conclusions can be drawn on this point.
As far as these specific class of objects are concerned, our findings can be summarized as follows:
-
•
LBG galaxies are likely to be young ellipticals of intermediate mass() experiencing moderate SFR and galactic winds. Our elliptical model for well reproduces the [O/H] abundance as a function of redshift for the LBG galaxies. Our model implies a redshift of formation for these galaxies in the range.
-
•
The predicted [Mg/Fe] and [Si/Fe] ratios have been compared with data for MS 1512-cB58 by Pettini & al. (2002) and the theoretical values are lower than the observed ones, perhaps indicating that too low a fraction of Fe is predicted to be in dust.
-
•
From the comparison of our model results for a massive elliptical () with one of the most distant QSO ever observed J1148+5251, we derived a redshift of formation for this object (and likely larger than 10).
-
•
The predicted total amount of dust is in good agreement with the dust seen in this QSO. We tested also the hypothesis that the QSO itself produced dust but this production appears negligible compared to that from stellar sources, unless one focuses on the very central regions at times very close to the galactic wind onset. Future observations can provide better constraints to the QSO dust model.
-
•
We also compared our model results for QSO hosts with data from NLR in QSO hosts and we found a good agreement for [N/C] versus [C/H] and [Si/C] versus [C/H]. The very high C abundance observed in these QSOs can be explained only by assuming yields with mass loss from massive stars with a strong dependence on metallicity, as those of Maeder (1992).
9 Acknowledgments
We thank the anonymous referee for comments which improved the quality of the presentation. AP acknowledges useful discussions with G.Cescutti, M.Elvis, A.Shapley and R.Valiante and thanks K. Kornei for a careful reading of the paper. AP receives support from Italian Space Agency through contract ASI-INAF I/016/07/0 F.M acknowledges financial support from PRIN2007 MIUR (Italian Ministry of Scientific Research) project Prot. no. 2007JJC53X-001.
References
- Asplund et al. (2005) Asplund, M., Grevesse, N., & Sauval, A. J. 2005, Cosmic Abundances as Records of Stellar Evolution and Nucleosynthesis, 336, 25
- Arimoto Yoshii (1987) Arimoto, N., Yoshii, Y. 1987, AA, 173, 23
- Becker et al. (2006) Becker,G. D., Sargent, W.L.W., Rauch, M., Simcoe, R.A., 2006, ApJ, 640, 69
- Barth et al (2003) Barth, A. J., Martini, Paul; Nelson, Charles H., & Ho, Luis C. 2003, ApJ, 594,95
- Beelen et al. (2006) Beelen, A., Cox, P., & Benford, D. J., et al. 2006, ApJ, 642, 694
- Bertoldi et al. (2003a) Bertoldi, F., Carilli, C. L., Cox, P., et al. 2003a, A&A, 406, 55
- Bertoldi et al. (2003b) Bertoldi, F., Cox, P., Neri, R., Carilli, C. L., et al. 2003b, A&A, 409, 47
- Bianchi Schneider (2000) Bianchi, S., & Schneider, R., 2007, MNRAS, 378, 973
- Calura et al. (2008) Calura F., Pipino A., & Matteucci F. 2008, AA, 479, 669
- Calura, Matteucci, & Vladilo (2003) Calura F., Matteucci F., Vladilo G., 2003, MNRAS, 340, 59
- Carilli et al (2004) Carilli, C. L., Walter, F., Bertoldi, F., et al. 2004, AJ, 128, 997
- Cescutti et al (2009) Cescutti, G., Matteucci, F., McWilliam, A., & Chiappini, C. 2009, A&A, 505, 605
- Dessauges-Zavadsky et al (2010) Dessauges-Zavadsky, M.; D’Odorico, S.; Schaerer, D.; Modigliani, A.; Tapken, C.; Vernet, J. 2010, A&A, 510, 26
- D’Odorico et al. (2004) D’Odorico, V., Cristiani, S., Romano, D., Granato, G. L., & Danese, L. 2004, MNRAS, 351, 976
- draine (79) Draine, B. T., & Salpeter, E. E. 1979, ApJ, 231, 438
- draine (1990) Draine, Bruce T., 1990, ASPC, 12, 193
- dunne (2000) Dunne L., Maddox, S. J., Ivison, R. J., et al. 2009, MNRAS, 394, 1307
- Dwek (1998) Dwek, E. 1998, ApJ, 501, 643
- Dwek et al. (2007a) Dwek E., Galliano F., & Jones A.P. 2007a, ApJ, 662,927
- Dwek et al. (2007b) Dwek, E., Galliano, F., & Jones, A. P. 2007b, NCimB, 122, 959
- Elvis et al. (2002) Elvis, M., Massimo M. & Margatrita K. 2002, ApJ, 567,107
- Fan et al (2003) Fan, X.; Strauss, M. A., Schneider, D. P., et al. 2003, AJ, 125, 1649
- ferra (2000) Ferrarese, L., C t , P., in ’Black Holes from Stars to Galaxies – Across the Range of Masses.’ Edited by V. Karas and G. Matt., Cambridge University Press, 2007., pp.261-268
- ferrarottiet al (2004) Ferrarotti, A. S.; Gail, H. P., 2006, A&A, 447, 553
- Flagey (2006) Flagey, N., Boulanger, F., Verstraete, L., Miville Desch nes, M. A., Noriega Crespo, A., Reach, W. T., 2006,A&A, 453,969
- Francois et al (2004) Francois, P., Matteucci, F., Cayrel, R., et al. 2004, A&A, 421, 613
- gomez (2000) Gomez, H. L., Dunne, L., Ivison, R. J., et al. 2009, MNRAS, 397, 1621
- Greggio & Renzini (1983) Greggio, L., Renzini, A. 1983A&A, 118, 217G
- greggio (05) Greggio, L., 2005, A&A, 441, 1055
- Hainlineet al (2009) Hainline, K. N., Shapley, A. E., Kornei, et al. 2009, ApJ, 701, 52
- Helmhamdiet al (2003) Helmhamdi, A. et al., 2003 MNRAS, 338, 939
- iben (84) Iben, I., Jr.,& Tutukov, A. V., 1984, ApJS, 54, 335
- Inoue (2003) Inoue A. K. 2003, PASJ, 55, 901
- Iwamoto et al. (1999) Iwamoto K., Brachwitz F., Nomoto K., et al. 1999, ApJS, 125, 439
- Iwamuro et al. (2004) Iwamuro, F., Kimura, M., Eto, S., et al. 2004, ApJ, 614, 69
- Joneset al. (1994) Jones, A. P.; Tielens, A. G. G. M.; Hollenbach, D. J.; McKee, C. F. 1994, ApJ, 433, 797
- Juarezet al. (2008) Juarez, Y., Maiolino, R.,& Maujica, R. et al. 2009, A&A, 494, 25
- Kotaket al (2009) Kotak, R., Meikle, W. P. S., Farrah, D., et al. 2009, ApJ, 704, 306
- Kozasa et al. (2009) Kozasa, T.; Nozawa, T., Tominaga, N., et al. 2009, arXiv:0903.0217
- Krumholzet al (2006) Krumholz, M. R., Matzner, C. D., & McKee, C. F. 2006, ApJ, 653, 361
- lama (2000) Lamastra, A., Menci, N., Maiolino, R., Fiore, F., Merloni, A., arXiv:1001.5407
- Maeder (1992) Maeder, A. 1992, A&A, 264, 105
- mm02 (2002) Meynet, G., Maeder, A. 2002, A&A, 381, 25
- Maiolino et al. (2004) Maiolino, R., Schneider, R., Oliva, E., et al. 2004, Nature, 431, 533
- Maiolino et al (2005) Maiolino, R., Cox, P., Caselli, P., et al. 2005, A&A , 440, 51
- Maiolino et al. (2006) Maiolino, R., Nagao, T., Marconi, A., et al. 2006, Mem.S.A.It. 77, 643
- Maiolino et al. (2006) Maiolino, R., R., Neri, R., Beelen, A, et al. 2007, A&A, 472, 33
- Maiolino et al (2008) Maiolino, R., Nagao, T., Grazian, A., et al. 2008, A&A, 488, 463
- Mannucciet al (2006) Mannucci, F., Della Valle, M., & Panagia, N. 2006, MNRAS, 370, 773
- mann (2000) Mannucci, F., Maoz, D., Sharon, K., et al. 2008, MNRAS, 383, 1121
- mann (2000) Mannucci, F., Cresci, G., Maiolino, R., et al. 2009, MNRAS, 398, 1915
- Marigo (2001) Marigo, P. 2001, A&A, 370, 194
- Markwick-Kemper (2007) Markwick-Kemper, F., Gallagher, S. C., Hines, D. C., & Bouwman, J. 2007, ApJ, 668, 107
- Martinelli et al. (2000) Martinelli, A., Matteucci, F. & Colafrancesco, 1998, MNRAS, 298, 42
- Martinelli et al. (2000) Matsuoka, K.; Nagao, T.; Maiolino, R.; Marconi, A.; Taniguchi, Y. 2009, A&A, 503, 721
- Matteucci Greggio (1986) Matteucci Greggio 1986, A&A, 154, 279
- Matteucci Padovani (1993) Matteucci, F., & Padovani, P. 1993, ApJ, 419, 485
- MR (2000) Matteucci, F. & Recchi, S., 2001, ApJ, 558, 351
- Matteucci (1994) Matteucci, F. 1994, AA, 288, 57
- Matteucci (2001) Matteucci, F., 2001, The chemical evolution of the Galaxy, Astrophysics and space science library, Volume 253, Dordrecht: Kluwer Academic Publishers
- Matteucci Pipino (2002) Matteucci, F., & Pipino, A. 2002, ApJ, 569,69M
- McKee (1989) McKee C. F., 1989, in Allamandola L. J., Tielens A. G. G. M., eds, Interstellar Dust, Proc. IAU Symposium 135. Kluwer, Dordrecht, p. 431
- McWilliamet al (2008) McWilliam, A., Matteucci, F., Ballero, S., Rich, R. M., Fulbright, J. P., & Cescutti, G. 2008, AJ, 136, 367
- Meikle WPS (2007) Meikle, W. P. S., Mattila, S., Pastorello, A., Gerardy, C. L., Kotak, R., Sollerman, J., Van Dyk, S. D., & Farrah, D., et al.2007, ApJ, 665 608
- merl (2002) Merloni, A., Bongiorno, A., Bolzonella, M., et al. 2010, ApJ, 708, 137
- Morganet al. (2003) Morgan, H. L.; Dunne, L.; Eales, S. A.; Ivison, R. J.; Edmunds, M. G. 2003, ApJ, 597, 33
- nagao et al. (2008) Nagao, T.; Maiolino, R.; Marconi, A. 2006, A&A, 447, 863
- nagao et al. (2008) Nagao, T.; Marconi, A.; Maiolino, R. 2006, A&A, 447, 157
- Nozawa et al. (2008) Nozawa, T., Kozasa, T., Umeda, H., Hirashita, H., Maeda, K., Nomoto, K., Tominaga, N., & Habe, A. 2008, arXiv0812.1448
- Padovani & Matteucci (1993) Padovani, P., & Matteucci, F. 1993, ApJ, 416, 26
- Pettini et al. (2002) Pettini, M., Rix, S.R., Steidel, C.C., Adelberger, K.L., Hunt, M.P.,& Shapley, A.E. 2002, ApJ, 569 , 742
- Pettini et al. (2001) Pettini, M., Steidel, C. C., Adelberger, K. L., Dickinson, M., & Giavalisco, M. 2000, ApJ, 528, 96
- Pipino Matteucci (2004) Pipino, A., Matteucci, F. 2004, MNRAS, 347, 968
- pip (2002) Pipino, A., D’ercole, A., Matteucci, F 2008 A&A, 484, 679
- Proga et al (2000) Proga, D., Stones, J. M., & Kallman, T. R. 2000, ApJ, 543, 686
- Quider et al (2009) Quider, Anna M.; Pettini, Max; Shapley, Alice E.; Steidel, Charles C.2009, MNRAS, 398, 1263
- Quider et al (2010) Quider, Anna M.; Shapley, Alice E.; Pettini, Max; Steidel, Charles C.; Stark, Daniel P. 2010, MNRAS, 402, 1467
- Reddyiet al (2008) Reddy, N.A. et al. 2008, ApJS, 175, 48
- Renziniet al (1981) Renzini, A., & Voli, M. 1981, A&A, 94, 175
- Rho Jet al (2008) Rho, J., Kozasa, T., Reach, W. T., Smith, J. D., Rudnick, L., DeLaney, T., Ennis, J. A., Gomez, H., & Tappe, A. 2008, ApJ, 673, 271
- Rho, J.et al (2009) Rho, J., Reach, W. T., Tappe, A., Hwang, U., Slavin, J. D., Kozasa, T., & Dunne, L. 2009, ApJ, 700, 579
- rix (04) Rix, S. A., Pettini, M., Leitherer, C.; Bresolin, F., Kudritzki, R., & Steidel, C. C., 2004, ApJ, 615, 98
- Robson et al (2004) Robson, I., Priddey, R. S., Isaak, K. G., & McMahon, R. G. 2004, MNRAS, 351, 29
- Romano et al (2002) Romano, Donatella; Silva, Laura; Matteucci, Francesca; Danese, Luigi
- Renziniet al (1981) Romano, D., Karakas, A.I, Tosi, M., Matteucci, F., 2010, submitted arXiv:1006.5863
- Priddeyet al (2003) Priddey, R. S., Isaak, K. G., McMahon, R. G., Robson, E. I., & Pearson, C. P. 2003, MNRAS, 344, 74
- Salpeter (1955) Salpeter, E. E. 1955, ApJ, 121, 161S
- Schaerer & Verhamme (2008) Schaerer, D., & Verhamme, A. 2008, A&A, 480, 36
- Schurer et al. (2009) Schurer, A., Calura, F., Silva, L., Pipino, A., Granato, G. L., Matteucci, F., & Maiolino, R. 2009, MNRAS, 394, 2001
- Seitzet al (1998) Seitz, S., Saglia, R. P., Bender, R., Hopp, U., Belloni, P., & Ziegler, B. 1998, MNRAS, 298, 945
- Shapley et al. (2003) Shapley, A. E., Steidel, C. C., Pettini, M., & Adelberger, K. L. 2003, ApJ, 588,65
- Shapley et al. (2001) Shapley, A. E., Steidel, C. C., Adelberger, K. L., Dickinson, M., Giavalisco, M., & Pettini, M. 2003, ApJ, 562, 95
- Steidelet al (1996a) Steidel, C. C., Giavalisco, M., Dickinson, M., & Adelberger, K. L. 1996, AJ, 112, 352
- Steidelet al (1996b) Steidel, C. C., Giavalisco, M., Pettini, M., Dickinson, M., & Adelberger, K. L. 1996, ApJ, 462, 17
- suger (2002) Sugerman, B.E.K et al. 2006, Science 313, 196.
- savage (1996) Savage, B. D., & Sembach, K. R. 1996, ARA&A, 34, 279
- Takaya (2008) Nozawa, T., Kozasa, T., Habe, A., Dwek, E., Umeda, H., Tominaga, N., Maeda, K., Nomoto, K. 2008, ApJ, 684, 1343
- Takaya (2008) Nozawa, T., Kozasa, T., Tominaga, N., Maeda, K., Umeda, H. Nomoto, K., Krause, O. 2010, ApJ, 713, 356
- Takeuchi & Ishii (2004) Takeuchi, T.T., & Ishii, T.T. 2004, A&A, 426, 425
- Teplitz et al. (2000) Teplitz, H. I., McLean, I. S., Becklin, E. E., Figer, D. F., Gilbert, A. M., Graham, J. R., Larkin, J. E., Levenson, N. A., et al.2000, ApJ, 533, 65
- Thomaset al (2002) Thomas, D., Maraston, C., & Bender, R. 2002, Ap&SS, 281, 371
- Thomaset al (2005) Thomas, D., Maraston, C., Bender, R., & Mendes de Oliveira, C. 2005, ApJ, 621, 673
- thornton (1998) Thornton, K., Gaudlitz, M., Janka, H.-Th., & Steinmetz, M., 1998, ApJ, 500, 95
- Valiante et al. (2009a) Valiante, R., Schneider, R., Bianchi, S., & Andersen, A. C. 2009, MNRAS, 397, 1661
- Valiante et al. (2009b) Valiante, R., Matteucci, F.; Recchi, S.; Calura, F. 2009, NewA, 14, 638
- Van den Hoek & Groenwegen (1997) Van den Hoek L. B. & Groenwegen M. A. T. 1997, A&AS, 123, 305
- Vijh et al. (2003) Vijh, U. P., Witt, A. N., & Gordon, K. D. 2003, ApJ, 587, 533
- Vladilo (2002) Vladilo G., 2002, A&A, 391, 407
- Walter et al. (2004) Walter, F., Carilli, C., Bertoldi, F., Menten, K., Cox, P., Lo, K. Y., Fan, X., & Strauss, M. A. 2004, ApJ, 615, 17
- Wang et al. (2008) Wang, R., Carilli, C. L., Wagg, J., Bertoldi, F., Walter, F., Menten, K. M., Omont, A., Cox, P., et al.2008, ApJ, 687, 848W
- Wang et al. (2008) Wang, R., Carilli, C. L., Neri, R. et al. 2010, arXiv:1002.1561
- whelanet al (1973) Whelan, J., & Iben, I. J. 1973, ApJ, 186, 1007
- whelanet al (1973) Willott, C.J., McLure, R.J., Jarvis, M.J. 2003, ApJ, 587, 15
- whelanet al (1973) Willott, C.J., et al. 2010, ApJ submitted, arXiv:1006.1342
- Woosley et al. (1995) Woosley, S.E., & Weaver, T.A. 1995, ApJS, 101, 181
- Zhukovska et al. (2009) Zhukovska, S., Gail, H.-P., & Trieloff, M. 2008, A&A, 479, 453