Probing Stellar Populations at z 7 – 8
Abstract
In this proceeding we present the results from a study of very high–redshift galaxies with the newly commissioned Wide Field Camera 3 on the Hubble Space Telescope. With the deepest near-infrared data ever taken, we discovered 31 galaxies at 6.3 z 8.6. The rest–frame ultraviolet (UV) colors of these galaxies are extremely blue, showing significant ( 4 ) evolution from z 3, over only 1 Gyr of cosmic time. While we cannot yet diagnose the exact cause of the bluer colors, it appears a low dust content is the primary factor. The stellar masses of these galaxies are less than comparably selected galaxies at 3 z 6, highlighting evolution in the stellar mass of characteristic (L∗) galaxies with redshift. Lastly, the measured rest–UV luminosity density of galaxies in our sample seems sufficient to sustain reionization at z 7 when we account for the likely contribution from galaxies below our magnitude limit.
Keywords:
high–redshift, galaxy evolution, galaxy formation, cosmology:
98.54.Kt1 Introduction
Until recently, the robust identification of galaxies at z 7, corresponding to a time when the Universe was only 800 Myr old, was extremely difficult due to existing near–infrared instrumentation. The recent installation of the Wide Field Camera 3 (WFC3) on the Hubble Space Telescope (HST) has opened up the distant universe for detailed exploration for the first time. WFC3 has obtained the deepest near–infrared (NIR) images ever taken, in the Hubble Ultra Deep Field (HUDF), obtaining data in three filters, Y105, J125, and H160 (PID 11563, PI G. Illingworth). In conjunction with existing optical Advanced Camera for Surveys (ACS) data, these new data allowed selection of galaxies at z 6.5 by searching for the Lyman break, due to intervening intergalactic medium (IGM) H i absorption. This is typically done by choosing a set of color criteria which select galaxies at the desired redshift, while excluding interlopers such as low–redshift passively evolving galaxies and galactic brown dwarfs, which can mimic high–redshift galaxies in a single color. Soon after these data were released, samples of z 6.5 galaxies were published, mostly using color cuts (e.g., Bouwens et al., 2010a; Oesch et al., 2010; McLure et al., 2010; Bunker et al., 2009; Yan et al., 2009). In these proceedings, we present the results of an independent study, using photometric redshift techniques to select a high–redshift galaxy sample, as well as rest–frame ultraviolet (UV) color analysis and stellar population modeling to study the physical characteristics of these galaxies. This full study is published in Finkelstein et al. (2009a).
2 High–Redshift Galaxy Sample
We fit photometric redshifts to objects in the WFC3 data using the photometric redshift code EAZY Brammer et al. (2008). This takes into account all available data, including the ACS photometry, when computing the redshift, and computes the full redshift probability distribution function, which is a sum over all available templates. This also provides a better redshift estimate, z 0.15–0.3, versus z 0.5 for the Lyman break technique. We found 31 objects which met our three selection criteria: 1) 3.5 significance in the J125 and H160 bands; 2) Best–fit photometric redshift of 6.3 zphot 8.6; and 3) 60% of the integrated probability distribution function ( ) at z 6.
3 Rest–Frame UV Colors of z 7 Galaxies
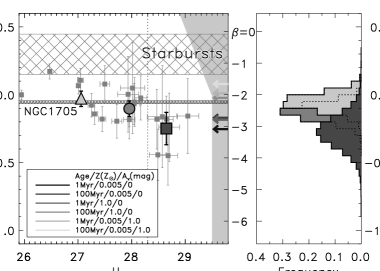
Figure 1 shows the 23 objects in our z 7 sub–sample (6.3 zphot 7.5) on a color–magnitude diagram. Individual galaxies have blue rest–UV colors, 0.5 0.2, corresponding to a UV spectral slope of 4 . However, the faint nature of these galaxies results in a high uncertainty on their colors. Thus, to learn about the z 7 galaxy population as a whole, we computed the mean color of all objects in the z 7 sample, as well as the mean color in bright and faint bins (split at = 28.3). We ran 107 bootstrap Monte Carlo simulations to assess the uncertainty on these mean colors, where each simulation accounts for Poisson noise in the sample size as well as photometric scatter. The means and their corresopnding uncertainties are shown in Figure 1. We compare these means to the colors of local starburst galaxies Kinney et al. (1996), as well as the local extremely blue galaxy NGC 1705 (which is thought to be dust–free), and find that z 7 galaxies are bluer than local starbursts at 4 significance (i.e., 99.9987% confidence). This is in stark contrast to the properties of Lyman break galaxies at z 3, which, only a billion years later, have rest–frame UV colors consistent with local starbursts (i.e., Papovich et al., 2001; Reddy and Steidel, 2009; Bouwens et al., 2009). Thus there is significant evolution in the rest–frame UV properties of star–forming galaxies over only 1 Gyr of cosmic time. The faint galaxies in our z 7 sample have = 3.07, which is difficult for “normal” stellar populations to form, thus suggesting the presence of a top–heavy initial mass function (IMF), or zero metallicity (Population III) stars (e.g., Bouwens et al., 2010b). However, the photometric scatter at H 28.3 results in a large uncertainty of = 0.5. Thus, while exotic stellar populations could be present, these data do not provide strong evidence to support their existence.
4 Stellar Mass Evolution
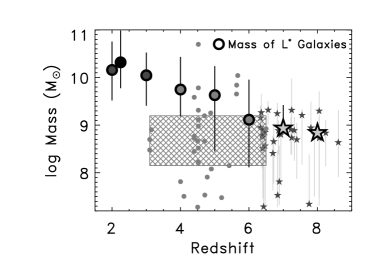
We compared the spectral energy distributions (SEDs) of our sample to updated stellar population models of S. Charlot & G. Bruzual Bruzual and Charlot (2003). Unfortunately, with only NIR detections (i.e. upper limits in the optical and in the infrared with Spitzer) we are unable to robustly constrain the ages and dust properties of these galaxies, though their very blue colors imply low levels of dust extinction. However, these blue colors do place limits on the metallicities, with a 68% confidence of Z 0.05 Z⊙. Even though these galaxies are not detected in their rest–frame optical (observed infrared) we place constraints on their stellar masses as the young age of the Universe limits the amount of mass which can exist in old stars, unseen in the WFC3 bands. We find best–fit masses in the range of 108 – 109 M⊙. Figure 2 shows the masses of our galaxies (interpolated to L∗ using the luminosity functions of Oesch et al. (2010) and Bouwens et al. (2010a)) compared to the stellar masses of lower–redshift LBGs (also converted to the mass at L∗). Comparing the masses of L∗ galaxies is roughly equivalent to studying them at a constant number density, thus we trace the stellar masses of the direct progenitors and descendents of a given galaxy. Figure 2 also shows the masses of galaxies selected on the basis of their Ly emission (LAEs), which are typically less evolved than LBGs (i.e., Gawiser et al., 2006; Finkelstein et al., 2009). The masses of z 7 galaxies are more comparable to LAEs at all redshifts than LBGs at any lower redshift. The low masses and likely low–dust content of z 7 galaxies implies that they are physically similar to lower–redshift LAEs rather than scaled–down versions of LBGs. Lower redshift LAEs are the likely building blocks of more evolved galaxies (i.e., Gawiser et al., 2007), thus at z 7 it appears we are observing an epoch dominated by these building blocks, and that the more evolved galaxies common at lower–redshifts are rare.
5 Summary
We have analyzed the properties of 31 galaxies at z 6.3 in the extremely deep HUDF. These objects appear very similar to lower–redshift LAEs, implying that at z 7 we have reached the era of “baby” galaxies. However, it does not appear we have yet reached the era of “infant” galaxies, where one would expect Population III stars or top heavy IMFs, but these may come to light in the near future with the James Webb Space Telescope.
References
- Bouwens et al. (2010a) R. J. Bouwens et al., ApJL, 709, L133–L137 (2010a).
- Oesch et al. (2010) P. A. Oesch et al., ApJL, 709, L16–L20 (2010),
- McLure et al. (2010) R. J. McLure et al., MNRAS, 403, 960–983 (2010),
- Bunker et al. (2009) A. Bunker et al., ArXiv e-prints (2009), 0909.2255.
- Yan et al. (2009) H. Yan et al. ArXiv e-prints (2009), 0910.0077.
- Finkelstein et al. (2009a) S. L. Finkelstein et al., ArXiv e-prints (2009a), 0912.1338.
- Brammer et al. (2008) G. B. Brammer, P. G. van Dokkum, and P. Coppi, ApJ, 686, 1503–1513 (2008)
- Kinney et al. (1996) A. L. Kinney et al.ApJ, 467, 38 (1996).
- Papovich et al. (2001) C. Papovich, M. Dickinson, and H. C. Ferguson, ApJ, 559, 620–653 (2001)
- Reddy and Steidel (2009) N. A. Reddy, and C. C. Steidel, ApJ, 692, 778–803 (2009),
- Bouwens et al. (2009) R. J. Bouwens et al., ApJ, 705, 936–961 (2009)
- Bouwens et al. (2010b) R. J. Bouwens et al., ApJL, 708, L69–L73 (2010b)
- Reddy et al. (2006) N. A. Reddy, C. C. Steidel, D. K. Erb, A. E. Shapley, and M. Pettini, ApJ 653, 1004–1026 (2006)
- Shapley et al. (2005) A. E. Shapley et al., ApJ, 626, 698–722 (2005)
- Stark et al. (2009) D. P. Stark et al., ApJ, 697, 1493–1511 (2009)
- Gawiser et al. (2006) E. Gawiser et al., ApJL, 642, L13–L16 (2006).
- Pirzkal et al. (2007) N. Pirzkal, S. Malhotra, J. E. Rhoads, and C. Xu, ApJ, 667, 49–59 (2007).
- Finkelstein et al. (2007) S. L. Finkelstein, J. E. Rhoads, S. Malhotra, N. Pirzkal, and J. Wang, ApJ, 660, 1023–1029 (2007).
- Finkelstein et al. (2009) S. L. Finkelstein, J. E. Rhoads, S. Malhotra, and N. Grogin, ApJ, 691, 465–481 (2009).
- Bruzual and Charlot (2003) G. Bruzual, and S. Charlot, MNRAS, 344, 1000–1028 (2003).
- Gawiser et al. (2007) E. Gawiser et al., ApJ, 671, 278–284 (2007).