Network-based confidence scoring system for genome-scale metabolic reconstructions
Abstract
Reliability on complex biological networks reconstructions remains a concern. Although observations are getting more and more precise, the data collection process is yet error prone and the proofs display uneven certitude. In the case of metabolic networks, the currently employed confidence scoring system rates reactions according to a discretized small set of labels denoting different levels of experimental evidence or model-based likelihood. Here, we propose a computational network-based system of reaction scoring that exploits the complex hierarchical structure and the statistical regularities of the metabolic network as a bipartite graph. We use the example of Escherichia coli metabolism to illustrate our methodology. Our model is adjusted to the observations in order to derive connection probabilities between individual metabolite-reaction pairs and, after validation, we integrate individual link information to assess the reliability of each reaction in probabilistic terms. This network-based scoring system breaks the degeneracy of currently employed scores, enables further confirmation of modeling results, uncovers very specific reactions that could be functionally or evolutionary important, and identifies prominent experimental targets for further verification. We foresee a wide range of potential applications of our approach given the natural network bipartivity of many biological interactions.
I Introduction
Cells are self-organized entities able to carry out specialized functions at several interrelated levels, i.e. a genetic code is repeatedly transcribed for cell maintenance and reproduction, a proteomic set robustly embodies the cell machinery, and a mesh of metabolic reactions continuously furnishes the energy and biochemical compounds necessary for life. A crucial milestone to understand and control cellular behavior is the building up of reliable reconstructions of the interactions spanning the different functional levels Kuhner:2009 ; Yus:2009 ; Guell:2009 . Such reconstructions find a natural abstraction in the form of complex networks Newman:2003 ; Dorogovtsev:2008 ; Barrat:2008 , where nodes represent cellular components, such as genes, proteins or metabolites, while edges identify the presence of biological interactions between them Aittokallio:2006 . These network representations enable to map the large-scale structure of cellular interactions Barabasi:2004 ; Kepes:2007 , to explore the basic principles of transcriptome and proteome organization Kepes:2007 , to identify missing genes encoding for specific metabolic functions Kharchenko:2006 , and to analyze emergent global phenomena in metabolism like robustness and regulation Stelling:2002 ; Guimera:2005b ; Motter:2008 ; Smart:2008 .
At present, the information for complex network representations of cellular systems comes primarily from web-based databases, oftentimes manually curated with information from multiple sources, like annotations from the literature or new experiments Palsson:2006 . It is common to take the reliability of these data for granted and to draw from them resolute inferences about the properties or the behavior of the investigated organisms Oberhardt:2009 . Although, in general, observations are getting more and more precise, uncertainties about components or interactions remain Amaral:2008 ; Kaltenbacha:2009 : experimental targets are many times biased towards the most rewarding in terms of expected impact, experimental evidence gathered with different methodologies is not always of the same quality, variability is unavoidably present in different organisms of the same species, and perfect environmental control in experiments is often difficult to achieve. In particular, high-throughput techniques produce massive data in comparison with more dedicated experiments at the price of repeatedly reported inaccuracy Mering:2002 . In the best case, a number of alternative or missing interactions need to be inferred and those detected with low confidence need to be validated.
Prediction of missing interactions in probabilistic terms is possible on the basis of the structure of the network alone, and could serve to better characterize network-based descriptions of biological systems and as a guide for new experiments. Despite being of enormous importance, this task is just a first step towards assessing the quality of a given data set. Metabolisms, in particular, encode information through the metabolic processes themselves, either singled out or combined in pathways. It would be thus convenient to assess the realiability of a reconstructed metabolic network in terms of a reaction-based “confidence scoring system”. The latter, although it may appear at first sight “chemically spurious” (canonically a chemical reaction either exists or does not), is fully admitted in the context of prone-to-error large-scale reconstructed biochemical networks Francke:2005 ; Thiele:2010 . In short, it amounts to assign a certain level of experimental evidence, or model-based likelihood, to every particular reaction within a genome-scale metabolic reconstruction.
For network analysts, scoring a biochemical process in terms of its confidence, apart from being experimentally motivating, is a computational challenge. Starting from the assessment of individual links, as it has been devised for instance for protein-protein interaction networks Saito:2002 ; Goldberg:2003 , the problem is conditioned by the need of non-local models that faithfully capture the large-scale statistical regularities of the networks, and by the requirement of sufficient reliability in the input experimental observations. In this respect, the reconstruction of genome-scale biochemical networks is a well-established procedure down to stoichiometric detail and available metabolic network reconstructions, such as those of E. coli, are of sufficient quality and can be exploited to get accurate network-based predictions.
Here, we propose a computational network-based system of reaction scoring and, subsequently, apply it to the metabolism of E. coli. To this end, we introduce a link prediction method that exploits the complex hierarchical structure and the statistical regularities of the metabolic network Wagner:2001 ; Ravasz:2002 and takes explicitly into account its bipartite nature Newman:2001b ; Holme:2003 . Our model is adjusted to the observations in order to derive connection probabilities between pairs of elements Serrano:2008a ; Clauset:2008 ; Guimera:2009 and, after validation, we integrate individual metabolite-reaction link information to assess the reliability of each reaction in the metabolism of E. coli, both in absolute terms and relative to a random null model. Such, for the first time proposed, network-based scoring system permits to rank reactions in the database, and compare our “in silico” predictions with “in vivo” annotations quoted in the reference literature Thiele:2010 . In this latter context, confidence scores are discretized according to five integers. From a direct comparison with our continuously distributed index, similarities and discrepancies are fleshed out, singularly stressing the specifities of particular reactions as compared to those that are baseline. At the end, our versatile approach may provide unexisting information for unranked databases, or refine and complement labeled ones, aiming to direct more effectively experimental efforts and to unveil structural levels of organization within the intrincate biological networks underlying living organisms.
II Results and Discussion
II.1 Network-based confidence scoring system
Beyond experimental evidence, it is possible to assess confidence scores for reactions in genome-scale metabolic reconstructions using theoretical models. Given an experimentally derived metabolic reconstruction, a confidence score for the reactions can be computed on the basis of a suited stochastic network-based model, as proposed in next section. In the context of bipartite network representations Newman:2001b ; Holme:2003 , the model exploits the statistical regularities that imprint the structure of the metabolic network in order to ascertaining how well individual links between metabolites and reactions fit the observed topological patterns. In this way, it is possible to predict probabilities of connection for all potential interactions, those already present in the reconstruction and those absent. These probabilities are further integrated for the specific combination of metabolites involved in any particular reaction.
To define this network-based confidence score in quantitative terms, we interpret that a reaction is equivalent to the univocal combination of its associated metabolites, and that every metabolite has a probability of being associated to a reaction . Once the connection probabilities between all metabolites and all reactions are estimated from the model, and assuming their mutual independence, the probability that a certain combination of metabolites co-occur in a reaction is
| (1) |
where the subindex corresponds to metabolites in the predefined set and to those not included. Notice that in general the set could be different from the actual combination of metabolites associated to reaction . The average number of co-occurrences can be calculated as the sum over all reactions
| (2) |
A network-based confidence score for a reaction can then be defined as the average number of occurrences that the model associates to its particular combination of metabolites . Defined in this way, these scores break the degeneracy of reactions with identical experimental evidence.
II.2 The Tree Distance Bipartite (TDB) model
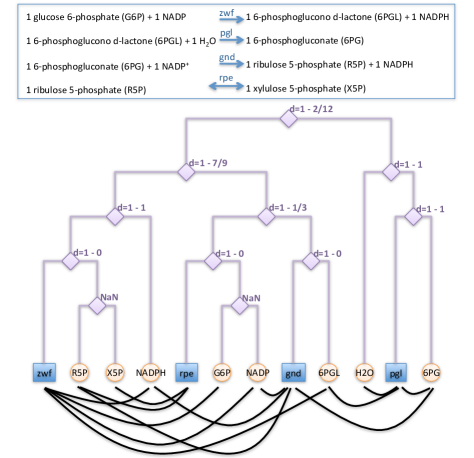
In the following, we introduce and discuss a stochastic network-based model to estimate the probabilities of connection between metabolites and reactions. Taking advantage of their natural bipartite nature, we consider network representations where both metabolites and reactions appear as nodes and metabolites are connected by edges to the reactions they participate in. We consider the simplest unweighted undirected representation, where substrates and products are not differentiated. See Fig. 1 for an example.
Previous works have shown that the complex organization of metabolic networks displays characteristic features shared by other complex networks: short topological diameter Ma:2003a , steady state cycles Wright:2008 or structural robustness Smart:2008 , for instance. We implement a large-scale model that takes advantage of some of those organizing principles, in particular the heterogeneity in the number of connections per metabolite (degree) Jeong:2000 and its hierarchical architecture Ravasz:2002 , to infer connection probabilities between metabolites and reactions. Network-based models are usually prescribed in terms of connection rules between the nodes. These laws are stated independently of observed systems to produce graphical representations that summarize their topological structure. Notice that here, in contrast, we compute from the observed data the set of connection probabilities that has the maximum likelihood to reproduce the structure of an experimental metabolic reconstruction, so we are solving the inverse problem.
Our first step is to assume an underlying metric space for the metabolic network where all its elements are supposed that the closer they are, the higher will be their connection probability. To this end, we fit a hierarchical random graph Clauset:2008 to the metabolic reconstruction, once represented as a bipartite network with metabolites and reactions (see Fig. 1). More specifically, we adjust the observed bipartite network to a dendrogram, or binary tree structure , where metabolites and reactions appear as distinguishable leafs. This tree represents the underlying metric space, and each of the internal nodes in the dendrogram has an associated distance , so that each pair metabolite-reaction for which is the lowest common ancestor is separated by a distance in the tree , independently from whether the link actually exists in the network or not. We find these tree distances by fitting the tree to the observed network data combining a maximum-likelihood approach with a Monte Carlo sampling method that explores the space of all possible dendrograms (see Appendix A). Our results are based on intensive numerical simulations that average a large number of samples in the stationary state when changes in the form of the dendrogram do not modify the likelihood function beyond fluctuations.
Once a distance is associated to every possible pair metabolite-reaction, we correct for heterogeneity in the degrees of metabolites and compute the connection probability between metabolite and reaction as
| (3) |
where is the degree of the metabolite. As a result, our model produces a list of estimated connection probabilities between all possible combinations metabolite-reaction. The confidence score for every specific reaction can then be computed by applying Eq. (1) and Eq. (2).
II.3 TDB confidence scores for E. coli metabolism
As an application of this methodology, we analyze the iAF1260 version of the K12 MG1655 strain of the metabolism of E. coli Feist:2007 provided in the BIGG database (http://bigg.ucsd.edu/). From the empirical data, we built a bipartite network representation (see Appendix C) avoiding reactions that do not involve direct chemical transformation (we obviate isomerization, diffusion and exchange reactions). This leads to a bipartite graph of reactions and metabolites. As expected, the number of metabolites entering into a reaction follows a nearly homogeneous distribution with mean and mode . In contrast, the number of reactions in which a metabolite participates displays a scale free degree distribution , with an average degree (see Appendix C). Currency metabolites are the most connected substrates, some with more than a hundred and up to connections (, , , , , , , ).
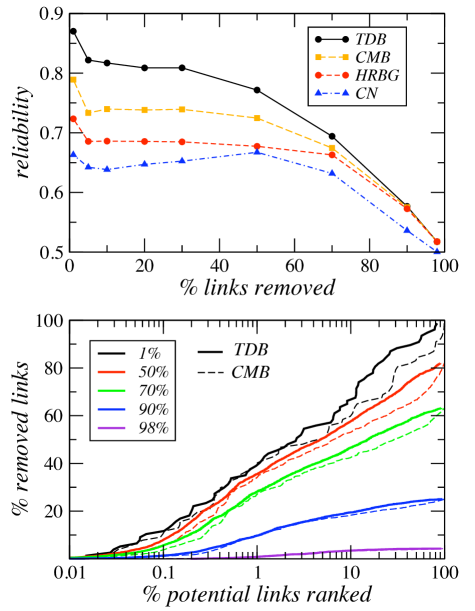
We obtain the TDB based probabilities for this E. coli reconstruction, and we evaluate their reliability in statistical terms. We compute the probability that the model associates a higher likelihood to a missing link that has been removed from the bipartite metabolic network than to a non-existing link that was never there. To this end, a subset of links in the original network is removed uniformly at random and a new set of connection probabilities is calculated on the basis of the remaining part of the network. The new probabilities associated to removed connections are compared one by one to that of non-existing links. This reliability statistic ranges from to and indicates how much better our method performs as compared to a by chance baseline accuracy of .
Figure 2 (top) shows the reliability index for different fractions of links in the removed set. When of the links in the network are removed, it takes a value of , meaning that of the times removed links are ranked higher in probability by our model than non-existing links. In the same plot, we compared with alternative models (see Appendix B), such as the Configuration Model for Bipartite networks Newman:2001b ; Newman:2002c ; Guillaume:2006 (CMB), the Hierarchical Random Graph model Clauset:2008 generalized to bipartite networks (HRBG), and a local approach based on the computation of Common Neighbors (CN) Lorrain:1971 (reactions) between pairs of metabolites. We find that our TDB model outperforms all other strategies at identifying missing interactions. For each point in Fig. 2 (top), we also measured the positions of the removed links in the ranking of potential links ordered from more to less probable according to the model. The results are shown in Fig. 2 (bottom). It can be observed that the top of the predictions is highly accurate in the sense that it contains nearly of all removed connections. As expected, this value decreases as less links are available to the algorithm in the remaining part of the network, but it is noticeable that, even with a of the links removed from the original network, the accumulation of those at the top as ranked by the algorithm is still of more than .
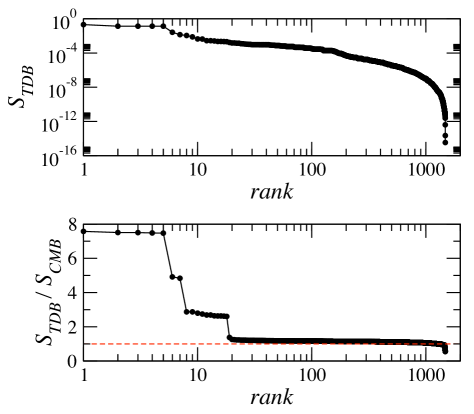
In view of these results, we accept the accuracy at the statistical level of the predicted probabilities and we use them to compute theoretical confidence scores following Eq. (1) and Eq. (2) (the detailed list of TDB confidence scores is available under request). Very high values of the TDB confidence scores are typically associated to non-specific reactions dominated by carrier metabolites (hubs in network-based terms). At the top of the rank, the five reactions with the highest values form a group of outliers (short first plateau in the top graph of Fig. 3) corresponding to reactions whose metabolites are exclusively hubs. These non-specific reactions are at the end of catabolic chains and are likely to be shared by many different organisms. At the other extreme of the spectrum, low values of are associated with very specific reactions involving rare metabolites, in the sense that they enter a small number of reactions. In between, scores adopt a broad distribution of continuous values ranging several orders of magnitude.
II.4 Comparison beween Database (DB) and Tree Distance Bipartite (TDB) scoring systems
In the database, every reaction (except for exchanges and transports through outer membrane) is endowed with a confidence score assessing its level of evidence. These values are discrete and range from 4 at the top, when there is direct biochemical proof, to 0 at the bottom, when the reaction is included with no experimental evidence, only because it improves modeling results. In between, values of 3 correspond to genomic evidence, level 2 refer to sequence homology evidence, and 1 stands for physiological evidence. This confidence scoring system presents some shortcomings, one being the wicked level of degeneracy implicit in the use of only five discrete values for lists of hundreds or thousands of reactions.
Our TDB confidence scoring system breaks this degeneracy with a continuous spectrum of values. We prefer to restrict to the extrema of our spectrum to compare against scores. For reactions with scores in the database that indicate a strong experimental evidence (values or ), we find both high and low values of scores. The first situation corresponds to our TDB model providing complementary computational verification of experimental certainty. The second and more interesting cathegory uncovers very specific reactions that could be functionally or evolutionary important. Examples are the five FMNH2-dependent monooxygenase reactions, the Pyridoxine 5’-phosphate synthase reaction, or the Taurine dioxygenase reaction. Conversely, a weak experimental evidence, scores or , but a high value of the score, qualifies the reaction as a good target for further experimental verification in standard conditions. Many examples are found within the transport subsystems, like reactions of transport via ABC system (iron (II) and (III), phosphatidylglycerol, phosphatidate). If the score is low, the reaction could be difficult to be observed experimentally except for very specific environments. Finally, high scores for reactions that where required for modeling, score , denotes consistency between our model and steady-state flux optimization solutions. It is worth remarking that these reactions appear at the very end of the catabolic chain and involve more than one carrier metabolites. However, a variety of reactions, like many in the subsystem of Cofactor and Prosthetic Group Biosynthesis and many with the highest reaction degree, manifest discrepancy between the models.
II.5 Comparison beween Tree Distance Bipartite (TDB) and Configuration Model Bipartite (CMB) confidence scores
Along with absolute confidence scores, we also analyze relative scores defined on the basis of the Configuration Model for Bipartite networks (CMB) Newman:2001b ; Newman:2002c ; Guillaume:2006 (see Appendix B). The latter assumes the actual degree distributions for metabolites and reactions and it is otherwise maximally random in the assembly of connections. For every reaction, we calculate the score representing its probability of occurrence according to the configuration model and use this value to compute the ratio (the detailed list of relative scores is available under request). Since differences between both scores are mainly related to the consideration of tree distances between metabolites and reactions in the TDB model, a relative score points to the presence of tree distance correlations (anticorrelations) in the bipartite network, which are absent in the random case. In other words, a ratio higher (smaller) than one for a certain reaction indicates that its metabolites have a tendency to aggregate (avoid each other) as compared to the random case.
The ranking of relative scores is shown in the bottom graph of Fig. 3, where several clusters can be differentiated. The first three clusters appear in slightly tilted plateaus with levels well separated by appreciable jumps. Each of them is formed by a subgroup of reactions that, according to the database, tend to belong to the same subsystem and share characteristic combinations of metabolites. The first group includes the FMNH2-dependent monooxygenase reactions, mentioned above as highly specific, with flavin mononucleotide and sulfite as reactants. The two reactions in the second plateau belong to the Glycerophospholipid Metabolism subsystem and are the only two in the database associated to acyl phosphatidylglycerol. The third cluster gathers together the eleven reactions containing 2-Demethylmenaquinone 8. It is remarkable that, in general, the reactions in these clusters have attached a high DB confidence score. Exceptions appear in the third cluster, where one reaction has an experimental evidence score less than 3 while four reactions are included for modeling reasons and protrude as experimental targets for experimental verification. For the rest, most of the scores have values above but close to one and there are also over two hundred reactions with ratios below one. At the very tail, one finds a set of reactions that share the common characteristic of being those with the highest reaction degree and with weak or just modeling evidence. In particular, thiazole phosphate synthesis is the solely reaction involving twelve metabolites in the database and has the lowest relative score , and noticeably also the lowest absolute score ().
II.6 Metabolic confidence map at the level of pathways
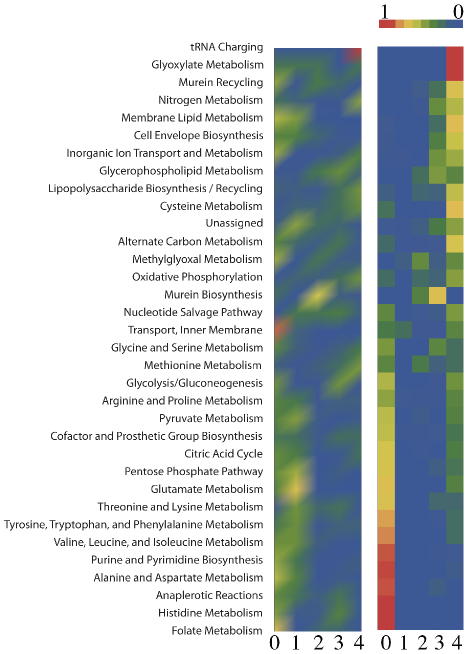
Relative scores, , conform better than absolute scores, , to the idea of pathways as functional modules since they overexpose the effect of tree distances, that we expect to be related with the modular organization of the network. We analyze the confidence score map associated to the different biochemical pathways in E. coli in Fig. 4. For each pathway, we look at the distribution of relative scores for the reactions within Duarte:2007 . Notice that, even for E. coli, there remain a number of pathways poorly characterized at the experimental level. According to our relative scores, some pathways, such as Inorganic Ion Transport and Metabolism or Oxidative Phosphorilation, are associated to a relatively high average confidence, while others subsystems, such as Alanine and Aspartate Metabolism, present average values very close to one. At a qualitative level, the overall correlation between this in silico metabolic confidence map and the metabolic landscape from the DB scoring system is noticeable, although the agreement is not perfect. In some cases, like for tRNA Charging, Murein Biosynthesis or Glutamate Metabolism, both maps provide very good agreement. In contrast, some pathways are at variance, like the Transport, Inner Membrane or Membrane Lipid Metabolism, that thus appears as a prominent potential target for further evaluation and experimental exploration.
III Conclusions
The computational network-based TDB confidence scoring system is able to asses, in probabilistic terms, the reliability of reactions in metabolic reconstructions solely on the basis of the structure of the bipartite interactions between metabolites and reactions. It relies on a link prediction method adjusted to the observations that exploits the heterogeneity in the number of connections per metabolite and the hierarchical architecture of the network to estimate connection probabilites that afterwards are integrated at the level of reactions. As a result, our TDB scoring system is able to break the degeneracy of currently employed scores that only use a discrete number of integers to label different levels of empirical evidence or model-based likelihood, in addition to providing non-existing information for unranked databases. TDB scores enable as well further confirmation of steady-state modeling solutions, uncover very specific reactions that could be functionally or evolutionary important, and identify prominent experimental targets for further verification. When compared with a random null model that justs accounts for heterogeneity in the number of connections per element, relative scores detect and quantify the tendency of groups of metabolites to aggregate or disaggregate. This comes out as distance-based correlations or anticorrelations in the underlying tree metric space, a question worth exploring in the future in relation to functional modules.
In a broader context, many biological interactions find a natural representation in the form of bipartite networks. The ubiquity of these bipartite structures in cellular networks foretells a wide range of potential applications of the present methodology, from the estimation of codon-gene association probabilities to the assessment of protein complexes.
Acknowledgements.
We thank Marián Boguñá for helpful discussions. This work was supported by DURSI Project No. 2009SGR1055. F. S. acknowledges financial support by MICINN Project No. FIS2006-03525. M. A. S. was supported by the Ramón y Cajal program of the Spanish Ministry of Science and by MICINN Project No. BFU2010-21847-C02-02.References
- (1) Kühner S, & et al. (2009) Proteome Organization in a Genome-Reduced Bacterium. Science 326, 1235–1240.
- (2) Yus E, & et al. (2009) Impact of Genome Reduction on Bacterial Metabolism and Its Regulation. Science 326, 1263–1268.
- (3) Güell M, & et al. (2009) Transcriptome Complexity in a Genome-Reduced Bacterium. Science 326, 1268–1271.
- (4) Newman MEJ (2003) The structure and function of complex networks. SIAM Review 45, 167–256.
- (5) Dorogovtsev SN, Goltsev AV, Mendes JFF (2008) Critical phenomena in complex networks. Rev. Mod. Phys. 80, 1275Ð1335.
- (6) Barrat A, Barthélemy M, Vespignani A (2008) Dynamical Processes on Complex Networks. (Cambridge University Press, Cambridge).
- (7) Aittokallio T, Schwikowski V (2006) Grap-based methods for analysing networks in cell biology. Briefings in Bioinformatics 7, 243–255.
- (8) Barabási A-L, Oltvai ZN (2004) Network biology: understanding the cellÕs functional organization. Nature Reviews Genetics 5, 101–113.
- (9) Képès FE (2007) Biological Networks. (World Scientific, Singapore).
- (10) Kharchenko P, Chen L, Freund Y, Vitkup D, Church GM (2006) Identifying metabolic enzymes with multiple types of association evidence. BMC Bioinformatics 7, 177.
- (11) Stelling J, Klamt S, Bettenbrock K, Schuster S, Gilles ED (2002) Metabolic network structure determines key aspects of functinality and regulation. Nature 420, 190–193.
- (12) Guimerà R, Amaral LAN (2005) Functional cartography of complex metabolic networks. Nature 433, 895–900.
- (13) Motter AE, Gulbahce N, Almaas E, Barabási A-L (2008) Predicting synthetic rescues in metabolic networks. Molecular Systems Biology 4, 168.
- (14) Smart AG, Amaral LAN, Ottino J (2008) Cascading failure and robustness in metabolic networks. Proc. Natl. Acad. Sci. USA 105, 13223–13228.
- (15) Palsson BO (2006) Systems Biology: Properties of Reconstructed Networks. (Cambridge University Press, Cambridge).
- (16) Oberhardt MA, Palsson BO, Papin JA (2009) Applications of genome-scale metabolic reconstructions. Molecular Systems Biology 5, 320.
- (17) Amaral LAN (2008) A truer measure of our ignorance. Proc. Natl. Acad. Sci. USA 105, 6795–6796.
- (18) Kaltenbacha H-M, Dimopoulosa S, Stelling J (2009) Systems analysis of cellular networks under uncertainty. FEBS Letters 583, 3923–3930.
- (19) von Mering C, & et al. (2002) Comparative assessment of large-scale data sets of protein-protein interactions. Nature 417, 399Ð403.
- (20) Francke C, Siezen RJ, Teusink B (2005) Reconstructing the metabolic network of a bacterium from its genome. TRENDS in Microbiology 13, 550–558.
- (21) Thiele I, Palsson BO (2010) A protocol for generating a high-quality genome-scale metabolic reconstruction. Nature Protocols 5, 93–121.
- (22) Saito R, Suzuki H, Hayashizaki Y (2002) Interaction generality, a measurement to assess the reliability of a proteinÐprotein interaction. Nucleic Acids Research 30, 1163–1168.
- (23) Goldberg DS, Roth, FP (2003) Assessing experimentally derived interactions in a small world. Proc. Natl. Acad. Sci. USA 100, 4372–4376.
- (24) Wagner A, Fell D (2001) The small world inside large metabolic networks. Proc R. Soc. Lond. B 268, 1803–1810.
- (25) Ravasz E, Somera AL, Mongru DA, Oltvai ZN, Barabási A-L (2002) Hierarchical Organization of Modularity in Metabolic Networks. Science 297, 1551–1555.
- (26) Newman MEJ, Strogatz SH, Watts DJ (2001) Random graphs with arbitrary degree distributions and their applications. Phys. Rev. E 64, 026118.
- (27) Holme P, Liljeros F, Edling CR, Kim BJ (2003) Network bipartivity. Phys. Rev. E 68, 056107.
- (28) Serrano MA, Krioukov D, Boguñá M (2008) Self-similarity of complex networks and hidden metric spaces. Phys. Rev. Lett. 100, 078701.
- (29) Clauset A, Moore C, Newman M. (2008) Hierarchical structure and the prediction of missing links in networks. Nature 453, 98–101.
- (30) Guimerà R, Sales-Pardo M (2009) Missing and spurious interactions and the reconstruction of complex networks. Proc. Natl. Acad. Sci. USA 106, 22073Ð22078.
- (31) Ma H, Zeng AP (2003) Reconstruction of metabolic networks from genome data and analysis of their global structure for various organisms. Bioinformatics 19, 270–277.
- (32) Wright J, Wagner A (2008) Exhaustive identification of steady state cycles in large stoichiometric networks. BMC Systems Biology 2, 61.
- (33) Jeong H, Tombor B, Albert R, Oltvai ZN, Barabási A-L (2000) The large-scale organization of metabolic networks. Nature 407, 651–654.
- (34) Feist AM, & et al. (2007) A genome-scale metabolic reconstruction for Escherichia coli K-12 MG1655 that accounts for 1260 ORFs and thermodynamic information. Molecular Systems Biology 3, 121.
- (35) Newman MEJ, Watts DJ, Strogatz SH (2002) Random graph models of social networks. Proc. Natl. Acad. Sci. USA 99 (suppl. 1), 2566–2572.
- (36) Guillaume J-L, Latapy M (2006) Bipartite graphs as models of complex networks. Physica A: Statistical and Theoretical Physics 371, 795–813.
- (37) Lorrain F, White HC (1971) Structural equivalence of individuals in social networks. Physical Review E 1, 49–80.
- (38) Duarte N, & et al. (2007) Global reconstruction of the human metabolic network based on genomic and bibliomic data. Proc. Natl. Acad. Sci. USA 104, 1777–1782.
- (39) Newman MEJ, Barkema GT (1999) Monte Carlo Methods in Statistical Physics. (Oxford University Press, Oxford, UK).
Appendix A Fitting the binary tree to the bipartite network
We adjust to the observed data a binary tree with internal nodes at its bifurcation points and leaves corresponding to the nodes of the metabolic bipartite network, so representing its metabolites and its reactions. Each internal node has an associated tree probability that we transform into a distance . Each pair metabolite-reaction having as lowest common ancestor is then separated by a distance . Given a dendrogram, the internal probabilities are only dependent on the structure of the observed bipartite network and can be calculated as the fraction of observed connections between leaves in each branch of the internal node over the total possible. To find the dendrogram that best fits the real data in terms of likelihood, we assume that all trees are a priori equally probable and explore the space of possibilities using a Markov chain Monte Carlo method Newman:1999 combined with a maximum likelihood approach, following the methodology in Clauset:2008 .
In statistical inference, the likelihood of a statistical model for a certain set of observed data is the probability that the model is a correct explanation, and allows us to estimate its unknown parameters. For a set of connection probabilities and taking into account the underlying tree, the likelihood function becomes
| (4) |
As for unipartite graphs, the variable stands for the number of actual edges in the observed bigraph, in our case those that connect metabolites and reactions in the bipartite graph with as their lowest common ancestor in . The variable corresponds to the total possible number of such edges given reactions and metabolites in the different branches of the common ancestor , discounting internal combinations. In the unipartite case, , being and the number of leaves in the left and right subtrees rooted at . In our scheme for bipartite networks, , counting possible combinations between metabolite leaves in the left subtree and reaction leaves in the right subtrees and vice versa. Then, maximize .
Starting from a random configuration, we move among all possible sets of dendrograms by performing random swaps between one of the branches of a randomly chosen internal node and the alternative branch at its father level. This exploration is appropriate because it is ergodic and fulfils detailed balance. The likelihood of the new dendrogram produced in this way is computed and the dendrogram is accepted or rejected according to the standard Metropolis-Hastings rule Newman:1999 : the transition is accepted whenever the likelihood does not decrease and otherwise it is accepted with a probability (for computational purposes, it is more convenient to work with the logarithm of the likelihood function).
After a transient period when reaches its equilibrium value (except typical fluctuations) the system reaches a stationary state where we sample over dendrograms at regular intervals to produce an average measure of and so of for each possible metabolite-reaction pair. This model, the Hierarchical Random Bipartite Graph (HRBG), is a generalization for bipartite networks of the model introduced in Clauset:2008 . As explained in the main text, in our TDB model we correct the tree distances ( ) by the heterogeneity in the degrees of metabolites. We renormalize them according to Eq. (3) to produce the connection probabilities that we use in the construction of the confidence scores.
Appendix B Alternative methods
We compare predictions of our TDB model with those produced by other alternatives like the Configuration Model for Bipartite networks Newman:2001b ; Newman:2002c ; Guillaume:2006 (CMB), the Hierarchical Random Graph model Clauset:2008 generalized for bipartite networks (HRBG) (values of are taken directly for ), and a local similarity measure counting Common Neighbors Lorrain:1971 (CN).
B.1 The Configuration Model for Bipartite networks
(CMB) assumes a certain number of reactions , a certain number of metabolites , and their degree distributions and , which should fulfill the requirement , where is the average number of metabolites in the reactions and is the average number of reactions in which metabolites participate. Metabolites and reactions are partitioned into two different classes and each element in each class is assigned an expected degree from the corresponding distribution, which is attached in the form of stubs. Two stubs, one in each partition, are selected at random and the link between the metabolite and the reaction is created avoiding multiple connections.
For the CMB, and Eq. (2) can be calculated analytically. Since the distribution of the bipartite degrees of the reactions is nearly homogeneous, , it becomes
| (5) |
that gives the CMB confidence score for a metabolic reaction when its set of associated metabolites is .
B.2 Common Neighbors
(CN) measure counts the number of shared neighbors of a given pair. This measure represents a family of overlap measures quantifying similarity between nodes and a normalized version was specifically introduced for the study of the hierarchical modularity of metabolic networks and to delineate the functional modules based on the network topology Ravasz:2002 .In the case of bipartite metabolic networks, we define common neighbors for a pair of metabolites as the number of reactions in which they are concurrent, , and we estimate the probability of connection metabolite-reaction as .
Appendix C E. coli bipartite network representation
In order to build a bipartite network representation of the metabolism of E. coli, we use the iAF1260 version of the K12 MG1655 strain Feist:2007 provided in the BIGG database (http://bigg.ucsd.edu/). It comprises 1039 metabolites and 2381 reactions which include isomerizations, exchange reactions, intracompartment reactions, and different types of transport reactions (some of which involve chemical transformation) between three different compartments: cytosol, periplasm, and a third symbolic one representing the extra-organism.
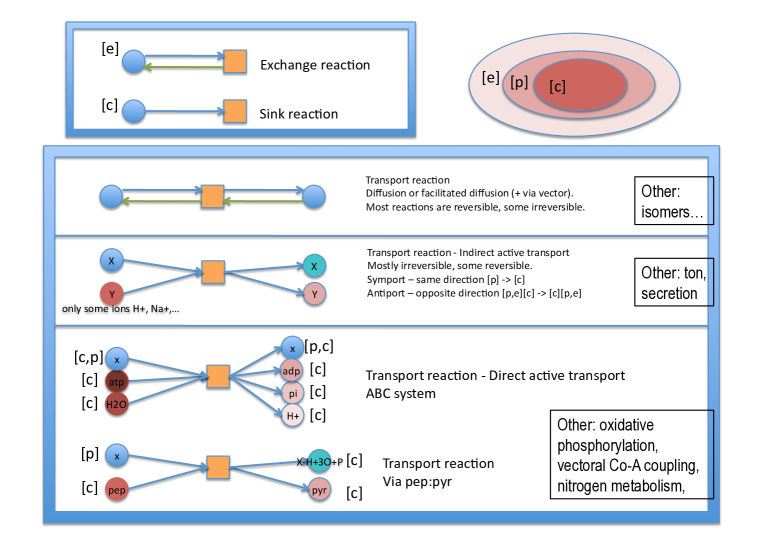
The most simple representation is in the form of an unweighted undirected network without self-loops or dangling ends (dead end reactions). More refined versions would take into account directionality of the reactions, stoichiometric coefficients, self-loops, etc..
Inside compartments, isomerization reactions (some reversible and some irreversible) transform the structure of one compound without altering its molecular formula. Isomers can have significantly different properties, so in principle it seems reasonable to consider those reactions in a network representation, and the two compounds as separate. However, the topological confidence score of those reactions will depend exclusively on the joint probability of occurrence of the pair of isomers and, most probably, the score would be expected to be low since they only enter together into those reactions. Our option (to be consistent with the treatment of diffusion reactions that lead to the same problematic as we explain below) is to neglect those reactions and to take the isomers as a single entity.
Exchange reactions represent the exchange of metabolites between the cell and the environment. These are reversible and involve a single metabolite. In a bipartite representation, exchange reactions would be dangling ends with a single incoming connection. Sinks needed to allow metabolites to leave the system (irreversible reactions in the cytoplasm) can be treated in the same way. Since they would count in the total amount of reactions but never two metabolites would enter them simultaneously, it seems reasonable to neglect them in the context of this work. Furthermore, exchanges or sinks have no associated reconstruction confidence score in the database.
Regarding transport reactions, there are several options. In E. coli, three different compartments are differentiated: cytosol, periplasm, and extra-organism. Every compound in a different compartment is considered as an individual specie and transport steps are formally considered as reactions transferring the compound belonging to one compartment into the same compound belonging to the other compartment (the respective concentrations can be different, and the compartments usually have different volume). Transport reactions between compartments are of different kind. Basic general mechanisms are:
-
•
Via diffusion (membrane permeable to water molecules and a few other small, uncharged, molecules like oxygen and carbon dioxide that diffuse freely in and out of the cell) or via facilitated diffusion (transmembrane proteins create a water-filled pore through which ions and some small hydrophilic molecules can pass by diffusion. The channels can be opened or closed according to the needs of the cell). Molecules and ions move spontaneously down their concentration gradient. No chemical transformation is involved. In the database, most are reversible processes while some are irreversible.
-
•
Via active transport. Active transport is defined as mass transport from a region of lower to a region of a higher electrochemical potential. It is transport that requires energy. Active transport across biological membranes occurs via enzymes. Transmembrane proteins, called transporters, use the energy of ATP (hydrolyzation of ATP, in general , or , enough to pump 2 sodium ions) to force ions or small molecules through the membrane against their concentration gradient. Active transport can be direct or indirect:
-
–
Direct active transport. Some transporters bind ATP directly and use the energy of its hydrolysis to drive active transport (ATP powered pumps). In the database, these are named as ABC (ATP-Binding Cassette) transmembrane proteins, which expose a ligand-binding domain usually restricted to a single type of molecule at one surface and an ATP-binding domain at the other surface; the ATP bound to its domain provides the energy to pump the ligand across the membrane. In the database, hydrolyzation of ATP correspods to the chemical transformation (cytoplasm, periplasm).
-
–
Indirect active transport. A discrete class of proteins import or export ions and small molecules, such as glucose and amino acids, against a concentration gradient. These proteins use the energy stored in the electrochemical gradient of a directly-pumped ion to power the uphill movement of another substance, a process called cotransport. Direct active transport of the ion establishes a concentration gradient. When this is relieved by facilitated diffusion, the energy released can be harnessed to the pumping of some other ion or molecule. Symport pumps: the driving cotransported ion (H+,Na+) and the transported molecule pass through the membrane pump in the same direction. The driving ions flow down their concentration gradient while the coupled molecules are pumped up theirs; later the ion is pumped back out of the cell by a direct active transport process. Antiport pumps: the driving ion (again, usually sodium, proton/phosphate/succinate/nitrite/) diffuses through the pump in one direction providing the energy for the active transport of some other molecule or ion in the opposite direction. In any case, no direct chemical change in the database.
-
–
In the database, other transport reactions also appear. Some do not involve chemical transformation like for indirect active transport: via ton system, or secretion (without known transport mechanism). A second class involve chemical transformation of metabolites along transport: pep-pyr system, oxidative phosphorylation, vectorial Co-A coupling, nitrogen metabolism, etc..
In relation to the bipartite network representation, one needs to differentiate the different transport mechanism: diffusion, transport without chemical transformation, and transport involving chemical transformation of carriers (see Fig. 5).
Diffusion reactions do not transform any compound and involve the same metabolite both as input and output (self-loops in a metabolite one-mode projection), and so require some specific treatment. One possibility is to consider the metabolites in both parts of the reaction as different entities, the effective pair. Since this is the only pair entering such reactions, the topological score is expected to be low as for isomerization reactions. However, since the metabolite is the same with the same properties, a better option in this case is to neglect these reactions and do not differentiate the metabolite in different compartments.
Other transport reactions without chemical transformation involve more than one metabolite, usually two that change compartment. In topological terms, this is a situation analogous to diffusion and the same treatment of ignoring the reaction and taking the metabolite in different compartments as the same can be applied.
Transport reactions that need to transform metabolites to transfer a compound have different metabolites entering and leaving the reaction except the compound that is transported across compartments. To be consistent with the previous treatments, that metabolite in different compartments would be treated as a single entity.
Finally, chemical transformation reactions that happen in more than one compartment (or that need some component of a different compartment from where it is happening) can be treated as chemical transformation reactions inside compartments.

In summary (see Table 1), we take metabolites as the same entity independently of the compartment and we obviate isomerizations, exchange, and diffusion reactions. This leaves a total of reactions out of that involve metabolites out of (isomers have been identified with the same id). Apart from the identification of isomers, 5 metabolites have been removed ( (id 30), (id 60), (id 383), (id 651), and (id 654)) because they do not enter in any transformation reaction. They seem to be necessary to transfer compounds (typically but also others) across compartments.
| Classification of reactions in E. Coli metabolic network | ||||
|---|---|---|---|---|
| Type | ID | Description | Number of reactions | Included in graph |
| internal | 1 | cytosol | 1100 | Yes |
| 2 | isomerization in cytoplasm | 59 | No | |
| 3 | periplasm | 190 | Yes | |
| 4 | isomerization in periplasm | 2 | No | |
| 5 | extra-organism | 8 | Yes | |
| exchange | 6 | sinks in cytosol | 5 | No |
| 7 | exchange in extra-organism | 299 | No | |
| transport | 8 | diffusion, facilitated diffusion, via vector, channel, flipping | 346 | No |
| 9 | ABC system, direct active transport (+1 detoxification) | 124 | Yes | |
| 10 | symport, +1 similar reaction ID 11690 | 124 | No | |
| 11 | antiport, +6 similar reactions Ids 11407, 11409, 11411, 11413, 11415, 11835 | 50 | No | |
| 12 | ton system | 11 | No | |
| 13 | secretion (transport mechanism not known) | 6 | No | |
| 14 | reactions with transformation involving different compartments (pep:pyr, oxidative phosphorylation, vectoral Co-A coupling, nitrogen metabolism, etc.) | 57 | Yes | |
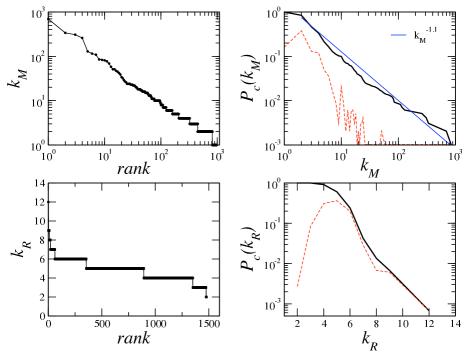
In Fig. 6, we show the cumulative bipartite degree distribution both for metabolites and reactions. The degree of a metabolite is taken as the number of reactions it participates in and the degree of a reaction is the number of different metabolites it involves. The number of metabolites entering into a reaction follows a homogeneous distribution with mean and mode . In contrast, the number of reactions in which a metabolite participates displays a scale free degree distribution with an average degree . Currency metabolites are the most connected substrates, some with more than a hundred and up to connections (, , , , , , , ).
The average nearest neighbors bipartite degree of metabolites and reactions is displayed in Fig. 7. The rising of the average levels for higher values of the degrees means that the reactions involving more metabolites also involve more carrier metabolites (hubs). compartments and also enter in exchange reactions.