Optical properties of the iron-arsenic superconductor BaFe1.85Co0.15As2
Abstract
The transport and complex optical properties of the electron-doped iron-arsenic superconductor BaFe1.85Co0.15As2 with K have been examined in the Fe-As planes above and below . A Bloch-Grüneisen analysis of the resistivity yields a weak electron-phonon coupling constant . The low-frequency optical response in the normal state appears to be dominated by the electron pocket and may be described by a weakly-interacting Fermi liquid with a Drude plasma frequency of cm-1 ( eV) and scattering rate cm-1 ( meV) just above . The frequency-dependent scattering rate has kinks at and 55 meV that appear to be related to bosonic excitations. Below the majority of the superconducting plasma frequency originates from the electron pocket and is estimated to be cm-1 ( Å) for , indicating that less than half the free carriers in the normal state have collapsed into the condensate, suggesting that this material is not in the clean limit. Supporting this finding is the observation that this material falls close to the universal scaling line for a BCS dirty-limit superconductor in the weak-coupling limit. There are two energy scales for the superconductivity in the optical conductivity and photo-induced reflectivity at meV and meV. This corresponds to either the gapping of the electron and hole pockets, respectively, or an anisotropic s-wave gap on the electron pocket; both views are consistent with the model.
pacs:
74.25.Gz, 74.70.Xa, 78.30.-jI Introduction
Since its discovery nearly a century ago, the field of superconductivity has periodically reinvented itself. A significant advance in the understanding of this phenomenon was achieved through the model by Bardeen, Cooper and Schrieffer (BCS), which proposed that below a critical temperature electrons condense into pairs which are coupled through lattice vibrations;Bardeen et al. (1957) these so-called Cooper pairs are bosons which constitute a supercurrent that may flow without loss. Below an isotropic s-wave gap also opens in the spectrum of excitations across the Fermi surface. Within this model, it was thought that the ’s of conventional metals and alloys could not exceed K (Ref. McMillan, 1968). The discovery of superconductivity at elevated temperatures in the copper-oxide materialsBednorz and Mueller (1986) with ’s in excess of 130 K at ambient pressure and an unusual d-wave superconducting energy gapVan Harlingen (1995) indicates that these materials are not phonon mediated; indeed, the coupling mechanism in these materials remains unresolved and a subject of considerable debate. The discovery of superconductivity in MgB2 with a surprisingly high transition temperature K intially suggested an unusual pairing mechanism.Nagamatsu et al. (2001) However, the isotope effect firmly established that this material is phonon mediated;Bud’ko et al. (2001) in this case the high phonon frequencies in MgB2 are likely responsible for the enhanced critical temperature.Kortus et al. (2001)
The recent discovery superconductivity in the iron-arsenic LaFeAsO1-xFx (1111) compoundKamihara et al. (2008) at ambient pressure ( K) was surprising because iron and magnetic impurities in general were considered detrimental to the formation of superconductivity; ’s K in this material were quickly achieved through rare-earth substitutions.Ren et al. (2008a, b); Wang et al. (2008); Ishida et al. (2009) While such high values for do not necessarily rule out a phonon-mediated pairing mechanism, the close proximity of magnetic order and superconductivity in these compoundsde la Cruz et al. (2008) has lead to the suggestion that the pairing in this class of materials may have another origin.Boeri et al. (2008, 2009); Mazin (2010); Johnston (2010) While the highest ’s are observed in the 1111 compounds, large single crystals of these materials have proven difficult to grow. For this reason attention has shifted to the structurally-simpler BaFe2As2 (122) materials, where large single crystals are readily available. Unlike the cuprates, the parent compound is metallic with a structural and magnetic transition at K, below which it remains metallic.Rotter et al. (2008a) The emergence of superconductivity and the suppression of the magnetic and structural transitions may be achieved through the application of pressureAlireza et al. (2009) or through chemical substitution;Ren et al. (2009); Rotter et al. (2008b); Sefat et al. (2008); Li et al. (2009) K-doping results in a hole-doped material with a maximum K, while Ni- and Co-doping result in electron-doped materials with a somewhat lower maximum K. The electron- and hole-doped materials have been the subject of numerous investigations, including thermodynamic and transport studies,Rotter et al. (2008b); Sefat et al. (2008); Ren et al. (2008c); Li et al. (2009); Fang et al. (2009); Park et al. (2009); Yuan et al. (2009); Martin et al. (2009); Bud’ko et al. (2009); Rullier-Albenque et al. (2009); Yashima et al. (2009); Gofryk et al. (2010); Ning et al. (2010); Tanatar et al. (2010); Reid et al. (2010) angle-resolved photoemissionDing et al. (2008); Liu et al. (2008); Khasanov et al. (2009); Evtushinsky et al. (2009); Koitzsch et al. (2009); Zabolotnyy et al. (2009); Terashima et al. (2009); Sekiba et al. (2009); Liu et al. (2010); Nakayama et al. (ARPES), RamanLitvinchuk et al. (2008); Chauvière et al. (2009); Rahlenbeck et al. (2009); Muschler et al. (2009) and optical studies.Li et al. (2008); Hu et al. (2009); Yang et al. (2009); Wu et al. (2009a); Fischer et al. ; van Heumen et al. (2010); Kim et al. (2010); Gorshunov et al. (2010); Nakajima et al. (2010); Wu et al. (2010a); Marsik et al. (2010); Perucchi et al. ; Barišić et al. (2010); Dressel et al. ; Lucarelli et al. (2010); Lobo et al. Several of these studies address the nature of the superconducting gaps, such as whether there are multiple gaps and whether the gaps contain nodes. The experimental picture is not clear. The isotope effect in these materials is also uncertain; while a large Fe isotope effect has been reported in BaFe2As2 and Ba0.6K0.4Fe2As2 polycrystals,Liu et al. (2009) an inverse iron isotope effect has also been observed.Shirage et al. (2009)
Despite the structural differences of the iron-arsenic compounds, the band structure of these materials is remarkably similar, with a minimal description consisting of a hole band () centered at the point and an electron band () at the point of the Brillouin zone.Raghu et al. (2008); Singh and Du (2008); Singh (2008) The mobilities are thought to be significantly higher in the electron bands.Rullier-Albenque et al. (2009) Several theoretical modelsMazin et al. (2008); Kuroki et al. (2008); Maier and Scalapino (2008); Chubukov et al. (2008) propose that below superconducting s-wave energy gaps form on the electron and hole pockets, possibly with a sign change between them, the so-called model. In the model the gap on the electron pocket may be an extended s-wave with nodes on its Fermi surface;Chubukov et al. (2009) it is possible that disorder may lift the nodes.Mishra et al. (2009)
In this work the electron-doped BaFe1.85Co0.15As2 superconductor ( K) has been examined using several different techniques. The temperature dependence of the ab-plane resistivity is analyzed using a simple Bloch-Grüneisen framework, yielding an upper-bound for the electron-phonon coupling constant of . The complex optical properties in the iron-arsenic planes have been examined in the normal and superconducting states. In the normal state, the free carrier response is dominated by the electron pocket and may be described by a simple Drude-Lorentz model. In the generalized-Drude response for the frequency-dependent scattering rate shows clear kinks at about meV and 55 meV, suggesting scattering from bosonic excitations. Below the formation of a condensate is observed; however, less than 50% of the free carriers condense, suggesting this material is not in the clean limit. Supporting this view is the observation that this material is observed to fall close to the universal scaling line for a BCS dirty-limit superconductor in the weak-coupling limit. In order to properly model the optical conductivity below it is necessary to introduce two superconducting energy gaps at meV and meV. This corresponds to either the gapping of the electron and hole pockets, respectively, or the gapping of the electron pocket by an anisotropic s-wave gap; both results are consistent with the model. The time evolution of the photoinduced reflectivity change in the superconducting state yields almost identical values for the gaps. These results indicate that there are two energy scales for the superconductivity in BaFe1.85Co0.15As2 and that the pairing is likely not phonon mediated.
II Experiment
Large single crystals of the iron-arsenic superconductor BaFe2-xCoxAs2 were grown by a self-flux method.Li et al. (2009) Energy dispersive x-ray (EDX) microanalysis was used to determine that the Co concentration was at the optimal level. The resistivity in the ab-planes was measured using a standard four-probe method. The temperature dependence of the resistivity of a single crystal of BaFe1.85Co0.15As2 is shown in Fig. 1; the resistivity displays a slight curvature before abruptly going to zero at K, with a transition width of less than 0.7 K (inset of Fig. 1).

The temperature-dependent reflectance was measured at a near-normal angle of incidence from to over 25,000 cm-1 ( meV to 3 eV) on a cleaved surface for light polarized in the ab-planes using in situ evaporation technique.Homes et al. (1993) This large frequency interval is needed to carry out a reliable Kramers-Kronig analysis where extrapolations are supplied in the limits for . For the transient reflectivity measurements, a Ti:sapphire laser system which can deliver 100-fs short pulses at an 80-MHz repetition rate, tunable at 800 nm (1.55 eV), was used as the source of both pump and probe pulses. A standard pump-probe setup is employed with the pump beam having a spot-diameter of 60 m and the time-delayed probe beam with spot-diameter of 30 m. The pump beam was modulated at 2 kHz with an optical chopper and a lock-in amplifier was used to measure the transient reflectivity change, , of the probe beam.
III Results and discussion
III.1 Optical properties
III.1.1 Normal state
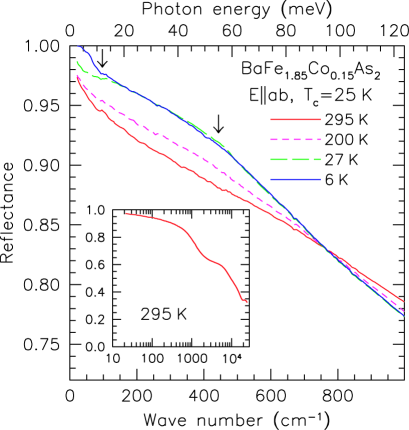
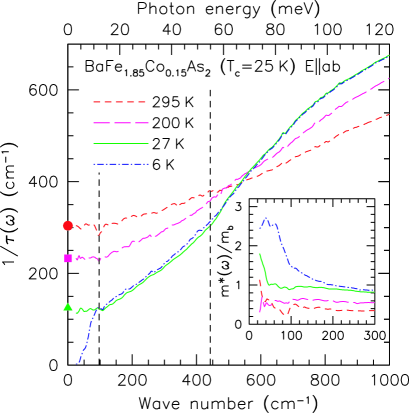
The temperature dependence of the reflectance of BaFe1.85Co0.15As2 for light polarized in the ab-planes is shown in the infrared region in Fig. 2 for several temperatures above and below ; the reflectance at 295 K is shown over a much larger region in the inset. In the normal state, the reflectance at low frequency has a response characteristic of a metal in the Hagen-Rubens regime. In addition to this generic response, just above at 27 K there are two inflection points in the reflectance (indicated by arrows) at and 55 meV, which may result from scattering of the carriers with underlying bosonic excitations. Below the superconducting state displays a clear signature in the reflectance. However, the reflectance is a complex quantity consisting of an amplitude and a phase, . Normally, only the amplitude is measured so it is not always intuitively obvious what changes in the reflectance indicate. For this reason, the complex optical properties have been calculated from a Kramers-Kronig analysis of the reflectance.Dressel and Grüner (2001)
The temperature dependence of the real part of the optical conductivity of BaFe1.85Co0.15As2 in the far-infrared region is shown in Fig. 3. At room temperature the conductivity decreases slowly with increasing frequency giving way, not unlike the high- cuprates,Tu et al. (2002) to a rather flat response in the mid-infrared region followed by a pronounced peak at about 5200 cm-1 (shown in the inset). At room temperature a weak infrared-active mode at about 94 cm-1 is observed that involves in-plane displacements of the Ba atoms,Litvinchuk et al. (2008) a second mode expected at 253 cm-1 is a weak feature observed only a low temperatures, suggesting that this mode may be broadened due to disorder effects.Akrap et al. (2009) As the temperature is reduced the low-frequency conductivity increases as a result of the transfer of spectral weight from high to low frequencies, and the low-frequency mode becomes more difficult to observe. The spectral weight is defined simply as the area under the conductivity curve over a given interval, .
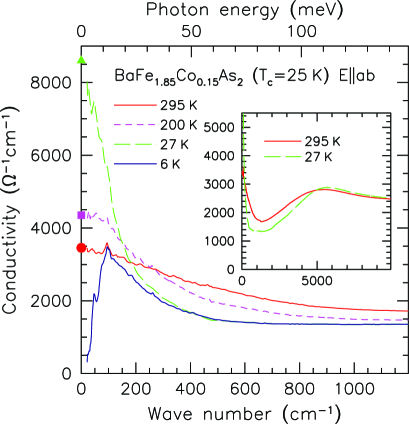
It is important to note that the values for the dc conductivity in Fig. 1 at 295, 200 and 27 K are in good agreement with the extrapolated values in Fig. 3; the fact that establishes a connection with transport and illustrates the self-consistent nature of this optical technique.
| Type | , | , | (Å) | |
| D1 | 113 | 6943 | 58 | |
| D2 | 5720 | 19980 | 0.4 | |
| L1 | 5170 | 5730 | 22070 | |
| D1 | 126 | 7790 | 53 | |
| D2 | 608 | 1956 | 3.5 | |
| L1 | 1124 | 5560 | 18930 | |
| L2 | 5190 | 5780 | 22470 | |
| D1 | 126 | 7840 | 53 | |
| L1 | 1016 | 5070 | 18250 | |
| L2 | 5200 | 5870 | 22980 |
One technique to reproduce the optical conductivity assumes that because these materials are multiband systems that the free-carrier response can be described by separate contributions from the electron and hole pockets, while the optical properties at high frequency are described by bound excitations. In a Drude-Lorentz model, this description results in the linear combination of two Drude components.Wu et al. (2010a) The Drude-Lorentz model for the dielectric function can be written as
where is the real part of the dielectric function at high frequency, and are the square of the plasma frequency and scattering rate for the delocalized (Drude) carriers in the th pocket, respectively; , and are the position, width, and strength of the th vibration or excitation. The complex conductivity is .
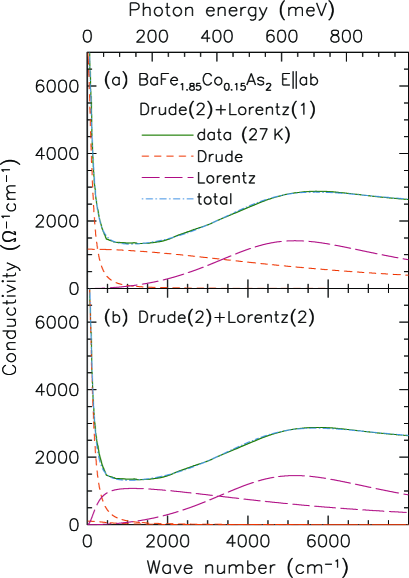
The results of the two-Drude fit to the real part of the optical conductivity just above at 27 K are shown in Fig. 4(a) and summarized in Table 1. The two Drude responses may be characterized as “narrow” ( cm-1) and “broad” ( cm-1); an additional Lorentz oscillator at cm-1 has also been included as well as several others above 1 eV that are not allowed to vary (not listed in Table 1). While the fit to the data is quite good, the scattering rate for the broad Drude component is more than 50 times that of the narrow component, which raises the issue as to whether this represents a mean-free path that is physically meaningful ( is the Fermi velocity and is the scattering time of the th pocket). There are a range of values in the literature for the Fermi velocities for the electron and hole pockets in the iron-arsenic materials. Based on photoemission study of BaFe1.85Co0.15As2 (Ref. Sekiba et al., 2009), we estimate that the Fermi velocity of the hole pocket to be meVÅ, or cm/s. This result is less than the value determined from a band structure estimate of for the hole pocket in a related material ( cm/s).Singh and Du (2008) However, it has been noted that band-structure results often have to be renormalized to agree with photoemission results.Neupane et al. The velocity of electron pocket is more difficult to calculate. As an estimate we will use the renormalization of the hole pocket Fermi velocity to the band structure estimate of on the electron pocketSingh and Du (2008) to obtain cm/s. We associate the narrower Drude component with the electron pocket with s which leads to a mean-free path of Å, or about 15 unit cells ( Å in the I4/mmm setting). Associating the broad Drude component with the hole pocket with s leads to a mean-free path of Å, which is less than the shortest interatomic spacing; even a substantial increase in will not alter this condition. This places the mean-free path below the Mott-Ioffe-Regel limitMott (1972); Gurvitch (1981); Hussey et al. (2010) and indicates that the conductivity in this band is no longer metallic but is instead incoherent, and is best described by a bound excitation, or a series of bound excitations.
This suggests that it is appropriate to include a low-frequency bound excitation which my arise from localization effects or from interband transitions.van Heumen et al. (2010); Hancock et al. (2010) We have therefore considered the case of two Drude contributions as well as two low-frequency Lorentz oscillators; as in the previous case oscillators above 1 eV are not fitted quantities nor are their values changed from the previous instance. The results of the fit to the data at 27 K are shown in Fig. 4(b) and are summarized in the middle frame of Table 1. The narrow Drude component at 27 K is only slightly broader than the same component in the previous approach, resulting in a slightly shorter mean-free path for the electron pocket Å. Much of the spectral weight formerly associated with the broad Drude component has shifted to shifted to a Lorentzian centered at cm-1, resulting in a dramatic reduction of the scattering rate, cm-1 and a commensurate increase of the mean-free path Å or ; this value is still close to the Mott-Ioffe-Regel limit and it is debatable as to whether or not this constitutes metallic transport. While the uncertainties associated with most of the fitted parameters (determined from the covariance) are % , the broad and weak Drude component is difficult to fit and the errors associated with it are considerably larger, %. If there are indeed two Drude components then the electron pocket dominates and the hole pocket represents at best a weak, possibly incoherent, background contribution as shown in Fig. 4(b).
For completeness we have also considered the case of a single Drude component and two low-frequency Lorentz oscillators; the results of this fit are summarized at the bottom of Table 1. With the exception of the absence of the second Drude component, the results are essentially the same as Fig. 4(b). The width of the narrow Drude component is unchanged and the slight increase in strength reflects the fact that it has absorbed the spectral weight formerly associated with the broad Drude component. We conclude that despite the presence of multiple bands in this material, for optimal doping the normal-state transport is dominated by the single electron pocket. The fitted values for the Drude parameters at 295, 200 and 27 K are cm-1 (or 0.972 eV) and , 233 and 126 cm-1, respectively.
III.1.2 Superconducting state
Below there is a dramatic decrease in the low-frequency optical conductivity due to the formation of a superconducting energy gap. This “missing area” is referred to as the spectral weight of the condensate and may be calculated from the Ferrell-Glover-Tinkham sum ruleFerrell and Glover, III (1958); Tinkham and Ferrell (1959)
Here is the square of the superconducting plasma frequency and superfluid density is ; the cut-off frequency cm-1 is chosen so that the integral converges smoothly. The superconducting plasma frequency has also been determined from in the low frequency limit where . Yet another method of extracting from is to determine in the limit.Jiang et al. (1996) All three techniques yield cm-1, indicating that less than one-half of the free-carriers in the normal state have condensed (). In a clean-limit system the scattering rate associated with the Drude free-carrier response is much smaller than the size of the fully-formed isotropic optical superconducting energy gap . As a result the full spectral weight of the Drude component lies below the optical gap ; for all of the free carriers collapse into the condensate and . In materials where the size of the free-carrier scattering rate and the optical gap are comparable, (the so-called dirty limit) a significant amount of the Drude spectral weight lies above . As a result for the free carriers are gapped and there is no residual Drude component at low temperature; however, only a fraction of the Drude spectral weight below the optical gap collapses into the condensate, leading to the condition that . This is precisely what we observe, implying that this material is not in the clean limit. The superfluid density can also be expressed as an effective penetration depth Å, which is in good agreement with other optical measurementsvan Heumen et al. (2010); Gorshunov et al. (2010); Kim et al. (2010); Nakajima et al. (2010); Wu et al. (2010a); Marsik et al. (2010) as well as estimates based on other techniques for materials with similar cobalt concentrations.Williams et al. (2009); Gordon et al. (2009); Luan et al. (2010)
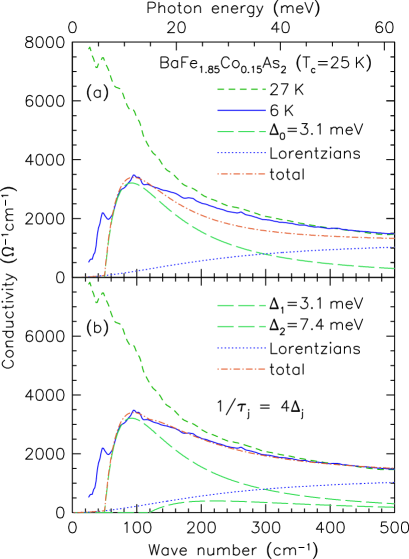
The low-frequency optical conductivity is shown in more detail in Fig. 5. As previously noted, below there is a dramatic reduction of the conductivity below about 80 cm-1 ( meV), which sets the energy scale for the superconducting energy gap and the optical gap [here we adopt the convention that ]. We note that based on this initial estimate it appears that , suggesting that the conductivity in this material can be modeled using a Mattis-Bardeen approachMattis and Bardeen (1958) for the contribution from the gapped excitations.Zimmermann et al. (1991) This dirty-limit approach is consistent with the observation that less than 50% of the free carriers in the normal state collapse into the condensate for . Note that in this instance, “dirty” refers to scattering from disorder and/or electronic correlations in addition to any possible impurity effects. In Fig. 5(a) the optical conductivity in the superconducting state is described by a single isotropic gap meV () with a moderate amount of elastic scattering [, which is approximately the previously determined value of just above ] in linear combination with the low-frequency tails of the mid-infrared Lorentzian oscillators. While the leading-edge of the conductivity is described fairly well, there is a noticeable disagreement above about 140 cm-1.
To properly model the conductivity over the entire far-infrared region, two isotropic gap features are considered at meV and meV with for . In combination with the Lorentzian tails, the two-gap scenario shown in Fig. 5(b) fits the data quite well. The gap amplitudes determined here are in excellent agreement with recent optical results on BaFe2-xCoxAs2 for a similar cobalt concentration,Fischer et al. ; van Heumen et al. (2010) as well as photoemissionTerashima et al. (2009) and tunneling results.Massee et al. (2009) While the lower gap ratio is close to the BCS weak coupling limit of 3.5, the upper gap ratio is considerably larger. While the data below about 40 cm-1 is not reproduced exactly, there is a considerable uncertainty associated with the conductivity in this spectral region. This suggestion that the Fermi surface is completely gapped in the optimally-doped material is in agreement with thermodynamic studies.Tanatar et al. (2010); Reid et al. (2010)
The examination of the normal-state concluded that while the low-frequency optical properties were dominated by the electron pocket, a weak contribution from the hole pocket might also be present. In in the formalism employed here, the inclusion of a second gap necessarily implies a second band. The calculated Drude response just above in Fig. 5(b) for the two bands (not shown) is , where cm-1 and cm-1 for the bands associated with the small and large gaps, respectively. Given that , where is the plasma frequency associated with the th band, and and recalling that , we estimate that cm-1 and cm-1. Once again it is the case that a single band dominates and that over 75% of the superconducting condensate originates from the gapping of this band.
In the simple approach employed here, the two energy scales for the gaps result from the gapping of two separate bands. This view is consistent with ARPES measurementsDing et al. (2008); Khasanov et al. (2009); Evtushinsky et al. (2009); Koitzsch et al. (2009); Zabolotnyy et al. (2009); Terashima et al. (2009) that indicate that both the electron and hole pockets are likely completely gapped below . However, it is clear that the coherent transport in the normal state arises mainly from the electron pocket. It is therefore also possible that the two energy scales for the superconducting energy gaps observed here are due to single anisotropic s-wave gap on the electron pocket, which is favored within the model. Because there is some uncertainty in the optical measurements with respect to the amplitude of the larger gap, time-domain measurements were performed.
III.2 Time-domain spectroscopy
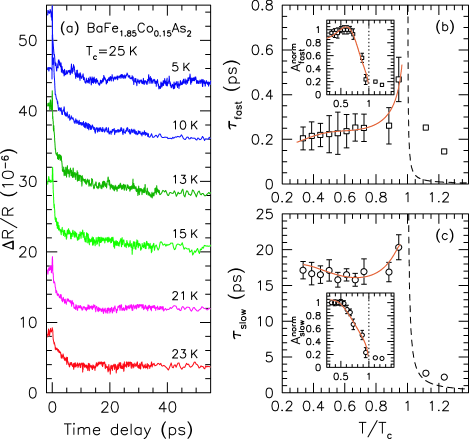
The details of the superconducting gap properties have been investigated in the time-domain. Fig. 6(a) shows the time evolution of the photo-induced reflectivity change, as a function of temperature at 800 nm. The data is fitted by ; shows a bi-exponential decay with relaxation times ps and ps. These two decay signals are the result of Cooper-pair recombination following the photo-excitation. Figs. 6(b) and 6(c) show the temperature dependence of the relaxation times ( and ) and the peak amplitudes are shown in the insets ( and ). The fact that does not return to its value at above about 45 ps is due to a negative component with a long relaxation time (ns), not a rise time. This negative component is a common feature in photo-induced reflectivity measurements of complex metallic systems involving magnetism such as colossal magnetoresistance materialsRen et al. (2008d) and the high- cuprates;Chia et al. (2007) this component is not related to the superconductivity. The phenomenological Rothwarf-Taylor (RT) modelRothwarf and Taylor (1967) is used to describe the quasiparticle dynamics
and
Here and are the total density of quasiparticles and high-frequency bosons, respectively, is the probability for pair breaking by high-frequency boson absorption, is the bare quasiparticle recombination rate, is the density of high-frequency bosons in equilibrium, and is their decay rate. We obtain the normalized amplitude of the signal (to its low-temperature value), via the relation: , where the density of the thermally excited quasiparticles, , with as a fitting parameter and obeying a BCS temperature dependence. Moreover, for a constant pump intensity and assuming is temperature independent, we obtain the temperature dependence of the relaxation time by the temperature dependence of :
where and are fitting parameters. Since the temperature dependence of and are measured directly, we can accurately determine the values of the superconducting gaps, meV and meV. These gap values are in excellent agreement with the optical estimates determined in the previous section.
III.3 Electron-phonon coupling
The temperature dependence of the ab-plane resistivity (Fig. 1) has been fit using the generalized Bloch-Grüneisen formulaGrüneisen (1933); Deutsch (1987); Kong et al. (2001); Mamedov and Askerov (2007)
where
In this instance the integer value implies that the resistance is due to the scattering of electrons by phonons. The Debye temperature is set to 250 K (Ref. Ni et al., 2008), and the plasma frequency has been previously determined to be eV. The fit, shown by the dashed curve in Fig. 1 yields m-cm and an upper bound for the transport electron-phonon coupling constant . This experimental estimate of value is in excellent agreement with the theoretical value of (Ref. Boeri et al., 2008) which yields a maximum K. However, to get a more accurate estimate of the electron-boson coupling constant from the resistivity, the temperature dependence of the underlying bosonic spectra needs to be considered.
III.4 Electron-boson coupling
The kinks observed in the normal-state reflectance in Fig. 2 at and 55 meV suggest scattering from underlying bosonic excitations. In order to investigate this further the generalized Drude model has been considered in which the scattering rate and the effective mass are allowed to adopt a frequency dependenceAllen and Mikkelsen (1977); Puchkov et al. (1996)
and
where the is the bandmass; and is a frequency-dependent electron-boson coupling constant. In this instance we set and (although the choice of has little effect on the scattering rate or the effective mass in the far-infrared region). The temperature dependence of is shown in Fig. 7, and the inset shows the temperature dependence of . In the normal state, in accord with the Drude model, the scattering rate is constant below cm-1 and . However, above meV there is an abrupt increase in the scattering rate for [the large change in for is due to the formation of one or more superconducting energy gaps]; another kink is observed at meV. Interestingly, the effective mass enhancement is rather small , indicating that the electron-boson coupling ; this is significantly smaller than the values of that have recently been reported.Yang et al. (2009); Wu et al. (2010b)
The electron-boson spectral function can in be calculated from using a maximum-entropy technique based on Eliashberg theory.Schachinger et al. (2003) Such an analysis has recently been performed on a material with an almost identical cobalt concentration and will not be repeated here; the peaks in the electron-boson spectral function in that workWu et al. (2010b) are observed at and 45 meV, which is in good agreement with the kinks observed in the present study in at and 55 meV. The low-energy peak is associated with the resonance peak in the spin excitation spectrum obtained from inelastic neutron scattering data,Inosov et al. (2010) which when considered with the relatively weak electron-phonon interaction in this material, suggests that the superconductivity in this material may be mediated by magnetic interactions.Wu et al. (2010b) The high-energy kink lies above the highest measured phonon energy;Yildirim (2009) however, muon-spin relaxation measurementsCarlo et al. (2009) on a number of iron pnictides suggest an antiferromagnetic energy scale of meV indicating a possible magnetic origin for this feature. It is not clear if this boson plays a role in the superconductivity or not; however, we speculate that any mechanism that did couple to the high-energy boson might display a significantly enhanced , suggesting that higher values for in this class of materials may yet be possible.
III.5 Scaling of the superfluid density
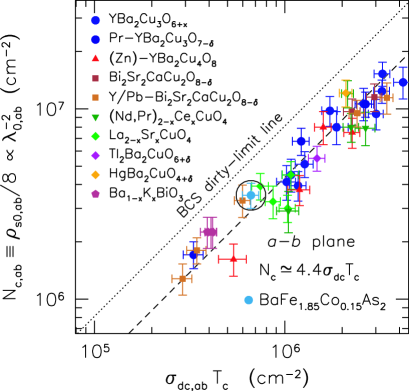
It has been demonstrated that a Uemura-type of scaling between the superfluid density and breaks down in the hole-doped Ba0.6K0.4Fe2As2 material.Ren et al. (2008c) However, it has also been demonstrated that a number of the iron pnictide and chalcogenide materialsWu et al. (2009b); Homes et al. (2010) the superfluid density falls on a recently proposed empirical scaling relation for the cuprate superconductors,Homes et al. (2004, 2005) shown by the dashed line in Fig. 8,
From the estimate of cm-1 for (determined from Fig. 3, as well as Drude-Lorentz fits), and the previously determined value of cm-2, we can see that BaFe1.85Co0.15As2 also falls on this scaling line in the region of the moderately-underdoped cuprates. The dotted line in Fig. 8 is the calculated result for a a BCS dirty-limit superconductor in the weak-coupling limit in which the numerical constant in the scaling relation is calculated to be slightly larger,Homes et al. (2005) . This scaling behavior is consistent with the observation that this material is not in the clean limit.
IV Conclusions
The optical and transport properties of the iron-arsenic superconductor BaFe1.85Co0.15As2 ( K) have been measured over a wide temperature and frequency range. A Bloch-Grüneisen analysis of the resistivity indicates that the electron-phonon coupling is fairly weak, suggesting that the superconductivity in this material is not mediated by lattice vibrations. The optical properties in the normal state are dominated by the electron pocket and may be described as a weakly-interacting Fermi liquid, or Drude model, with cm-1 and cm-1 just above at 27 K. The frequency-dependent scattering rate displays kinks at and 55 meV that correspond to peaks in the electron-boson spectral function, both of which are believed to be magnetic in origin, and suggest that the pairing in this material may be mediated by magnetic interactions. In the superconducting state for the superconducting plasma frequency cm-1, which corresponds to an effective penetration depth of Å. This indicates that only about 50% of the free-carriers in the normal-state condense into the condensate, suggesting this material is not in the clean limit. In agreement with the results of other workers, this material is observed to fall on the universal scaling line for a BCS dirty-limit superconductor, and is also close to many underdoped cuprates. The energy scales observed for the superconducting energy gaps meV and meV correspond to either the gaps on the electron and hole pockets, respectively, or the minimum and maximum values for an anisotropic s-wave gap on the electron pocket, in accord with the model. The spectrum of excitations appears to be fully gapped, suggesting an absence of nodes at optimal doping in this material.
Acknowledgements.
We would like to thank A. Akrap, J. L. Birman, G. L. Carr, A. V. Chubukov, K. Felix, D. H. Lee, I. Mazin, P. Richard, E. Schachinger, D. J. Singh and H. Yang and for helpful discussions, and J. P. Carbotte for performing an inversion of the optical data. Work was supported by the National Science Foundation, and the National Science Foundation of China. Work at Brookhaven National Laboratory was supported in part by the Office of Science, U.S. Department of Energy under Contract No. DE-AC02-98CH10886.References
- Bardeen et al. (1957) J. Bardeen, L. N. Cooper, and J. R. Schrieffer, Phys. Rev. 108, 1175 (1957).
- McMillan (1968) W. L. McMillan, Phys. Rev. 167, 331 (1968).
- Bednorz and Mueller (1986) J. G. Bednorz and K. A. Mueller, Z. Phys. B 64, 189 (1986).
- Van Harlingen (1995) D. J. Van Harlingen, Rev. Mod. Phys. 67, 515 (1995).
- Nagamatsu et al. (2001) J. Nagamatsu, N. Nakagawa, T. Muranaka, Y. Zenitani, and J. Akimitsu, Nature (London) 410, 63 (2001).
- Bud’ko et al. (2001) S. L. Bud’ko, G. Lapertot, C. Petrovic, C. E. Cunningham, N. Anderson, and P. C. Canfield, Phys. Rev. Lett. 86, 1877 (2001).
- Kortus et al. (2001) J. Kortus, I. I. Mazin, K. D. Belashchenko, V. P. Antropov, and L. L. Boyer, Phys. Rev. Lett. 86, 4656 (2001).
- Kamihara et al. (2008) Y. Kamihara, T. Watanabe, M. Hirano, and H. Hosono, J. Am. Chem. Soc. 130, 3296 (2008).
- Ren et al. (2008a) Z.-A. Ren, J. Yang, W. Lu, W. Yi, X.-L. Shen, Z.-C. Li, G.-C. Che, X.-L. Dong, L.-L. Sun, F. Zhou, and Z.-X. Zhao, EPL 82, 57002 (2008a).
- Ren et al. (2008b) Z.-A. Ren, G.-C. Che, X.-L. Dong, J. Yang, W. Lu, W. Yi, X.-L. Shen, Z.-C. Li, L.-L. Sun, F. Zhou, and Z.-X. Zhao, EPL 83, 17002 (2008b).
- Wang et al. (2008) C. Wang, L. Li, S. Chi, Z. Zhu, Z. Ren, Y. Li, Y. Wang, X. Lin, Y. Luo, S. Jiang, X. Xu, G. Cao, and Z. Xu, EPL 83, 67006 (2008).
- Ishida et al. (2009) K. Ishida, Y. Nakai, and H. Hosono, J. Phys. Soc. Japan 78, 062001 (2009).
- de la Cruz et al. (2008) C. de la Cruz, Q. Huang, J. W. Lynn, J. Li, W. Ratcliff II, J. L. Zarestky, H. A. Mook, G. F. Chen, J. L. Luo, N. L. Wang, and P. Dai, Nature (London) 453, 899 (2008).
- Boeri et al. (2008) L. Boeri, O. V. Dolgov, and A. A. Golubov, Phys. Rev. Lett. 101, 026403 (2008).
- Boeri et al. (2009) L. Boeri, O. Dolgov, and A. Golubov, Physica C 469, 628 (2009).
- Mazin (2010) I. I. Mazin, Nature 464, 183 (2010).
- Johnston (2010) D. C. Johnston, Adv. Phys. 59, 803 (2010).
- Rotter et al. (2008a) M. Rotter, M. Tegel, D. Johrendt, I. Schellenberg, W. Hermes, and R. Pöttgen, Phys. Rev. B 78, 020503 (2008a).
- Alireza et al. (2009) P. L. Alireza, Y. T. C. Ko, J. Gillett, C. M. Petrone, J. M. Cole, G. G. Lonzarich, and S. E. Sebastian, J. Phys.: Condens. Matter 21, 012208 (2009).
- Ren et al. (2009) Z. Ren, Q. Tao, S. Jiang, C. Feng, C. Wang, J. Dai, G. Cao, and Z. Xu, Phys. Rev. Lett. 102, 137002 (2009).
- Rotter et al. (2008b) M. Rotter, M. Tegel, and D. Johrendt, Phys. Rev. Lett. 101, 107006 (2008b).
- Sefat et al. (2008) A. S. Sefat, R. Jin, M. A. McGuire, B. C. Sales, D. J. Singh, and D. Mandrus, Phys. Rev. Lett. 101, 117004 (2008).
- Li et al. (2009) L. J. Li, Q. B. Wang, Y. K. Luo, H. Chen, Q. Tao, Y. K. Li, X. Lin, M. He, Z. W. Zhu, G. H. Cao, and Z. A. Xu, New J. Phys. 11, 025008 (2009).
- Ren et al. (2008c) C. Ren, Z.-S. Wang, H.-Q. Luo, H. Yang, L. Shan, and H.-H. Wen, Phys. Rev. Lett. 101, 257006 (2008c).
- Fang et al. (2009) L. Fang, H. Luo, P. Cheng, Z. Wang, Y. Jia, G. Mu, B. Shen, I. I. Mazin, L. Shan, C. Ren, and H.-H. Wen, Phys. Rev. B 80, 140508(R) (2009).
- Park et al. (2009) J. T. Park, D. S. Inosov, C. Niedermayer, G. L. Sun, D. Haug, N. B. Christensen, R. Dinnebier, A. V. Boris, A. J. Drew, L. Schulz, T. Shapoval, U. Wolff, V. Neu, X. Yang, C. T. Lin, B. Keimer, and V. Hinkov, Phys. Rev. Lett. 102, 117006 (2009).
- Yuan et al. (2009) H. Q. Yuan, J. Singleton, F. F. Balakirev, S. A. Baily, G. F. Chen, J. L. Luo, and N. L. Wang, Nature (London) 457, 565 (2009).
- Martin et al. (2009) C. Martin, R. T. Gordon, M. A. Tanatar, H. Kim, N. Ni, S. L. Bud’ko, P. C. Canfield, H. Luo, H. H. Wen, Z. Wang, A. B. Vorontsov, V. G. Kogan, and R. Prozorov, Phys. Rev. B 80, 020501(R) (2009).
- Bud’ko et al. (2009) S. L. Bud’ko, N. Ni, and P. C. Canfield, Phys. Rev. B 79, 220516(R) (2009).
- Rullier-Albenque et al. (2009) F. Rullier-Albenque, D. Colson, A. Forget, and H. Alloul, Phys. Rev. Lett. 103, 057001 (2009).
- Yashima et al. (2009) M. Yashima, H. Nishimura, H. Mukuda, Y. Kitaoka, K. Miyazawa, P. M. Shirage, K. Kihou, H. Kito, H. Eisaki, and A. Iyo, Journal of the Physical Society of Japan 78, 103702 (2009).
- Gofryk et al. (2010) K. Gofryk, A. S. Sefat, M. A. McGuire, B. C. Sales, D. Mandrus, J. D. Thompson, E. D. Bauer, and F. Ronning, Phys. Rev. B 81, 184518 (2010).
- Ning et al. (2010) F. L. Ning, K. Ahilan, T. Imai, A. S. Sefat, M. A. McGuire, B. C. Sales, D. Mandrus, P. Cheng, B. Shen, and H.-H. Wen, Phys. Rev. Lett. 104, 037001 (2010).
- Tanatar et al. (2010) M. A. Tanatar, J.-P. Reid, H. Shakeripour, X. G. Luo, N. Doiron-Leyraud, N. Ni, S. L. Bud’ko, P. C. Canfield, R. Prozorov, and L. Taillefer, Phys. Rev. Lett. 104, 067002 (2010).
- Reid et al. (2010) J.-P. Reid, M. A. Tanatar, X. G. Luo, H. Shakeripour, N. Doiron-Leyraud, N. Ni, S. L. Bud’ko, P. C. Canfield, R. Prozorov, and L. Taillefer, Phys. Rev. B 82, 064501 (2010).
- Ding et al. (2008) H. Ding, P. Richard, N. Nakayama, K. Sugawara, T. Arakane, Y. Sekiba, A. Takayama, S. Souma, T. Sato, T. Takahashi, Z. Wang, X. Dai, Z. Fang, G. F. Chen, J. L. Lou, and N. L. Wang, EPL 83, 47001 (2008).
- Liu et al. (2008) C. Liu, G. D. Samolyuk, Y. Lee, N. Ni, T. Kondo, A. F. Santander-Syro, S. L. Bud’ko, J. L. McChesney, E. Rotenberg, T. Valla, A. V. Fedorov, P. C. Canfield, B. N. Harmon, and A. Kaminski, Phys. Rev. Lett. 101, 177005 (2008).
- Khasanov et al. (2009) R. Khasanov, D. V. Evtushinsky, A. Amato, H.-H. Klauss, H. Luetkens, C. Niedermayer, B. Büchner, G. L. Sun, C. T. Lin, J. T. Park, D. S. Inosov, and V. Hinkov, Phys. Rev. Lett. 102, 187005 (2009).
- Evtushinsky et al. (2009) D. V. Evtushinsky, D. S. Inosov, V. B. Zabolotnyy, A. Koitzsch, M. Knupfer, B. Büchner, M. S. Viazovska, G. L. Sun, V. Hinkov, A. V. Boris, C. T. Lin, B. Keimer, A. Varykhalov, A. A. Kordyuk, and S. V. Borisenko, Phys. Rev. B 79, 054517 (2009).
- Koitzsch et al. (2009) A. Koitzsch, D. S. Inosov, D. V. Evtushinsky, V. B. Zabolotnyy, A. A. Kordyuk, A. Kondrat, C. Hess, M. Knupfer, B. Büchner, G. L. Sun, V. Hinkov, C. T. Lin, A. Varykhalov, and S. V. Borisenko, Phys. Rev. Lett. 102, 167001 (2009).
- Zabolotnyy et al. (2009) V. B. Zabolotnyy, D. S. Inosov, D. V. Evtushinsky, A. Koitzsch, A. A. Kordyuk, G. L. Sun, J. T. Park, D. Haug, V. Hinkov, A. V. Boris, C. T. Lin, M. Knupfer, A. N. Yaresko, B. Büchner, A. Varykhalov, R. Follath, and S. V. Borisenko, Nature (London) 457, 569 (2009).
- Terashima et al. (2009) K. Terashima, Y. Sekiba, J. H. Bowen, K. Nakayama, T. Kawahara, T. Sato, P. Richard, Y.-M. Xu, L. J. Li, G. H. Cao, Z.-A. Xu, H. Ding, and T. Takahashi, PNAS 106, 7330 (2009).
- Sekiba et al. (2009) Y. Sekiba, T. Sato, K. Nakayama, K. Terashima, P. Richard, J. H. Bowen, H. Ding, Y.-M. Xu, L. J. Li, G. H. Cao, Z.-A. Xu, and T. Takahashi, New. J. Phys 11, 025020 (2009).
- Liu et al. (2010) C. Liu, T. Kondo, R. M. Fernandes, A. D. Palczewski, E. D. Mun, N. Ni, A. N. Thaler, A. Bostwick, E. Rotenberg, J. Schmalian, S. L. Bud ko, P. C. Canfield, and A. Kaminski, Nature Phys. 6, 419 (2010).
- (45) K. Nakayama, T. Sato, P. Richard, Y.-M. Xu, T. Kawahara, K. Umezawa, T. Qian, M. Neupane, G. F. C. andH. Ding, and T. Takahashi, arXiv:1009.4236 (unpublished) .
- Litvinchuk et al. (2008) A. P. Litvinchuk, V. G. Hadjiev, M. N. Iliev, B. Lv, A. M. Guloy, and C. W. Chu, Phys. Rev. B 78, 060503(R) (2008).
- Chauvière et al. (2009) L. Chauvière, Y. Gallais, M. Cazayous, A. Sacuto, M. A. Méasson, D. Colson, and A. Forget, Phys. Rev. B 80, 094504 (2009).
- Rahlenbeck et al. (2009) M. Rahlenbeck, G. L. Sun, D. L. Sun, C. T. Lin, B. Keimer, and C. Ulrich, Phys. Rev. B 80, 064509 (2009).
- Muschler et al. (2009) B. Muschler, W. Prestel, R. Hackl, T. P. Devereaux, J. G. Analytis, J.-H. Chu, and I. R. Fisher, Phys. Rev. B 80, 180510(R) (2009).
- Li et al. (2008) G. Li, W. Z. Hu, J. Dong, Z. Li, P. Zheng, G. F. Chen, J. L. Luo, and N. L. Wang, Phys. Rev. Lett. 101, 107004 (2008).
- Hu et al. (2009) W. Hu, Q. Zhang, and N. Wang, Physica C 469, 545 (2009).
- Yang et al. (2009) J. Yang, D. Hüvonen, U. Nagel, T. Rõõm, N. Ni, P. C. Canfield, S. L. Bud’ko, J. P. Carbotte, and T. Timusk, Phys. Rev. Lett. 102, 187003 (2009).
- Wu et al. (2009a) D. Wu, N. Baris̆ić, N. Drichko, S. Kaiser, A. Faridian, M. Dressel, S. Jiang, Z. Ren, L. J. Li, G. H. Cao, Z. A. Xu, H. S. Jeevan, and P. Gegenwart, Phys. Rev. B 79, 155103 (2009a).
- (54) T. Fischer, A. V. Pronin, J. Wosnitza, K. Iida, F. Kurth, S. Haindl, L. Schultz, B. Holzapfel, and E. Schachinger, arXiv:1005.0692 (unpublished) .
- van Heumen et al. (2010) E. van Heumen, Y. Huang, S. de Jong, A. B. Kuzmenko, M. S. Golden, and D. van der Marel, EPL 90, 37005 (2010).
- Kim et al. (2010) K. W. Kim, M. Rössle, A. Dubroka, V. K. Malik, T. Wolf, and C. Bernhard, Phys. Rev. B 81, 214508 (2010).
- Gorshunov et al. (2010) B. Gorshunov, D. Wu, A. A. Voronkov, P. Kallina, K. Iida, S. Haindl, F. Kurth, L. Schultz, B. Holzapfel, and M. Dressel, Phys. Rev. B 81, 060509(R) (2010).
- Nakajima et al. (2010) M. Nakajima, S. Ishida, K. Kihou, Y. Tomioka, T. Ito, Y. Yoshida, C. H. Lee, H. Kito, A. Iyo, H. Eisaki, K. M. Kojima, and S. Uchida, Phys. Rev. B 81, 104528 (2010).
- Wu et al. (2010a) D. Wu, N. Baris̆ić, P. Kallina, A. Faridian, B. Gorshunov, N. Drichko, L. J. Li, X. Lin, G. H. Cao, Z. A. Xu, N. L. Wang, and M. Dressel, Phys. Rev. B 81, 100512(R) (2010a).
- Marsik et al. (2010) P. Marsik, K. W. Kim, A. Dubroka, M. Rössle, V. K. Malik, L. Schulz, C. N. Wang, C. Niedermayer, A. J. Drew, M. Willis, T. Wolf, and C. Bernhard, Phys. Rev. Lett. 105, 057001 (2010).
- (61) A. Perucchi, L. Baldassarre, C. Marini, S. Lupi, J. Jiang, J. D. Weiss, E. E. Hellstrom, S. Lee, C. W. Bark, C. B. Eom, M. Putti, I. Pallecchi, and P. Dore, arXiv:1003.0565 (unpublished) .
- Barišić et al. (2010) N. Barišić, D. Wu, M. Dressel, L. J. Li, G. H. Cao, and Z. A. Xu, Phys. Rev. B 82, 054518 (2010).
- (63) M. Dressel, D. Wu, N. Baris̆ić, and B. Gorshunov, arXiv:1004.2962 (unpublished) .
- Lucarelli et al. (2010) A. Lucarelli, A. Dusza, F. Pfuner, P. Lerch, J. G. Analytis, J.-H. Chu, I. R. Fisher, and L. Degiorgi, New J. Phys. 12, 073036 (2010).
- (65) R. P. S. M. Lobo, Y. M. Dai, U. Nagel, T. Rõõm, J. P. Carbotte, T. Timusk, A. Forget, and D. Colson, arXiv:1007.3761 (unpublished) .
- Liu et al. (2009) R. H. Liu, T. Wu, G. Wu, H. Chen, X. F. Wang, Y. L. Xie, J. J. Ying, Y. J. Yan, Q. J. Li, B. C. Shi, W. S. Chu, Z. Y. Wu, and X. H. Chen, Nature (London) 459, 64 (2009).
- Shirage et al. (2009) P. M. Shirage, K. Kihou, K. Miyazawa, C.-H. Lee, H. Kito, H. Eisaki, T. Yanagisawa, Y. Tanaka, and A. Iyo, Phys. Rev. Lett. 103, 257003 (2009).
- Raghu et al. (2008) S. Raghu, X.-L. Qi, C.-X. Liu, D. J. Scalapino, and S.-C. Zhang, Phys. Rev. B 77, 220503(R) (2008).
- Singh and Du (2008) D. J. Singh and M.-H. Du, Phys. Rev. Lett. , 237003 (2008).
- Singh (2008) D. J. Singh, Phys. Rev. B 78, 094511 (2008).
- Mazin et al. (2008) I. I. Mazin, D. J. Singh, M. D. Johannes, and M. H. Du, Phys. Rev. Lett. 101, 057003 (2008).
- Kuroki et al. (2008) K. Kuroki, S. Onari, R. Arita, H. Usui, Y. Tanaka, H. Kontani, and H. Aoki, Phys. Rev. Lett. 101, 087004 (2008).
- Maier and Scalapino (2008) T. A. Maier and D. J. Scalapino, Phys. Rev. B 78, 020514 (2008).
- Chubukov et al. (2008) A. V. Chubukov, D. V. Efremov, and I. Eremin, Phys. Rev. B 78, 134512 (2008).
- Chubukov et al. (2009) A. V. Chubukov, M. G. Vavilov, and A. B. Vorontsov, Phys. Rev. B 80, 140515(R) (2009).
- Mishra et al. (2009) V. Mishra, G. Boyd, S. Graser, T. Maier, P. J. Hirschfeld, and D. J. Scalapino, Phys. Rev. B 79, 094512 (2009).
- Homes et al. (1993) C. C. Homes, M. Reedyk, D. A. Cradles, and T. Timusk, Appl. Opt. 32, 2976 (1993).
- Dressel and Grüner (2001) M. Dressel and G. Grüner, Electrodynamics of Solids (Cambridge University Press, Cambridge, 2001).
- Tu et al. (2002) J. J. Tu, C. C. Homes, G. D. Gu, D. N. Basov, and M. Strongin, Phys. Rev. B 66, 144514 (2002).
- Akrap et al. (2009) A. Akrap, J. J. Tu, L. J. Li, G. H. Cao, Z. A. Xu, and C. C. Homes, Phys. Rev. B 80, 180502(R) (2009).
- (81) M. Neupane, P. Richard, Y.-M. Xu, K. Nakayama, T. Sato, T. Takahashi, A. V. Fedorov, G. Xu, X. Dai, Z. Fang, Z. Wang, G.-F. Chen, N.-L. Wang, H.-H. Wen, and H. Ding, arXiv:1005.2966 (unpublished) .
- Mott (1972) N. F. Mott, Phil. Mag 26, 1015 (1972).
- Gurvitch (1981) M. Gurvitch, Phys. Rev. B 24, 7404 (1981).
- Hussey et al. (2010) N. E. Hussey, K. Takenaka, and H. Takagi, Phil. Mag. 84, 2847 (2010).
- Hancock et al. (2010) J. N. Hancock, S. I. Mirzaei, J. Gillett, S. E. Sebastian, J. Teyssier, R. Viennois, E. Giannini, and D. van der Marel, Phys. Rev. B 82, 014523 (2010).
- Ferrell and Glover, III (1958) R. A. Ferrell and R. E. Glover, III, Phys. Rev. 109, 1398 (1958).
- Tinkham and Ferrell (1959) M. Tinkham and R. A. Ferrell, Phys. Rev. Lett. 2, 331 (1959).
- Jiang et al. (1996) C. Jiang, E. Schachinger, J. P. Carbotte, D. Basov, and T. Timusk, Phys. Rev. B 54, 1264 (1996).
- Williams et al. (2009) T. J. Williams, A. A. Aczel, E. Baggio-Saitovitch, S. L. Bud’ko, P. C. Canfield, J. P. Carlo, T. Goko, J. Munevar, N. Ni, Y. J. Uemura, W. Yu, and G. M. Luke, Phys. Rev. B 80, 094501 (2009).
- Gordon et al. (2009) R. T. Gordon, N. Ni, C. Martin, M. A. Tanatar, M. D. Vannette, H. Kim, G. D. Samolyuk, J. Schmalian, S. Nandi, A. Kreyssig, A. I. Goldman, J. Q. Yan, S. L. Bud’ko, P. C. Canfield, and R. Prozorov, Phys. Rev. Lett. 102, 127004 (2009).
- Luan et al. (2010) L. Luan, O. M. Auslaender, T. M. Lippman, C. W. Hicks, B. Kalisky, J.-H. Chu, J. G. Analytis, I. R. Fisher, J. R. Kirtley, and K. A. Moler, Phys. Rev. B 81, 100501(R) (2010).
- Mattis and Bardeen (1958) D. C. Mattis and J. Bardeen, Phys. Rev. 111, 412 (1958).
- Zimmermann et al. (1991) W. Zimmermann, E. Brandt, M. Bauer, E. Seider, and L. Genzel, Physica C 183, 99 (1991).
- Massee et al. (2009) F. Massee, Y. Huang, R. Huisman, S. de Jong, J. B. Goedkoop, and M. S. Golden, Phys. Rev. B 79, 220517(R) (2009).
- Ren et al. (2008d) Y. H. Ren, M. Ebrahim, H. B. Zhao, G. Lüpke, Z. A. Xu, V. Adyam, and Q. Li, Phys. Rev. B 78, 014408 (2008d).
- Chia et al. (2007) E. E. M. Chia, J.-X. Zhu, D. Talbayev, R. D. Averitt, A. J. Taylor, K.-H. Oh, I.-S. Jo, and S.-I. Lee, Phys. Rev. Lett. 99, 147008 (2007).
- Rothwarf and Taylor (1967) A. Rothwarf and B. N. Taylor, Phys. Rev. Lett. 19, 27 (1967).
- Grüneisen (1933) E. Grüneisen, Ann. Phys. (Leipzig) 16, 530 (1933).
- Deutsch (1987) M. Deutsch, J. Phys. A 20, L811 (1987).
- Kong et al. (2001) Y. Kong, O. V. Dolgov, O. Jepsen, and O. K. Andersen, Phys. Rev. B 64, 020501 (2001).
- Mamedov and Askerov (2007) B. A. Mamedov and I. M. Askerov, Phys. Lett. A 362, 324 (2007).
- Ni et al. (2008) N. Ni, S. L. Bud’ko, A. Kreyssig, S. Nandi, G. E. Rustan, A. I. Goldman, S. Gupta, J. D. Corbett, A. Kracher, and P. C. Canfield, Phys. Rev. B 78, 014507 (2008).
- Allen and Mikkelsen (1977) J. W. Allen and J. C. Mikkelsen, Phys. Rev. B 15, 2952 (1977).
- Puchkov et al. (1996) A. Puchkov, D. N. Basov, and T. Timusk, J. Phys.: Condens. Matter 8, 10049 (1996).
- Wu et al. (2010b) D. Wu, N. Barišić, M. Dressel, G. H. Cao, Z.-A. Xu, E. Schachinger, and J. P. Carbotte, Phys. Rev. B 82, 144519 (2010b).
- Schachinger et al. (2003) E. Schachinger, J. J. Tu, and J. P. Carbotte, Phys. Rev. B 67, 214508 (2003).
- Inosov et al. (2010) D. S. Inosov, J. T. Park, P. Bourges, D. L. Sun, Y. Sidis, A. Schneidewind, K. Hradil, D. Haug, C. T. Lin, B. Keimer, and V. Hinkov, Nature Phys. 6, 178 (2010).
- Yildirim (2009) T. Yildirim, Physica C 469, 425 (2009).
- Carlo et al. (2009) J. P. Carlo, Y. J. Uemura, T. Goko, G. J. MacDougall, J. A. Rodriguez, W. Yu, G. M. Luke, P. Dai, N. Shannon, S. Miyasaka, S. Suzuki, S. Tajima, G. F. Chen, W. Z. Hu, J. L. Luo, and N. L. Wang, Phys. Rev. Lett. 102, 087001 (2009).
- Wu et al. (2009b) D. Wu, N. Baris̆ić, N. Drichko, P. Kallina, A. Faridian, B. Gorshunov, M. Dressel, L. J. Li, X. Lin, G. H. Cao, and Z. A. Xu, Physica C In Press, Corrected Proof, (2009b).
- Homes et al. (2010) C. C. Homes, A. Akrap, J. S. Wen, Z. J. Xu, Z. W. Lin, Q. Li, and G. D. Gu, Phys. Rev. B 81, 180508(R) (2010).
- Homes et al. (2004) C. C. Homes, S. V. Dordevic, M. Strongin, D. A. Bonn, R. Liang, W. N. Hardy, S. Komiya, Y. Ando, G. Yu, N. Kaneko, X. Zhao, M. Greven, D. N. Basov, and T. Timusk, Nature (London) 430, 539 (2004).
- Homes et al. (2005) C. C. Homes, S. V. Dordevic, T. Valla, and M. Strongin, Phys. Rev. B 72, 134517 (2005).