The mass-dependant star formation histories of disk galaxies: infall model versus observations
Abstract
We introduce a simple model to explore the star formation histories of disk galaxies. We assume that the disk origins and grows by continuous gas infall. The gas infall rate is parametrized by the Gaussian formula with one free parameter: infall-peak time . The Kennicutt star formation law is adopted to describe how much cold gas turns into stars. The gas outflow process is also considered in our model. We find that, at given galactic stellar mass , model adopting late infall-peak time results in blue colors, low metallicity, high specific star formation rate and high gas fraction, while gas outflow rate mainly influences the gas-phase metallicity and star formation efficiency mainly influences the gas fraction. Motivated by the local observed scaling relations, we construct a mass-dependent model by assuming low mass galaxy has later infall-peak time and larger gas outflow rate than massive systems. It is shown that this model can be in agreement with not only the local observations, but also the observed correlations between specific star formation rate and galactic stellar mass at intermediate redshift . Comparison between the Gaussian-infall model and exponential-infall model is also presented. It shows that the exponential-infall model predicts higher star formation rate at early stage and lower star formation rate later than that of Gaussian-infall. Our results suggest that the Gaussian infall rate may be more reasonable to describe the gas cooling process than the exponential infall rate, especially for low-mass systems.
1 Introduction
More than thirty years ago, Visvanathan & Griersmith (1977) found that early-type spiral galaxies (S0/a to Sab) exhibit optical color-magnitude relation (CMR), that is, luminous spirals show redder colors than less-luminous systems.
Later, many studies confirmed this phenomena and extended the CMRs of spirals from optical to infrared bands (Tully et al. 1982; de Jong 1996; Mobasher et al. 1986; Tully et al. 1998; Peletier & de Grijs 1998; Bell & de Jong 2000; Blanton et al. 2003; Baldry et al. 2004; Macarthur et al. 2004). Chang et al. (2006a) collected a sample of late-type galaxies from Sloan Digital Sky Survey (SDSS) and Two-Micron All-Sky Survey (2MASS) and found that, after correcting the effect of dust attenuation, the optical-infrared (optical-IR) colors present tighter correlations with the absolute magnitude than optical colors. Based on a matched sample of Galaxy Evolution Explorer (GALEX) and SDSS, Wyder et al. (2007) and Schiminovich et al (2007) explored the ultraviolet-optical (UV-optical) CMRs for both disk and bulge-dominated galaxies. They also found that disk-dominated galaxies show a tight correlation between specific star formation rate () and galactic stellar mass (), which is denoted as the mass-SFR relation for convenience.
On the other hand, interpretation of these observed CMRs of disk galaxies is still an open question. van den Bosch (2002) and Bell et al. (2003) found that, contrary to the observed trends, their semi-analytic models (SAMs) predicted that faint spirals should be slightly redder than bright spirals. By introducing additional mechanics like active galactic nucleus (AGN) feedback, the more recent SAMs can predict positive slopes of the CMRs of spirals, i.e., lower mass systems being bluer than massive systems (e.g. Kang et al. 2005, Croton et al. 2006). However, the slopes of the predicted CMRs are still shallower than that of the observations (Kang et al. 2005). This is mainly due to the fact that it is difficult for the SAMs to build a scenario that permits low mass spiral to be averagely younger than high mass system in the hierarchical cosmogonies.
Parametrized modelling, which adopts phenomenological descriptions for some complicated processes, is another fruitful tool to explore the galactic formation and evolution (Tinsley 1980). In fact, parametric models have been successfully applied to investigate the formation and evolution of the Milky Way disk (Chang et al. 1999; Chiappini et al. 2001; Renda et al. 2005; Naab & Ostriker 2006; Fu et al. 2009; Matteucci et al., 2009) and other nearby disk galaxies (Prantzos& Boissier 2000; Molla & Diaz 2005; Dalcanton 2007; Yin et al. 2009). Besides these specific galaxies, Boissier & Prantzos (2000, hereafter BP00) extended their calibrated model on the Milky Way disk to study the chemical and spectro-photometric evolution of disk galaxies and compared their model predictions with the observed CMRs of de Jong (1996). They found satisfactory agreement with local observations provided that the star formation time-scales of low-mass galaxies are longer than their high-mass counterparts. However, their model predictions have not been compared with observations at higher redshift due to the limited observations at that time.
Recently, several new scaling relations of disk galaxies are statistically found and huge amount of observed data are available, not only in the local universe but also for intermediate and high redshift galaxies. Motivated by the work of BP00, we try to construct a new parametric model to explain the observed correlations in both local and intermediate redshift universe. Our results show that the mass-SFR relations at intermediate redshifts provide tight constraints on the modelling of gas cooling history. Our results suggest that the Gaussian infall rate may be more reasonable to describe the gas cooling process than the exponential infall rate, especially for low-mass systems.
The outline of this paper is as follows. In Section 2, we describe main assumptions and ingredients of our model in details. Comparisons between model predictions and observations and our main results are given in Section 3. Discussions are presented in Section 4 and the last section summarizes our main conclusions.
2 The model
We assume that the disk galaxy has been embedded in a dark matter halo and primordial gas within the dark halo cools down to form a rotationally supported disk. The disk is basically assumed to be sheet-like and composed by a set of independent rings, each 500pc wide, that is, there is no gas radial flow between different rings. The details and essentials of our model are outlined in below sections.
2.1 Present-day disk galaxy
In the local Universe, galactic stellar mass is the primary parameter that determines main properties of the galaxy (Kauffmann et al. 2003a, 2003b), including the colors of disk galaxy (Chang et al. 2006a). In this paper, we assume is the primary parameter and all free parameters in our model are dependent on , where is referred to the stellar mass of a galaxy at present time (i.e., z=0) if there is no specific notations.
For a present-day galaxy with galactic stellar mass , we assume the stellar mass surface density in the current time follows an exponential profile:
| (1) |
where is the cosmic age at the present time, which is 13.5 Gyr for the cosmogony adopted here (see following subsection). is the central stellar mass surface density in the present-day and is the disc radial scale-length. Since a pure exponential disk has:
| (2) |
can be obtained if and the relation are given.
Shen et al. (2003) collected a large sample of SDSS galaxies and obtained the mean relations for both early-type and late-type galaxies in the local universe, where is the aperture that contains of Petrosian flux (Stoughton et al. 2002). We adopt their observed relation of late-type galaxies in z-band (equation 18 and table 1 of Shen et al. 2003) to determine by adopting for a pure exponential disk, since z-band is a good indicator of the stellar mass.
2.2 Gas infall rate
Gas cooling is one of the key processes in modeling galactic formation and evolution. Semi-analytical models, which have made large successes in explaining a lot of observations (Kauffmann et al. 1993; Somerville & Primack 1999; Cole et al. 2000; Kang et al. 2005; Croton et al. 2006; Fontanot et al. 2009), have presented a method to describe gas cooling process. However, there are still some open questions, for example, how to describe the mass and angular momentum distributions of baryons in dark matter halo and their variations with time, and whether the specific angular momentum conserves or not during gas cooling processes etc. (Efstathiou 2000; Bullock et al. 2002; Chen et al. 2003). None of these questions has an answer clear enough to construct a simple model, at least at the present stage of our knowledge.
In this paper, we turn to another approach, i.e., the phenomenological approach, which adopts a parametric description for some complicated processes. Comparisons between model predictions and observations may suggest possible ranges for model free parameters in the model and then help to know more information about main properties of the processes described by these parameters. We assume that there is 1 Gyr time delay for the disk galaxy formation, which corresponds to under the adopted cosmology in this paper. After that, the disk origins and grows by continuous gas infall from the dark halo and the metallicity of the infalling gas is primordial. Differing from BP00, who adopted an exponential infall rate, we follow Prantzos & Silk (1998) and Chang et al. (1999) and adopt a Gaussian formula of gas infall rate. Comparison between exponential-infall model and Gaussian-infall model will be presented in Section 4.
The Gaussian infall rate (in units of ) is assumed to be:
| (3) |
where is the characteristic time corresponding to the maximum gas infall rate (hereafter, we call as the infall-peak time) and is the full width at half maximum of the peak. We adopt throughout this paper to promise a relatively wide distribution of the infall rate. In fact, our calculations show that the varying of in the range Gyr do not have large influence on the results. The are a set of separate quantities determined by the boundary condition . In practice, we iteratively obtain by normalizing the resulted stellar mass surface density distribution at to be very close to its observed value .
We should emphasize that the infall-peak time is the most important free parameter in our model that determines main properties of gas infall history. Indeed, regulates the shape of gas accretion history. For example, corresponds to a time-declining infall rate, while corresponds to a time-increasing gas infall rate. Since we only focus on the global quantities of galaxy in this paper, we assume does not vary with radius but may be dependent on the galactic stellar mass .
In this paper, we assume a cosmology with and . Correspondingly, the cosmic time at z =0 is Gyr and the cosmic time at z =3 (0.4) is t = 2Gyr (9Gyr).
2.3 Star formation law and stellar evolution
Star formation (SF) process is so complicated that it is very difficult to fully understand the physical nature of star formation regulation (Silk 1997, Kennicutt 1998a,b, Elmegreen 2002). Fortunately, observations of galaxies on global scales reveal a tight correlation between the average star formation rate per unit area and the mean surface density of cold gas (e.g. Kennicutt 1998a,b). This observed relation is later called as Kennicutt SF law. Recently, Kennicutt et al. (2007) found that, on spatial scales extending down to at least 500 pc, the star formation rate (SFR) surface density also correlates with the local gas surface density, following a similar power law as that of the global quantities.
We adopt the Kennicutt SF law in this paper:
| (4) |
where the SFR surface density is measured in units of and the cold gas surface density is in units of .
Regarding the chemical evolution of the galactic disk, both instantaneous-recycling approximation (IRA) and instantaneous mixing of the gas with stellar ejecta is assumed, i.e., the gas in a fixed ring is characterized by a unique composition at each epoch of time. We take the classical set of equations of galactic chemical evolution from Tinsley (1980) and adopt the return fraction and stellar yield .
The updated stellar population synthesis (SPS) model of Bruzual & Charlot (2003), i.e., CB07, is adopted in the present paper, with the stellar IMF being taken from Chabrier (2003). The lower and upper mass limits are adopted to be and , respectively.
2.4 Gas outflow rate
Gas outflow process may also influence the evolution of galactic disk. During the continuous star formation and evolution process, supernova (SN) explosions eject part of energy into interstellar medium and some amount of gas will be heated and expelled from the galactic disk if its kinematic energy exceeds the bonding energy. Therefore, gas outflow rate may be proportional to the SN explosion rate and then proportional to SFR surface density if the initial mass function (IMF) does not vary with time. Furthermore, gas outflow rate may also correlate with galactic mass since low mass galaxies have shallower potential wells and then it is much easier for them to expel gas out than high mass systems (Kauffmann et al. 1993).
In this paper, we assume the outflowing gas has the same metallicity as that of the interstellar medium at that time and will not fall again to the disk. The gas outflow rate (in units of ) is assumed to be proportional to the SFR surface density :
| (5) |
where is another free parameter in our model and may also be a function of galactic stellar mass . Integrating the left side of the above equation, we derive , where is the total mass expelled from the galaxy. Integrating the right side of Eq. 5 gets , where is the return fraction. Then, we derive . Therefore, is proportional to the fraction of total mass expelled relative to the final mass locked in stars.
In summary, our primary input parameter is the galactic stellar mass . Free parameters are infall-peak time and outflow parameter . The combination of gas infall rate and outflow rate determines the variation rate of the total (gas+star) mass surface density. Assuming the initial total surface density to be zero, we can numerically obtain the total mass surface density at any time after free parameters being given. Adding the SF law, we can describe how many cold gas turns into stellar mass and then calculate the chemical and color evolution of the disk. For simplicity, we assume that there is no scatter of the model parameters and at any given . In other words, our simple model only investigates the average trend of the correlations between different quantities and does not include their scatters.
3 Model results versus observations
Using the above model, for one galaxy at given , we independently calculate the evolution of cold gas in each ring along the galactic disk. At each time step, we derive a set of individual quantities, such as the SFR surface density, gas mass surface density, multi-band luminosity and metallicity, and then integrate them to obtain the global quantities for the whole galaxy. After that, our model predictions can be directly compared with observations.
In this section, we present our main results step by step. Firstly, we briefly describe the adopted observations to be compared with model predictions. Then, we investigate the influence of free parameters on model predictions, including not only and , but also the constance in the SF law. Finally, we construct a reasonable mass-dependent model and explore if its predictions can be consistent with the observed data.
3.1 Observations
Here, we show and summarize the observed mass-color relations, the mass-metallicity relation, mass-SFR relation and the mass-gas fraction relation for local galaxies, which are mainly taken from papers based on SDSS database. We also include the observed mass-SFR relations at redshift .
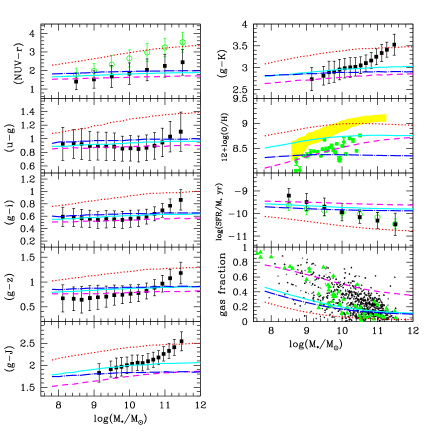
Mass-color relations: Based on the matched sample of SDSS and GALEX, Salim et al. (2007) and Schiminovich et al. (2007) obtained the UV-optical color magnitude diagrams of star forming galaxies in the local universe and investigated their physical properties as a function of specific star formation rate () and stellar mass (). We take the observed relations of disk-dominated galaxies from Table 2 of Schiminovich et al. (2007) and plot them in the left-upper panel of Fig. 1, where the open circles are the data without dust-correction and the squares denote those after dust corrections. The error-bars denote the dispersions of the data distributions.
Chang et al. (2006a) collected a large sample of late-type galaxies from SDSS (DR4) and 2MASS to explore their CMRs in both optical and optical-IR bands. The photometric aperture mismatch between SDSS and 2MASS is taken into account by correcting the SDSS magnitudes to the isophotal circular radius, where the 2MASS magnitudes are measured, based on the radial profile of surface brightness of SDSS galaxies. We take the observed multi-band (optical and optical-IR) color- relations from Chang et al.(2006a) and plot them in Fig. 1, where the square denotes the mean value of color after dust-corrections and the error-bar represents the distribution dispersion in each bin. Since the SPS models seem to be not accurately reproducing the shape of the spectrum between 4000 and 5000 , which causes an offset in g-r and r-i as the r filter passes through this (rest-frame) wavelength region (Wake et al. 2006), we ignore the r filter data and replace them with g filter data in this paper.
Mass-metallicity relation: The mass-metallicity relation is another tight constraint on models of galactic formation and evolution. Based on the SDSS imaging and spectroscopy data, Tremonti et al. (2004) derived gas-phase oxygen abundances and stellar masses of a large sample of star-forming galaxies and found a tight correlation between stellar mass and metallicty, spanning over 3 orders in stellar mass and a factor of 10 in metallicity. Liang et al. (2007) adopted another method to measure the gas-phase metalllcity of a similar sample of star-forming galaxies from SDSS (DR4). Within 27 stellar mass bins from to , they stacked the spectra of several hundreds (even thousands) galaxies in each bin and derived their electron temperature and hence obtained the -based oxygen abundance. In this paper, we adopt these two sets of observed relations between gas phase metallicity and stellar mass . The results are plotted in the right-second panel of Fig. 1, where the data taken from Tremonti et al. (2004) are shown by yellow shaded area and that taken from Liang et al. (2007) are denoted by green filled circles with error bars.
Mass-SFR relation: The specific star formation rate is an important quantity describing the star formation history. If the initial mass function does not vary with time, stellar mass should be roughly proportional to mean star formation rate during the whole history , thus, . Therefore, a galaxy having higher means larger fraction of its stars formed in later time. The observed relations of star-forming galaxies in the local universe are taken from Schiminovich et al. (2007) and plotted in right-third panel of Fig. 1, where the SFRs taken from Brinchmann et al. (2004) and from Salim et al. (2007) are denoted as the open circles and squares, respectively.
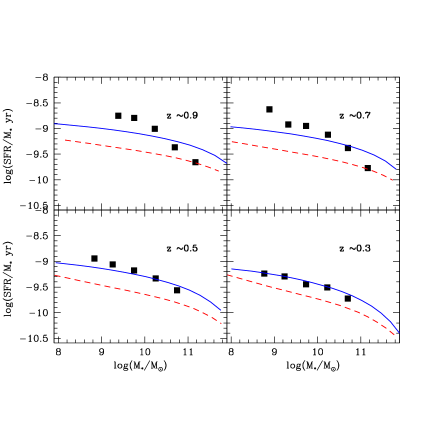
Besides the local data, the observed mass-SFR relations at different redshift are also available. Zheng et al. (2007) measured the SFR from UV and IR luminosities for a sample of 15,000 galaxies selected from two COMBO-17 fields. Combining with the stellar mass of these galaxies derived by Borch et al. (2006), Zheng et al. (2007) derived the observed mass-SFR relations at four redshift bins . We adopt their data and plot them as filled squares in Fig. 2.
Mass-gas fraction relation: The observed gas fraction is also important constraint on the model. Zhang et al. (2009) collected a sample of 721 galaxies from cross-matching the SDSS (DR4) galaxies, the 2MASS XSC and the HyperLeda HI catalogue (Paturel et al. 2003) and obtained their observed gas fraction. The observed data of gas fraction are taken from sample 1 of Zhang et al. (2009) and plotted as small dots in the right-fourth panel of Fig. 1. In the same panel, the filled triangles represent the observed data of gas fraction and stellar mass for a sample of 60 local galaxies, which are taken from Table 1 of McGaugh (2005).
3.2 Influence of free parameters
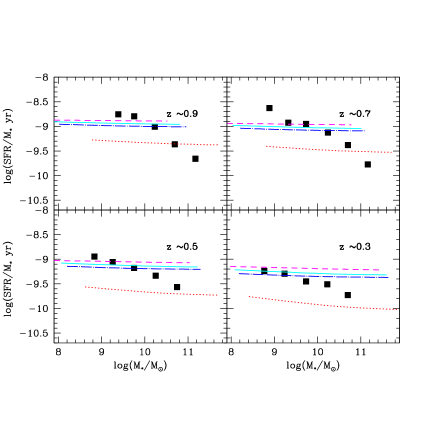
In this section, we show model predicted scaling relations with different settings of free parameters and compare them with the observations. Fig. 1 compares model predictions with local observations. Fig. 2 plots the observed and model predicted mass-SFR relation at respectively. The observed data in Fig. 1 and 2 are described in details in subsection 3.1. We emphasize that, for both observations and model predictions, in Fig.2 refers to the galactic stellar mass at given redshift (or evolutionary time step).
We start from a prior model adopting Gyr and , which corresponds to a late infall-peak time and no gas outflow is considered. The results of our prior model are plotted as solid lines in Fig.1 and 2. It should be pointed out that the construction of this prior model is arbitrary and far from a reasonable description of the formation of any galactic disk. This setting only aims to provide a benchmark to be compared with other model predictions and then investigate the influences of different settings of free parameters on model results.
Firstly, we fix and change from 10Gyr to 5Gyr, i.e. replacing the prior model with a shorter infall-peak time. The model predictions are shown as the dot lines in Fig. 1 and 2. It can be seen that the model adopting later predicts bluer color, lower metallicity, higher gas fraction and higher specific star formation rate both in the local Universe and at intermediate redshift, at least up to . This is mainly due to the fact that, in our model, the setting of later infall-peak time corresponds to slower gas infall process and thus slower star formation processes. Furthermore, Fig. 1 and 2 show that the separations between the solid and dash lines almost cover the observed range of different data sets, especially the at intermediate redshifts. In other words, the infall-peak time significantly influence the galactic evolution.
The impact of outflow (described by ) on the model predictions is presented by the dot-dash lines in Fig. 1 and 2, where we adopt and Gyr. Comparison between solid lines and dot-dash lines shows that the gas outflow process mainly influences the final gas-phase metallicity, since it takes a fraction of metal away from the disk. Moreover, after including gas outflow process, the model predicts bluer optical-IR (both and ) color, while the impact on the optical color is very small, if there is any. This is mainly due to the fact that the stellar mean age influences the optical color more strongly than the optical-IR color, while the mean stellar metallicity influences the optical-IR color more strongly than the optical color (Chang et al. 2006b).
The star formation law is another important ingredient in our model. In this paper, we adopt a Kennicutt star formation law. Although it works well in the region of high surface density, we should be caution to apply it to low density region, such as the outskirts of disk galaxies. To explore the influence of the adopted star formation law on our model predictions, we adopt a modified star formation law to reduce the star formation efficiency (SFE) and plot the model predictions as dash lines in Fig. 1 and 2. The free parameter combination is adopted to be ) = (10Gyr,0). It shows that the low SFE results in bluer color, lower metallicity and higher . The most outstanding point appears in the mass-gas fraction relation. The model adotping the low SFE predicts much higher gas fraction than that of standard SFE. In other words, the predicted gas fraction is very sensitive to the adopted SFE. However, except the panel of gas fraction, the separations between the solid and dash lines are very small compared to the observed range of different data sets, i.e., the variation of SFE may not dramatically change our model predictions. Considering the fact that there still lacks an alternative choice more reasonable than the Kennicutt star formation law, we choose to adopt the Kennicutt star formation law throughout this paper if there is no specific statement.
3.3 A mass-dependent model
Model calculations in above section show that galaxies form by later infall-peak time will result in bluer color and higher specific star formation rate, while gas outflow process will decrease the gas metallicity in the present day. The local observations show that less massive disk galaxies have bluer color, lower metallicity when compared with their high mass counterparts (see Fig. 1). Therefore, it is naturally to assume that low mass disk galaxies may have later infall-peak time and larger outflow parameter than massive systems.
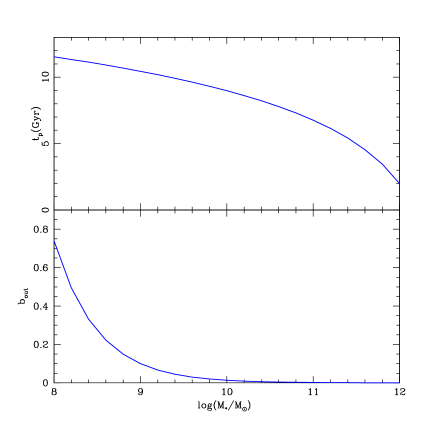
Motivated by the above discussions, we try to construct a model in which the infall-peak time and outflow parameter are only dependent on galactic stellar mass . The adopted and are plotted in Fig. 3. The adoption considers the facts below. Since massive spirals have very old stellar population and their potential wells are so deep that there is almost no outflow occurs, we set one boundary condition at high-mass end to be and . Regarding the facts that low mass spirals are observed to have blue colors and their potential well is shallow and then should have large outflow rate, another boundary condition of and is chosen at the low-mass end .
Moreover, the general trends of and are consistent with previous studies of disk galaxies in the local group. For example, the Milky Way disk have stellar mass about (Yin et al. 2009). Our mass-dependent model adopts the corresponding infall-peak time about 7.8 Gyr, which is roughly in agreement with our previous chemical evolution models (see Chang et al. 1999 and Yin et al. 2009 for details). For M33, chemical evolution models show that this low mass disk galaxy should form by slow accretion process (Wang et al. 2009; Magrini et al. 2007), which equals to a late infall-peak time in our model .
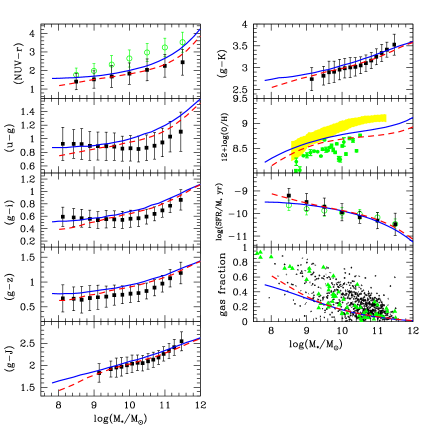
The mass-dependent model predictions are plotted as solid lines in Fig. 4 and 5. As expected, under the assumption that and all decrease with the increase of , our model do predict mean trends of most of observations both in local Universe and at different redshift, at least to . It should be emphasized that, although the accurate values of free parameters in our model are not unique for any individual galaxy, the main trend that both and decrease with the increase of are robust.
4 Discussions: exponential-infall model
In above section, we adopt the Gaussian infall rate. However, the exponential infall rate is much more widely assumed in previous models. In this section, firstly, we will compare our mass-dependent model assuming the Gaussian infall rate with that adopting the exponential infall rate. We hope the observed data may provide constrains on the form of gas infall rate and then help us to know more about the gas cooling process in disk galaxies. Secondly, we will discuss the difference of our model with that of BP00.
In order to investigate the possible influence of the infall form on the galactic evolution, we fix other ingredients of the mass-dependent model but replace the Gaussian infall rate by an exponential one:
| (6) |
where is the gas infall rate in units of , is the infall time-scale. The , which is similar as in Eq. 3, is a set of normalization quantities constrained by the boundary condition .
Accordingly, we also assume that infall time-scale is only dependent on the stellar mass. To be consistent with the observed data, we adopt the form of as:
| (7) |
which gives that the infall time-scale of massive galaxy () is positive and decreases with the increase of , while the infall time-scale of low-mass galaxy () is negative and increases with the decrease of . It should be pointed out that, although is discontinue at , the gas infall history described by the adopted varies smoothly from increasing with time to being constant and then to decreasing with time as galaxy changes from low-mass to intermediate and then to high-mass systems.
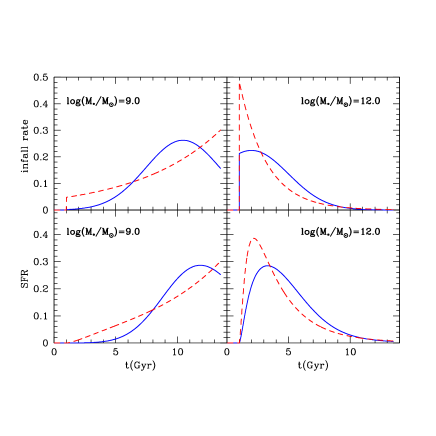
To visually compare the Gaussian and exponential infall rate, Fig. 6 plots the gas infall history and total star formation history of two galaxies and , which are normalized by (left two panels) and (right two panels), respectively. The solid and dash lines represent the model results adopting Gaussian and exponential infall rate. According to the assumption that there is 1Gyr delay for the halo formation, all of the gas infall throughout this paper begin at . It shows that, comparing with the star formation rate predicted by Gaussian-infall model, the exponential-infall model predicts higher SFR at early stage and lower SFR later. This point directly results in the differences of the mass-SFR relations at intermediate redshifts predicted by these two models (see following discussions).
In order to compare with the observations, we plot the predictions of the exponential-infall model as dash lines in Fig. 4 and 5. It can be seen that, although both the solid and dash lines can be roughly consistent with the local observations, the exponential-infall model does predict lower than observations at intermediate redshifts. Since the stellar population of local galaxy is resulted along its whole star formation history, local observations do not have the ability to distinguish whether the model is viable at different time steps. Fortunately, the observed data at intermediate redshifts are now available and can provide tighter constraints on the model of galactic evolution. In other words, our results suggest that the Gaussian infall rate may be more reasonable to describe the gas cooling process than the exponential infall rate.
In fact, by fitting synthetic energy distribution to the multi-band photometry of a sample of actively star-forming galaxies at , Maraston et al. (2010) concluded that adopting an exponentially increasing SFRs and a high starting redshift appear to provide more reasonable results than that of an exponentially declining SFR in the case of star forming galaxies at redshift beyond . Unfortunately, both their model and ours are phenomenological models. It is still beyond the scope of this paper to answer why the efficiency of gas cooling process or/and star formation process may be depressed at early stage and why the infall-peak time of low-mass galaxy is later than high-mass systems.
Indeed, the semi-analytical models and studies using hydrodynamical simulations may provide more physical and reasonable explanation on how gas accreted onto the galaxies than phenomenological models. However, there is still a long way to go to fully understand the gas cooling processes. For example, the semi-analytical models assumes that gas within galaxy halos initially reaches the temperature of the virial halo, while some studies using high-resolution cosmological hydrodynamical simulations found that the majority of baryons may never reach the virial temperature as they accreted onto galaxies (Keres et al. 2005; Dekel Birboim 2006). Brooks et al. (2009) found that low-mass galaxies are instead dominated by accretion of gas that stays well below the viral temperature and even for galaxies at higher masses, cold flows dominate the growth of the disk at early times. All these findings called the general virial temperature assumption into question, but may give more information to improve the semi-analytical models and help us to understand more clearly on how the gas gets into the galaxies.
Finally, comparing our model to that of BP00, the main difference is that BP00 adopted the exponential infall rate while we adopt the Gaussian infall rate. BP00 also notice the fact that, if the exponential declining infall rate is assumed, the predicted stellar population will be too old to reproduce the observed blue colors of low-mass galaxies even if the infall time-scale tends to be as large as . They assumed a negative infall time-scale for the most extended and less massive galaxies in their model, i.e. the infall rate increases with time. However, according to our discussions above, we guess that the model of BP00 may predict lower at intermediate redshift than the observed data although their model predictions can be in good agreement with the local observations.
5 Summary
In this paper, we present a phenomenological model for the formation and evolution of disk galaxies. It is assumed that the disk origins and grows by gas infall. We adopt the Gaussian form of gas infall rate with one free parameter, infall-peak time . We also include the contribution of gas outflow induced by supernova feedback. The Kennicutt star formation law is adopted to describe how much cold gas turns into stellar mass. We calculate the evolution of disk galaxies and compare model predictions with observations. We find that:
-
1.
Model predictions are very sensitive to the infall-peak time in that the model adopting later results in blue colors, low metallicity, high specific star formation rate and high gas fraction, while gas outflow rate mainly influences the gas-phase metallicity and star formation efficiency mainly influences the gas fraction.
-
2.
We construct a mass-dependent model by assuming that low mass galaxy has later and larger than massive systems. It is shown that our mode predictions are in fairly agree with not only the local observations, but also the observed mass-SFR relations at intermediate redshifts.
-
3.
It shows that, comparing with the star formation rate predicted by the Gaussian-infall model, the exponential-infall model predicts higher star formation rate at early stage and lower star formation rate later. Our results suggest that the Gaussian infall rate may be more reasonable to describe the gas cooling process than the exponential infall rate, especially for low-mass systems.
We emphasize that, here we present a phenomenological model. Through comparison between model predictions and observations, our main aim is to investigate main properties of the formation and evolution of disk galaxy, especially the trend as a function of galactic stellar mass. Unfortunately, there is still a long way to go to fully understand why low-mass galaxy may have later infall-peak time than high-mass systems and why the Gaussian infall rate may be more prefered than the exponential infall rate.
References
- Baldry et al. (2004) Baldry, I.K., Glazebrook, K., Brinkmann, J., et al., 2004, ApJ 600, 681
- Bell et al. (2003) Bell, E.F., Baugh, C.M., Cole, S., et al., 2003, MNRAS 343, 367
- Bell et al. (2000) Bell, E.F., & de Jong R.S., 2000, MNRAS 312, 497
- Blanton et al. (2003) Blanton, M.R., Hogg, D.W., Bahcall, N.A., et al., 2003, ApJ 594, 186
- Boissier & Prantzos (2000) Boissier, S., & Prantzos, N., 2000, MNRAS, 312, 398
- Borch et al. (2006) Borch, A., Meisenheimer, K., Bell, E. F., et al., 2006, A&A, 453, 869
- Brinchmann et al. (2004) Brinchmann, J., Charlot, S., White, S.D.M., et al., 2004, MNRAS, 351, 1151
- Brooks et al. (2009) Brooks, A.M., Governato, F., Quinn T., Brook, C.B., Wadsley J., 2009, ApJ, 694, 396
- Bruzual & Charlot (2003) Bruzual, G., & Charlot,, S., 2003, MNRAS, 344, 1000
- Bullock et al. (2002) Bullock, J.S., Kravtsov, A.V., & Colin, P., 2002, ApJ, 564, L1
- Chabrier (2003) Chabrier, G., 2003, ApJ, 586, L133
- Chang et al. (1999) Chang, R.X., Hou, J.L., Shu, C.G., & Fu, C.Q., 1999, A&A, 350, 38
- Chang et al. (2006a) Chang, R.X., Shen, S.Y., Hou, J.L., Shu, C.G., & Shao, Z.Y., 2006a, MNRAS, 372, 199
- Chang et al. (2006b) Chang, R.X., Gallazzi, A., Kauffmann, G., et al., 2006b, MNRAS, 366, 717
- Chen et al. (2003) Chen, D.N., Jing, Y.P., & Yoshikaw, K., 2003, ApJ, 597, 35
- Chiappini et al. (2001) Chiappini, C., Matteucci, F., & Romano, D., 2001, ApJ, 554, 1044
- Cole et al. (2000) Cole, S., Lacey, C.G., Baugh, C.M., & Frenk, C.S., 2000, MNRAS, 319, 168
- Croton et al. (2006) Croton, D.J., Springel, V., White, S.D.M., De Lucia, G., Frenk, C.S., Gao, L., et al., 2006, MNRAS, 365, 11
- Dalcanton (2007) Dalcanton, J.L., 2007, ApJ, 658, 941
- de Jong (1996) de Jong, R., 1996, A&AS, 118, 557
- Dekel & Birnboim (2006) Dekel, A., & Birnboim Y., 2006, MNRAS, 368, 2
- Fontanot et al. (2009) Fontanot, F., De Lucia, G., Monaco, P., et al., 2009, MNRAS, 397, 1776
- Fu et al. (2009) Fu, J., Hou, J.L., Yin, J., & Chang, R.X., 2009, ApJ, 696, 668
- Efstathious (2000) Efstathious, G., 2000, MNRAS, 317, 697
- Elmegreen (2002) Elmegreen, B.G., 2002, ApJ, 577, 206
- Kang et al. (2005) Kang, X., Jing, Y.P., Mo, H.J., & Borner, G., 2005, ApJ, 631, 21
- Kauffmann et al. (2003a) Kauffmann, G., Heckmann, T.M., White, S.D.M., et al. 2003a, MNRAS, 341, 33
- Kauffmann et al. (2003b) Kauffmann, G., Heckmann, T.M., White, S.D.M., et al. 2003b, MNRAS, 341, 54
- Kauffmann et al. (1993) Kauffmann, G., White, S.D.M., & Guiderdoni, B., 1993, MNRAS, 264, 201
- Kennicutt (1998a) Kennicutt, R.C., 1998a, ApJ, 344, 685
- Kennicutt (1998b) Kennicutt, R.C., 1998b, ARA&A, 36, 189
- Kennicutt et al. (2007) Kennicutt, R.C., Calzetti, D., Walter, F., Helou, G., Hollenbach, D.J., Armus, L., et al., 2007, ApJ, 671, 333
- Keres et al. (2005) Keres, D., Katz, N., Weinberg, D.H., Dave R., 2005, MNRAS, 363, 2
- Liang et al. (2007) Liang, Y.C., Hammer, F., Yin, S.Y., Flores, H., Rodrigues, M., & Yang, Y.B., 2007, A&A, 473, 411
- Macathur et al. (2004) Macarthur, L.A., Courteau, S., Bell, E., & Holtzman, J.A., 2004, ApJS, 152, 175
- Magrini et al. (2007) Magrini, E., Corbelli, E., & Galli, D., 2007, A&A, 470, 843
- Maraston et al. (2010) Maraston, C., Pforr, J., Renzini, A., Daddi, E., Dickinson, M., Cimatti, A., Tonini, C., astro-ph/1004.4546
- Matteucci et al. (2009) Matteucci, F., Spitoni, E., Recchi, S., & Valiante, R., 2009, A&A, 501, 531
- mcGaugh (2005) McGaugh, S. S., 2005, ApJ, 632, 859
- Mobasher et al. (1986) Mobasher, B., Ellis, R.S., & Sharples, R.M., 1986, MNRAS 223, 11
- Mplla & Diaz (2005) Molla, M., & Diaz, A.I., 2005, MNRAS, 358, 521
- Naab & Ostriker (2006) Naab, T., & Ostriker, J.P., 2006, MNRAS, 366, 899
- Paturel et al. (2003) Paturel, G., Theureau, G., Bottinelli, L., et al., 2003, A&A, 412, 57
- Peletier & de Grijs (1998) Peletier, R.F. & de Grijs, R., 1998, MNRAS, 300, L3
- Prantzos & Boissier (2000) Prantzos, N., & Boissier, S., 2000, MNRAS, 313, 338
- Prantzos & Silk (1998) Prantzos, N., & Silk, J., 1998, ApJ, 507, 229
- Renda et al. (2005) Renda, A., Kawata, D., Fenner, Y., & Gibson, B.K., 2005, MNRAS, 356, 1071
- Salim et al. (2007) Salim, S., Rich, R.M., Charlot, S., et al., 2007, ApJS, 173, 267
- Schiminovich et al. (2007) Schiminovich, D., Wyder, T.K., Martin, D.C., et al., 2007, ApJS, 173, 315
- Shen et al. (2003) Shen, S.Y., Mo, H.J., White, S.D.M., Blanton, M.R., Kauffmann, G., Voges, W.,et al, 2003, MNRAS, 343, 978
- Silk (1997) Silk, J., 1997, ApJ, 481, 703
- Somerville & Primack (1999) Somerville, R., & Primack, J.R., 1999, MNRAS, 310, 1087
- Stoughton et al. (2002) Stoughton, C., Lupton, R.H., Bernardi, M., et al., 2002, AJ, 123, 485
- Tremonti et al. (2004) Tremonti, C.A., Heckman, T.M., Kauffmann, G., et al., 2004, ApJ, 613, 898
- Tinsley (1980) Tinsley, B.M., 1980, FCPh, 5, 287
- Tully et al. (1982) Tully, R.B., Mould, J.R., & Aaronson, M., 1982, ApJ 257, 527
- Tully et al. (1998) Tully, R.B., Pierce, M.J., Huang, J., Saunders, W., Verheijen, A.W., & Witchalls, P.L., 1998, ApJ, 115, 2264
- van den Bosch (2002) van den Bosch, F.C., 2002, MNRAS 332, 456
- Visvanathan & Griersmith (1977) Visvanathan, N. & Griersmith, D., 1977, A&A 59, 317
- Wake et al. (2006) Wake, D.A., Nichol, R.C., Eisenstein, D.J., et al., 2006, MNRAS, 372, 537
- Wang et al. (2009) Wang, X.Y., Yin, J., Hou, J.L., Chang, R.X., 2009, Progress in Astronomy, 27(3), 203
- Wyder et al. (2007) Wyder, T.K., Martin, D.C., Schiminovich, D., et al., 2007, ApJS, 173, 293
- Zhang et al. (2009) Zhang, W., Li, C., Kauffmann, G., et al., 2009, MNRAS, 397, 1243
- Yin et al. (2009) Yin, J., Hou, J. L., Prantzos, N., Boissier, S., Chang, R. X., Shen, S. Y., & Zhangh, B., 2009, A&A, 505, 497
- Zheng et al. (2007) Zheng, X.Z., Bell, E.F., Papovich, C., Wolf, C., Meisenheimer, K., Rix, H.W., Rieke, G.H., & Somerville, R., 2007, ApJ, 661, L41