The High Temperature Phase Transitions of Hexagonal YMnO3
Abstract
We report a detailed high-resolution powder neutron diffraction investigation of the structural behaviour of the multiferroic hexagonal polymorph of YMnO3 between room temperature and 1403 K. The study was aimed at resolving previous uncertainties regarding the nature of the paraelectric-ferroelectric transition and the possibilities of any secondary structural transitions. We observe a clear transition at 125814 K corresponding to a unit cell tripling and a change in space group from centrosymmetric to polar . Despite the fact that this symmetry permits ferroelectricity, our experimental data for this transition analysed in terms of symmetry-adapted displacement modes clearly supports previous theoretical analysis that the transition is driven primarily by the antiferrodistortive mode. We therefore verify previous suggestions that YMnO3 is an improper ferrielectric. Furthermore, our data confirm that the previously suggested intermediate phase with space group does not occur. However, we do find evidence for an isosymmetric phase transition (i.e. to ) at 920 K which involves a sharp decrease in polarization. This secondary transition correlates well with several previous reports of anomalies in physical properties in this temperature region and may be related to Y-O hybridization.
pacs:
61.05.fm,61.50.Ks,77.80.-eI Introduction
The AMnO3 manganites (with A= Lanthanide, In, Y, Sc) have attracted much interest in recent years due to their multiferroic properties Lee et al. (2008); Choi et al. (2010). Two structural forms of these materials exist, both displaying multiferroicityZhou et al. (2006). The orthorhombic form, a perovskite with room temperature space group Pnma, occurs for A=La-Tb. The hexagonal form, with a layered structure, shown in Figure 1(a) with space group at room temperature, is favoured for A= Dy-Lu, In, Y, Sc. Varying the synthesis technique, however, allows for some flexibility of this trendZhou et al. (2006).
YMnO3 can be synthesised in either of the two polymorphs. The hexagonal form is obtained when standard ambient pressure solid state synthesis conditions are used. This form has Mn3+ ions coordinated by five oxide ions, forming a trigonal bipyramid. The Y3+ ions are coordinated by eight oxide ions (six equatorial oxygens from two symmetry inequivalent sites and two inequivalent apical oxygens). The bipyramids are tilted with respect to the c-axis and the two Y-O apical bond lengths for each yttrium site are unequal as a result of this.
The hexagonal manganites are ferrielectric (i.e. have opposite but unequal dipole moments within the unit cell leading to a net polarization) up to high temperatures in excess of 900 K Abrahams (2001) and order antiferromagnetically below 70 KChatterji et al. (2007). The ferrielectricity is due to opposing dipoles caused by opposite but unequal displacements of the two yttrium sites and the associated tilting and distortion of the MnO5 bipyramidsFennie and Rabe (2005); Van Aken et al. (2004). This is an unusual driving mechanism for ferroelectricity and has been termed ‘geometric ferroelectricity’Van Aken et al. (2004) as it seems to depend purely on ionic size effects rather than the more ubiquitous electronic effects such as cation Jahn-Teller distortions (Ti4+, Nb5+ etc.)Khomskii (2006) or the presence of stereochemically active lone pair cations such as Pb2+ or Bi3+.
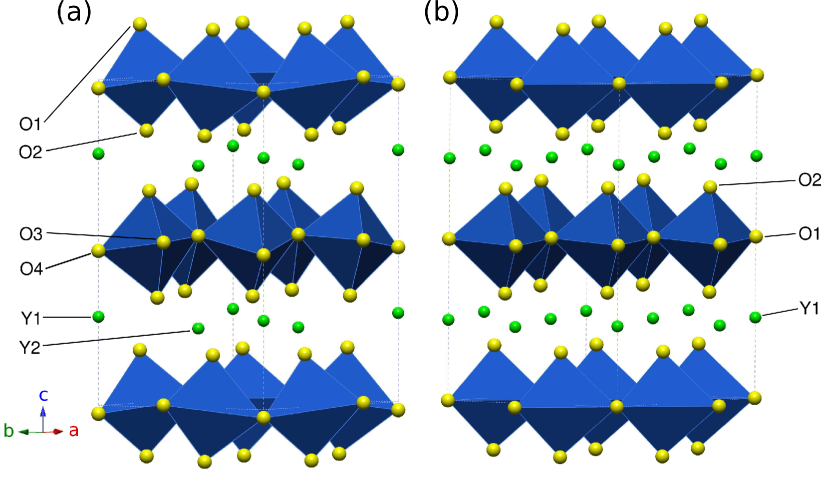
Due to the experimental difficulties in measuring physical properties such as the dielectric constant at the high temperatures of the ferrielectric phase transition, ambiguity exists about the mechanism and exact nature of the transition between the room temperature polar structure and the centrosymmetric state (shown in Figure 1(b)) which is suggested to exist above 1250 K. This aristotype structure is the undistorted form of the ambient temperature structure. The low temperature structure is generated from the aristotype by loss of mirror symmetry perpendicular to the c-axis resulting in tilted MnO5 bipyramids, unequal apical Y-O bond lengths and a larger unit cell, with three times the unit cell volume and the low temperature unit cell parameters a= and c=c′.
Previous studies have produced a wide range of transition temperatures using various methods, tabulated in Table 1, for both the ferrielectric transition temperature () and the unit cell tripling transition between and () which tilts the MnO5 trigonal bipyramids (untilted in the high-temperature phase) and corrugates the Y3+ layers leading to tripling of the ab-plane unit cell area and therefore the unit cell volume.
| Reference | TC (K) | TS (K) | Method |
|---|---|---|---|
| Ismailzade | 933 | - | pyroelectric |
| and KizhaevIsmailzade and Kizhaev (1965) | current | ||
| Łukaszewicz and | - | 1275 | SXD |
| Karat-Kaliciska Łukaszewicz and Karut-Kaliciska (1974) | |||
| Katsufuji et al. (2001) Katsufuji et al. (2001) | 910 | - | resistivity |
| Katsufuji et al. (2002)Katsufuji et al. (2002) | 1000 | 1000 | PXRD |
| Nnert et al. (2005)Nnert et al. (2007) | 1020 | 1273 | SXD |
| Nnert et al. (2007)Nnert et al. (2007) | 1125 | 1350 | powder DTC |
| Jeong et al.Jeong et al. (2007) | - | 1200 | PND |
| Choi et al.Choi et al. (2010) | 880 | - | resistivity |
| Kim et al.Kim et al. (2009) | 920 | - | PXRD (MEM) |
The variety of transition temperatures measured has been attributed to impurities introduced by the synthesis method Nnert et al. (2007) but the subtle nature of the transitions and lack of polarization or thermodynamic measurements also make transition temperatures difficult to define.
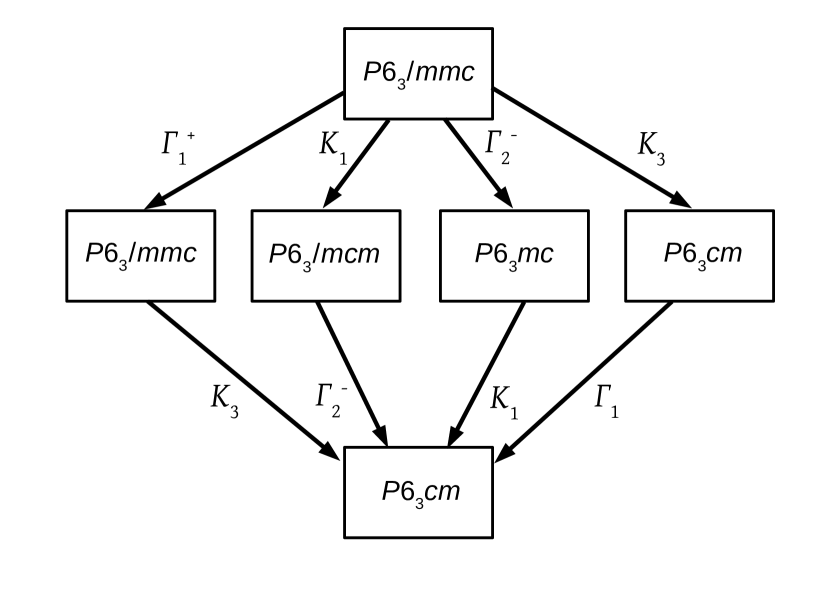
Furthermore, the possibility of an intermediate phase between and has been notedLonkai et al. (2004); Nnert et al. (2007); Abrahams (2009). The possible intermediate phases were identified using descent of symmetry arguments Fennie and Rabe (2005); Lonkai et al. (2004); a diagram of the possible transition paths is shown in Figure 2. The transition from to would involve unit cell tripling caused by displacement of the O1-Mn-O1 axis within the ab-plane but no tilt of the MnO5 bipyramids or Y3+ displacement. Taking the path from to would involve no change in unit cell volume, only loss of the mirror plane allowing independent polar displacements of all atoms along c. Therefore, the most straightforward method of identifying the transition path is to determine whether the cell tripling occurs at the same point as the polar displacement and examine the Y site splitting and tilt of the MnO5 bipyramids.
Although Nnert et al.Nnert et al. (2007) proposed as the intermediate phase, no structural parameters from their intermediate phase region were published. Therefore, a systematic variable temperature study with careful examination of the distortions of the structure and comparative refinements of alternative space groups is required.
Most crystallographic studies thus far have used powder x-ray diffraction which usually does not allow such reliable and precise determination of lattice parameters and atomic positions in oxide materials as neutron diffraction. This therefore increases the difficulty of pinning down the location and nature of the phase transitions. The only previous powder neutron study Jeong et al. (2007) involved four temperatures between 1000 K and 1400 K and left the key issues unresolved. To attempt to resolve this uncertainty, we have undertaken a higher resolution powder neutron diffraction study using finer temperature intervals.
II Experimental
II.1 Sample Synthesis and Characterisation
A single phase polycrystalline sample was prepared by standard solid state synthesis. A stoichiometric mixture of Y2O3 (Sigma Aldrich 99.999%) and MnO2 (Sigma Aldrich 99.99+%) was ground under acetone, pressed into pellets and heated at 1473 K on sacrificial powder in an alumina boat for 140 hours with intermediate grindings every 18 hours. The sample quality was monitored using laboratory x-ray diffraction (Stoe STADI P with Cu Kα1 source in flat-plate transmission mode) throughout the synthesis to ensure a phase-pure sample was obtained. Energy Dispersive X-ray (EDX) spectroscopy was also used to confirm that the sample was not contaminated by, for example, aluminium from the alumina crucible.
II.2 Powder Neutron Diffraction
Powder neutron diffraction was undertaken on the High Resolution Powder Diffractometer (HRPD) at ISISIbberson et al. (1992); Ibberson (2009). A 5g sample was sealed in a quartz tube and placed in a cylindrical vanadium can mounted in a standard furnace. Data were collected at 28 temperatures between 293 K and 1403 K (every 60 K from 373 K to 1093 K then intervals of 10 - 30 K to 1403 K) with appropriate equilibration times at each temperature before commencement of data collection. The data used for the analysis were all taken from the backscattering detector bank centred at 168∘ with resolution . Data were refined using the Rietveld method with the program GSAS Larson and Von Dreele (2000). A 20 term shifted Chebyshev background function was used to account for the substantial quartz background and appropriate absorption corrections were applied. Small peaks from the vanadium can were identified in all patterns, these were not included in the refinements.
III Results
III.1 High Temperature Phase
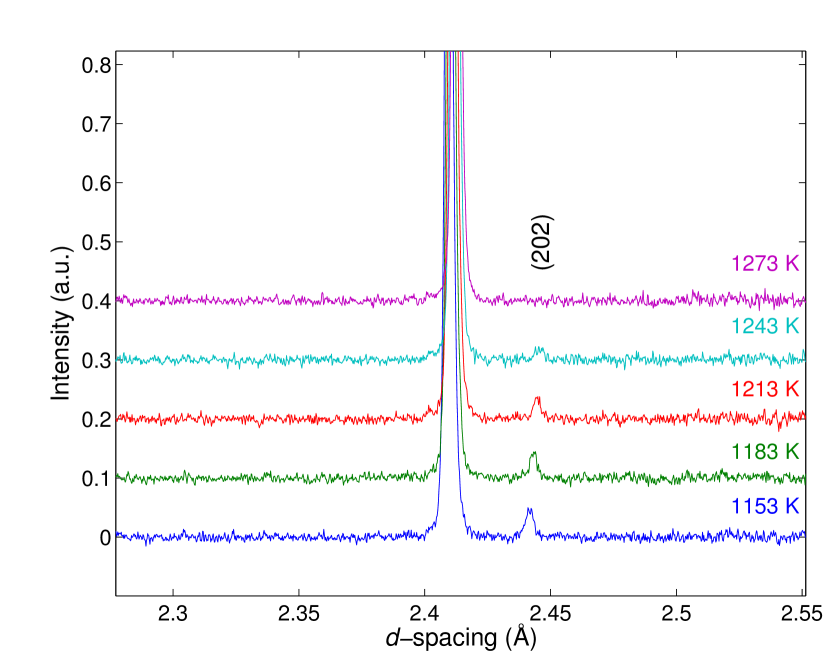
The transition from the high temperature phase to the low temperature unit cell tripled phase is signalled most clearly by the appearance of the peak due to the factor of increase in a as shown in Figure 3. This peak is absent in all datasets above the 1243 K dataset where it first appears. It then increases in intensity with decreasing temperature. The diffraction patterns have no reflections breaking symmetry at 1273 K or above.
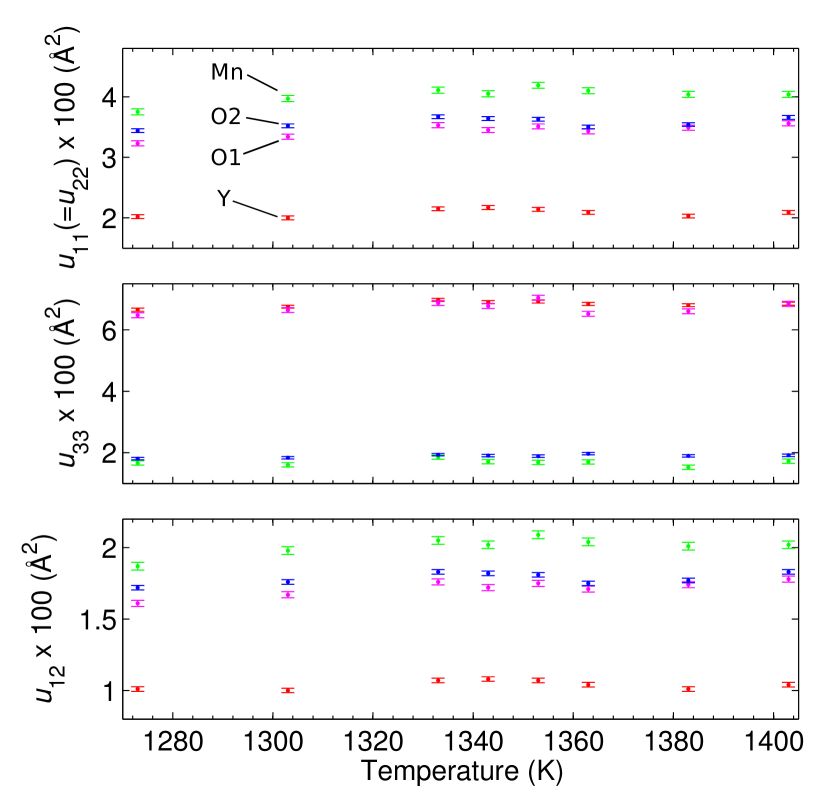
The Rietveld refinements in the high temperature phase converged quickly and anisotropic thermal displacement factors were refined for all sites. Refined structural parameters in the phase at 1303 K are given in Table 2.
| Atom | Wyckoff | x | y | z | 100 (Å2) | 100 (Å2) | 100 (Å2) |
|---|---|---|---|---|---|---|---|
| Position | |||||||
| Y1 | 2a | 0 | 0 | 0 | |||
| Mn | 2c | ||||||
| O1 | 2b | 0 | 0 | ||||
| O2 | 4f | 0.08557(7) |
The smooth variation of the thermal displacement factors (see supplementary material) and lattice parameters with temperature in this high temperature regime suggest that there is no higher temperature phase transition. Refinements in the polar space group in the same unit cell did not give improved fits (see supplementary material). Moreover, there is no previous evidence of any physical property measurements supporting the occurrence of a non-centrosymmetric phase at this temperature. There is also no indication of a transition to a further high temperature polymorph in space group which was recently proposed by Abrahams Abrahams (2009) to be the aristotype structure present above the phase. This structure would have a halved c-axis length relative to the other phases and would require a large displacement ( 0.99 Å) in oxide ion positions. The existence of this phase also seems implausible in chemical grounds as it requires abnormally short Y-O bonds. From our data we conclude that in the temperature range 1403 K to 1273 K YMnO3 exists in the phase.
III.2 The Unit Cell Tripled Phases
The dataset immediately below the tripling transition was refined against and models to check for the existence of the previously proposed intermediate phase. Both refinements followed the same strategy with the same time-of-flight range, background type and number of background coefficients. Individual isotropic thermal displacement parameters were refined for all atoms.
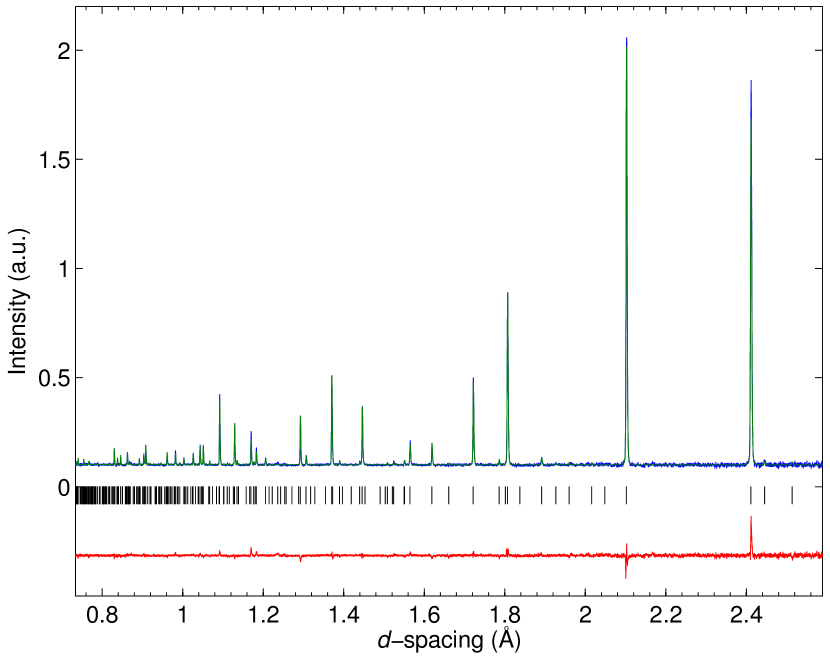
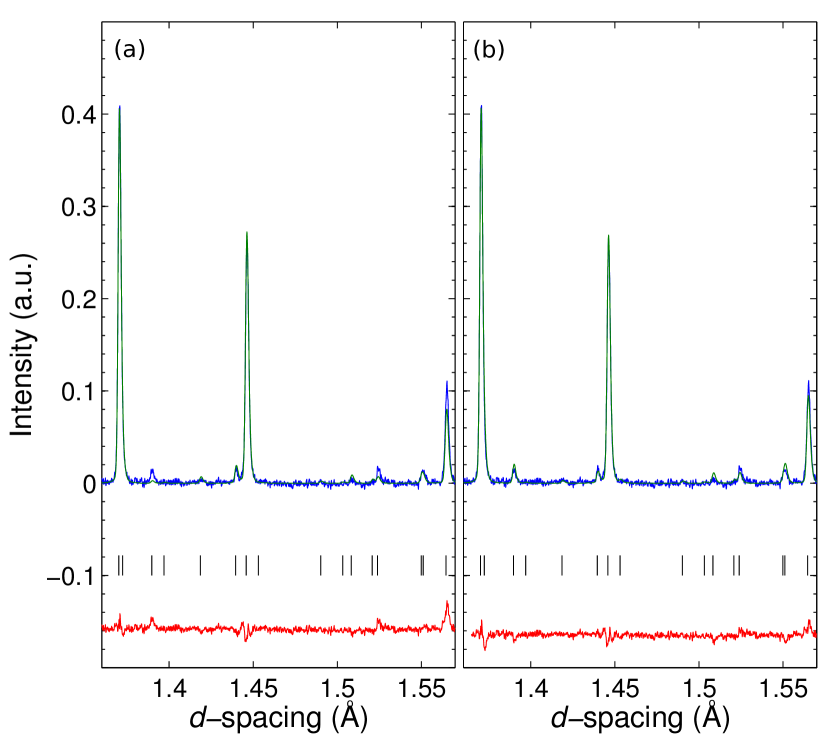
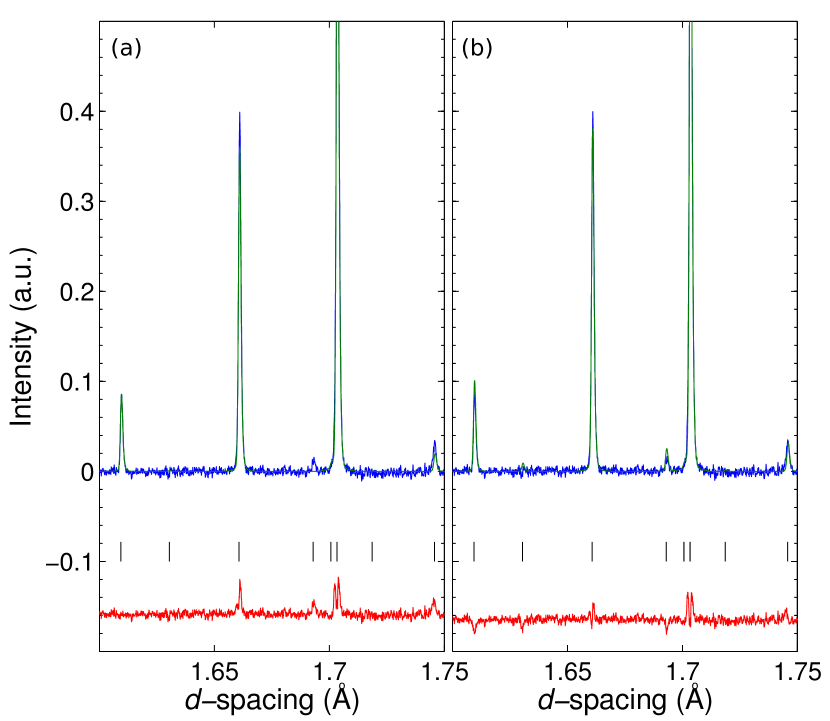
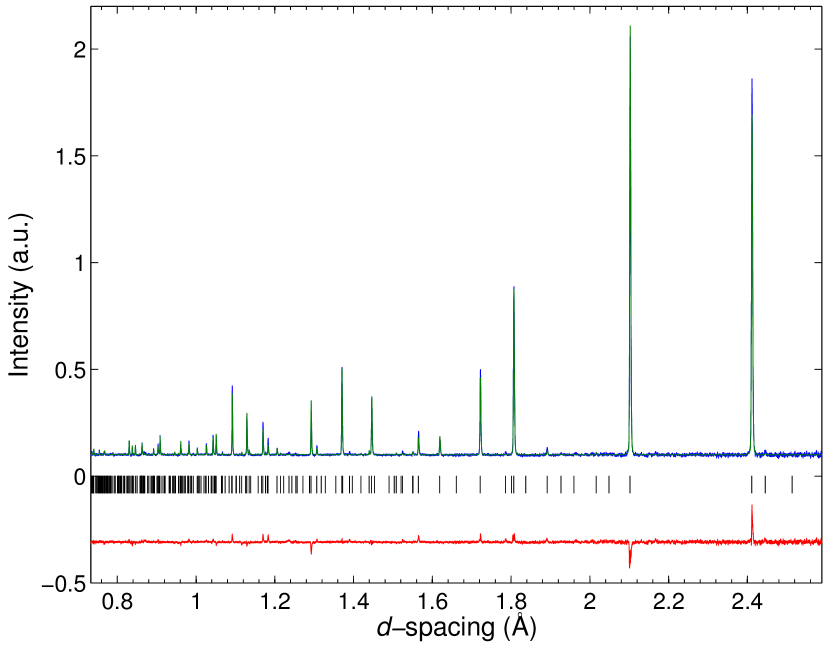
Figure 4 shows the plot resulting from the Rietveld refinement in space group and Figures 5 and 6 show plots of the comparative refinements over selected d-spacing ranges. The phase proposed by Nnert et al. Nnert et al. (2007) and Abrahams Abrahams (2009) gave a poorer refinement judged by both R factors and by eye. The refined structural parameters and the wRp and values for the model are shown in Table 3. The parameters for the model are included in the supplementary information.
Two specific points may be noted in the refinement. First, the refined x parameter of O1 is within error of (i.e. the allowed displacement does not occur). Second, the thermal displacement parameter, , for the equatorial oxygen O3 (corresponding to O4 in the model) is almost twice as large as the other two oxygen thermal displacement parameters. Indeed, anisotropic refinement of this atom shows a highly elongated ellipsoid (due to a large parameter). This indicates that the continued imposition of the mirror symmetry perpendicular to c in the tripled cell is physically unreasonable and the equatorial oxygen plane is in reality tilted. On removal of the mirror plane (i.e. in the polar model) both of the equatorial oxide sites and the yttrium sites are allowed to relax their z-coordinates leading to significant displacements and more reasonable values. Based on our data, we therefore conclude that the correct space group is .
| Atom | Wyckoff | x | y | z | u 100 (Å2) |
|---|---|---|---|---|---|
| Position | |||||
| Y1 | 2a | 0 | 0 | 0.2639(5) | |
| Y2 | 4b | 0.2399(4) | |||
| Mn | 6c | 0.3094(6) | 0 | 0 | |
| O1 | 6c | 0.3297(7) | 0 | 0.1656(4) | |
| O2 | 6c | 0.6621(7) | 0 | 0.3394(4) | |
| O3 | 2a | 0 | 0 | 0.5083(7) | |
| O4 | 4b | 0.0153(5) |
The Rietveld refinements were performed for all datasets up to the unit cell tripling transition in space group . The data above the transition was refined in . The refined structural parameters for the room temperature data are shown in Table 4 and are in very good agreement with previous single crystal studies Van Aken et al. (2004).
| Atom | Wyckoff | x | y | z | u 100 (Å2) |
|---|---|---|---|---|---|
| Position | |||||
| Y1 | 2a | 0 | 0 | 0.2728(5) | |
| Y2 | 4b | 0.2325(4) | |||
| Mn1 | 6c | 0.3177(9) | 0 | 0 | |
| O1 | 6c | 0.3074(4) | 0 | 0.1626(4) | |
| O2 | 6c | 0.6427(3) | 0 | 0.3355(4) | |
| O3 | 2a | 0 | 0 | 0.4744(6) | |
| O4 | 4b | 0.0169(5) |
Figure 7 shows the lattice parameters and unit cell volumes extracted from the refinements.
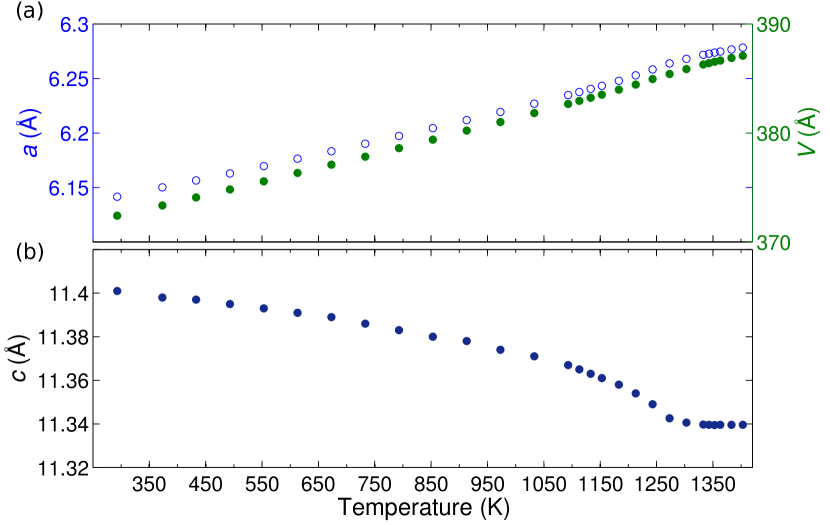
An almost linear temperature dependence of the a-axis parameter (the a-axis parameter obtained from the refinements of data in the high temperature centrosymmetric phase are scaled by a factor of ) is seen up to about 1100 K where an increase in gradient becomes noticeable. This is followed by a sharp decrease in gradient near 1270 K. The c-axis parameter decreases until about 1270 K above which it is roughly constant and the cell volume shows a similar trend to the a-axis parameter. The standard deviations of the lattice parameters are of the order of Å for the a-axis and Å for the c-axis.
The trends in a and V are better seen by removing a linear term from the temperature dependence.
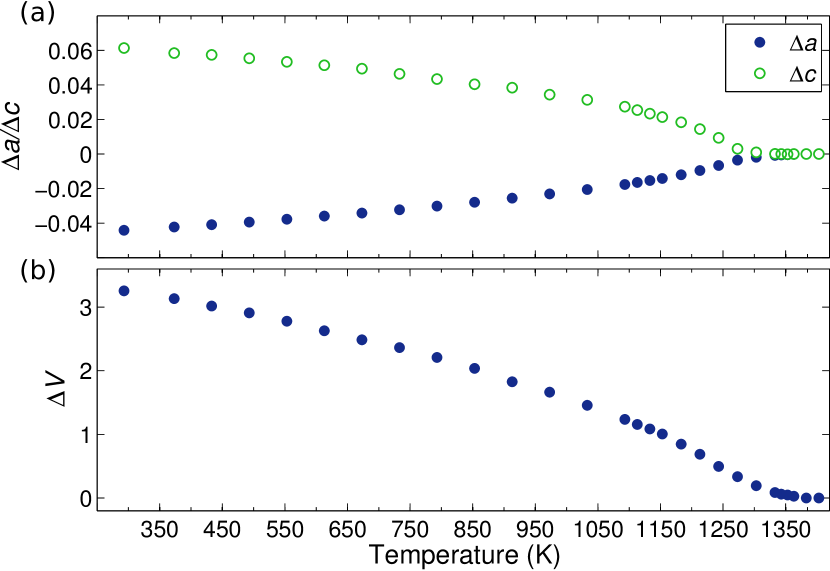
This was done by subtracting a simple linear fit to the highest temperature data (where the dependence is effectively linear) and scaling all data points by the 1403 K value. The results of this are shown in Figure 8 and the change in behaviour around 1270 K is clear in all three variables. This is confirmed by inspection of the temperature derivatives of a and c shown in Figure 9.
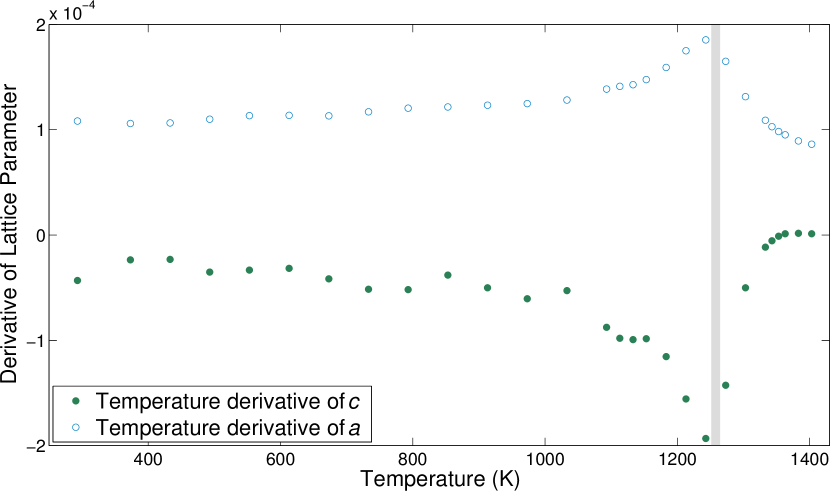
The tripling of the unit cell directly upon leaving the phase removes the possibility of a transition through as this structure would retain the smaller unit cell. From the lattice parameter derivative data it is clear that the unit cell tripling transition is in the range 125814 K, which confirms the direct evidence from the superlattice peaks presented in Figure 3.
The corrugation of the Y3+ layers may also be examined to investigate displacements occurring as the system moves towards the high temperature centrosymmetric phase. This phase has a single Y3+ site with symmetry at fractional coordinates (0,0,). When the symmetry is lowered, the mirror plane is lost and two of the six Y3+ ions displace ‘upwards’ along z (Y1, Wyckoff site 2a) while four displace ‘downwards’ (Y2, Wyckoff site 4b) from the centrosymmetric position. The sum of the c-axis displacements, in Ångströms for a single ion from each site, , is shown in Figure 10.
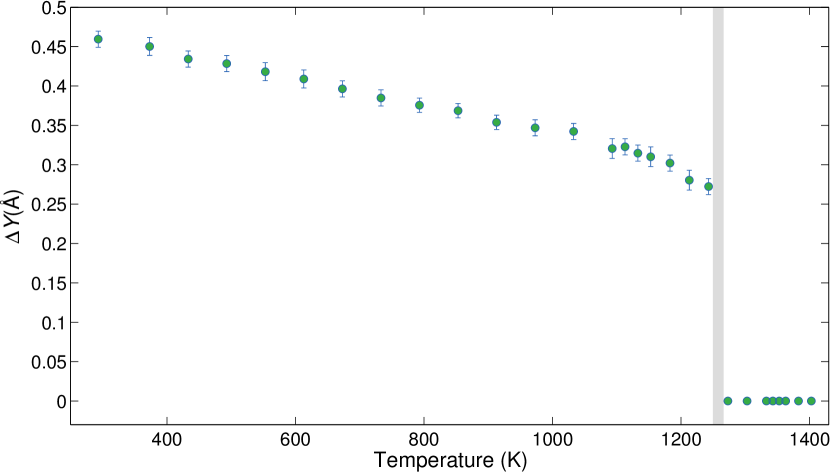
.
The corrugation increases from zero in the phase to about 0.27 Å sharply and then increases smoothly with decreasing temperature.
III.3 Secondary Transition
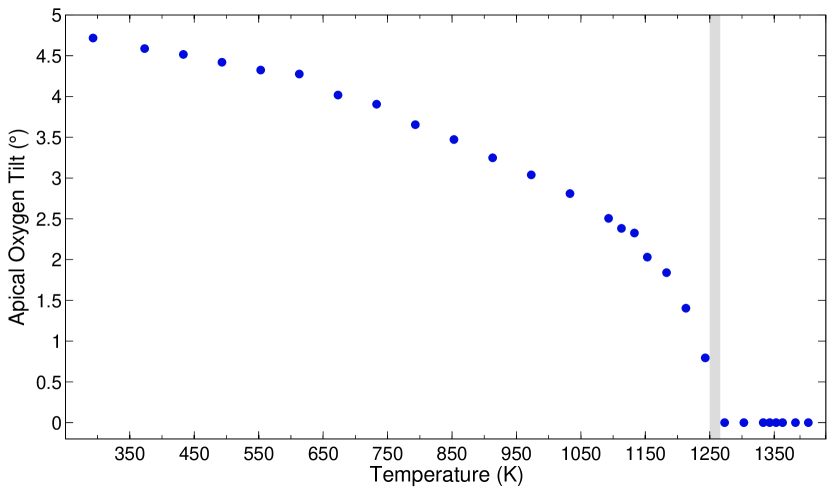
In the higher symmetry phase, the MnO5 trigonal bipyramids are untilted. It can be seen from Figure 11 that the evolution of apical tilt angle (calculated by taking the angle of O1-O2 to the c-axis direction) with decreasing temperature is relatively smooth, being fixed to zero by symmetry at and above 1273 K.
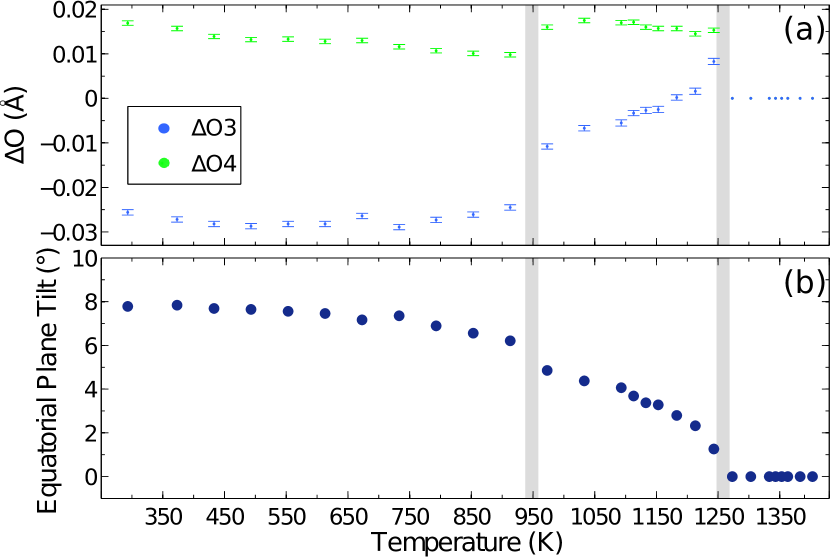
Inspection of the O3 and O4 z coordinates, shown in Figure 12(a), shows a feature around 913 K with both z-coordinates suddenly decreasing. The displacement of O3, in particular, increases markedly with decreasing temperature, moving below the Mn ion for 853 K. Figure 12(b) shows the tilt of the equatorial oxygen plane with temperature (angle of O3-O4 to the ab-plane), there is a sharp increase at 913 K. The sudden decrease in O3(z) and O4(z) and increase in the equatorial oxygen plane tilt would correspond to a sharp decrease in polarization. This would account for the peak in pyroelectric current seen by Ismailzade and Kizhaev Ismailzade and Kizhaev (1965) as pyroelectric current is proportional to for constant heating rate. The resistivity data of Katsufuji et al.Katsufuji et al. (2001) and Choi et al.Choi et al. (2010) also show a crossover in resistivity behaviour in this temperature region.
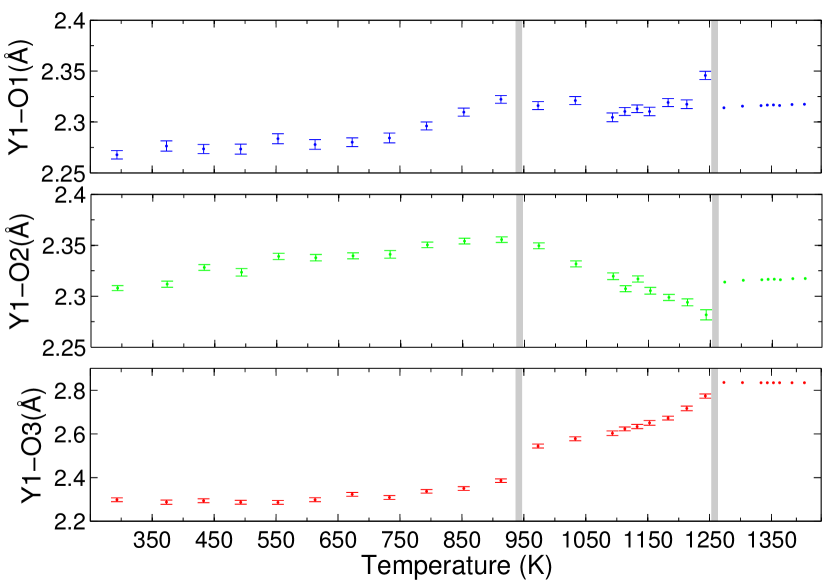
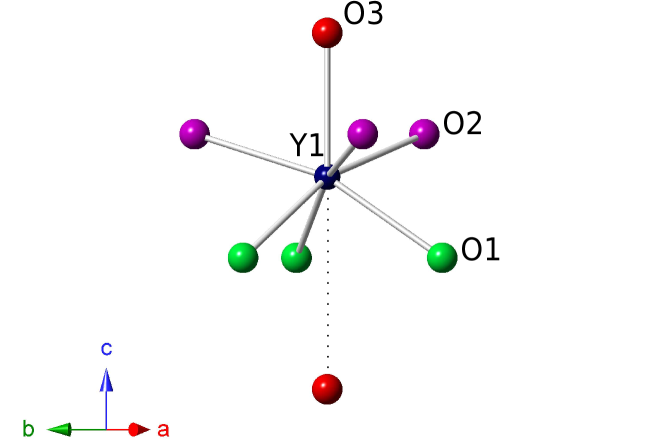
The Y-O bond lengths shown in Figure 13 vary smoothly within error bars except for around 913 K where there is a sudden decrease in the Y1-O3 bond length. This corresponds to the bonding change seen by Kim et al Kim et al. (2009). These authors observed hybridisation of Y1 and O3 between 910 K and 930 K by Maximum Entropy Method (MEM) analysis of the electron density from synchrotron x-ray data. The O3 coordinates the Y1 site apically whereas the O1 and O2 coordinate it in the equatorial direction as shown in Figure 14. The concordance of the structural changes seen in the present study with the pyroelectric current, resistivity and x-ray diffraction data strongly suggests that there is an isosymmetric phase transition taking place at 920 K.
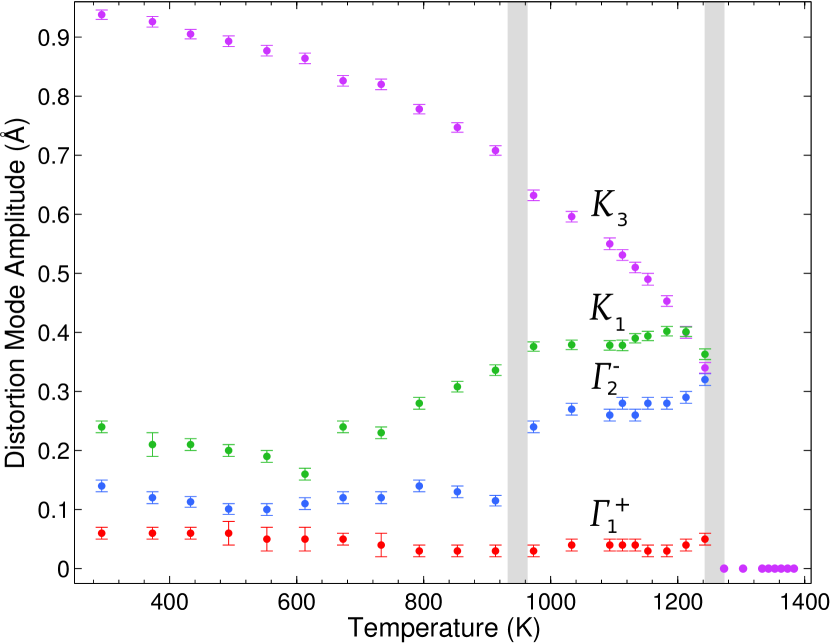
The program Amplimodes Orobengoa et al. (2009); Perez-Mato et al. (2010) was used to examine the magnitude of the , , and distortion modes of . The results are shown in Figure 15. The nature of these distortion modes can also be examined and visualised using IsodisplaceCampbell et al. (2006). corresponds to a symmetric breathing mode with the order parameter being the change in z coordinate of the apical oxygen O1. involves a polar displacement of the ions along the c-axis leading ultimately to the space group . leads to the space group by allowing only the O-Mn-O axis to displace in the ab-plane, tripling the unit cell. is the antiferrodistortive mode leading to by a tilt of the MnO5 bipyramids and antiparallel displacements of the Y3+ cations leading to unit cell tripling.
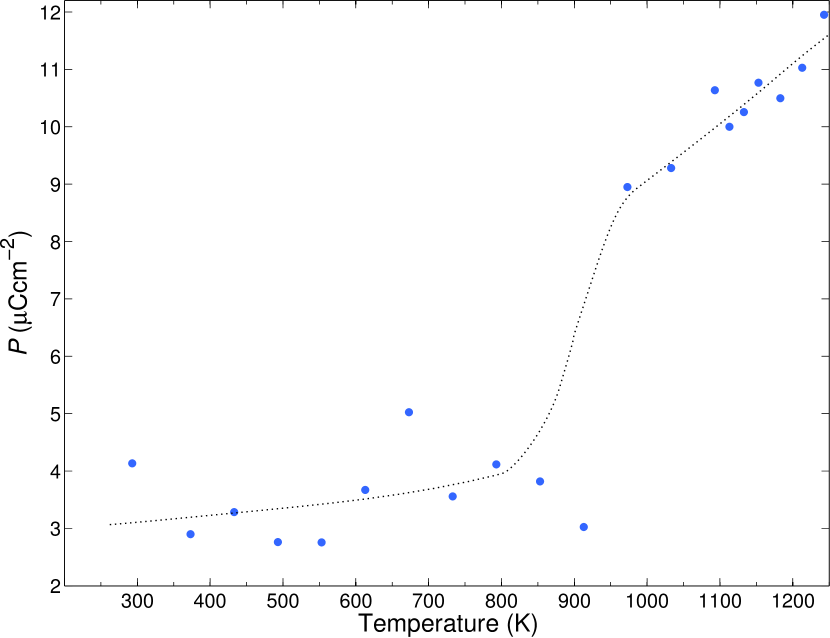
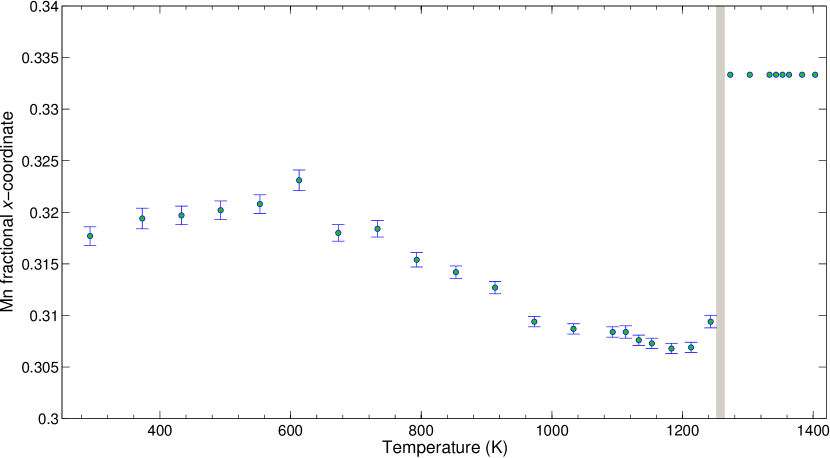
It is clear that the mode is dominant in general although the mode amplitude is slightly larger for the 1243 K dataset (we note that this results almost exclusively from a significant displacement of the Mn x-coordinate (see supplementary material): since the Mn atom has the smallest neutron scattering length, this is the least well-determined positional parameter in this study). This dataset was refined in both and space groups as already stated and gave the better fit. At the secondary transition (920 K), the amplitude of the mode decreases abruptly and the mode shows a small step increase. This would (as a partial contribution to the polarization of the structure) cause a sharp decrease in the polarization and corresponds to the behaviour seen in O3 and O4 parameters. The polarization, , was estimated for the refined structures using a simple ionic model,
where is the displacement of the site from the centrosymmetric position in Ångströms, is the ionic charge, the electron charge, the site multiplicity is denoted by and the unit cell volume by . The results of this estimate are shown in Figure 16.
IV Conclusions
In summary, our data confirm that there is no intermediate phase (of the proposed symmetry or any other candidate symmetries) between the high temperature, paraelectric phase and the unit-cell tripled polar phase. This transition occurs between 1243 and 1273 K and is driven primarily by a non-polar displacement mode of symmetry in agreement with earlier theoretical works Fennie and Rabe (2005). Hexagonal YMnO3 is therefore an improper ferroelectric, with the antiferrodistortive mode triggering a weaker, polar distortion of type. Although there is no clearly defined ‘intermediate’ phase of differing crystallographic symmetry, our data provide subtle, but compelling evidence of a secondary isosymmetric transition in the regime, at around 920 K. This transition involves polar displacements of the Mn-O equatorial planes, and may be related to an electronic transition involving hybridisation of the Y1-O3 bond. Perhaps surprisingly, this leads to a decreased polarization but nevertheless does agree with the various anomalies in physical properties reported around this temperature.
Acknowledgements.
We thank the EPSRC and STFC for funding, K.E. Johnston for experimental assistance and F.D. Morrison for discussions.References
- Lee et al. (2008) S. Lee, A. Pirogov, M. S. Kang, K. H. Jang, M. Yonemura, T. Kamiyama, S. W. Cheong, F. Gozzo, N. Shin, H. Kimura, Y. Noda, and J. G. Park, Nature, 451, 805 (2008).
- Choi et al. (2010) T. Choi, Y. Horibe, H. T. Yi, Y. J. Choi, W. D. Wu, and S. W. Cheong, Nature Materials, 9, 253 (2010).
- Zhou et al. (2006) J.-S. Zhou, J. B. Goodenough, J. M. Gallardo-Amores, E. Morán, M. A. Alario-Franco, and R. Caudillo, Phys. Rev. B, 74, 014422 (2006).
- Abrahams (2001) S. C. Abrahams, Acta Crystallographica Section B-structural Science, 57, 485 (2001).
- Chatterji et al. (2007) T. Chatterji, S. Ghosh, A. Singh, L. P. Regnault, and M. Rheinstädter, Phys. Rev. B, 76, 144406 (2007).
- Fennie and Rabe (2005) C. J. Fennie and K. M. Rabe, Phys. Rev. B, 72, 100103 (2005).
- Van Aken et al. (2004) B. B. Van Aken, T. T. M. Palstra, A. Filippetti, and N. A. Spaldin, Nature Materials, 3, 164 (2004).
- Khomskii (2006) D. I. Khomskii, Journal of Magnetism and Magnetic Materials, 306, 1 (2006).
- Ismailzade and Kizhaev (1965) I. G. Ismailzade and S. A. Kizhaev, Soviet Physics Solid State, 7, 236 (1965).
- Łukaszewicz and Karut-Kaliciska (1974) K. Łukaszewicz and J. Karut-Kaliciska, Ferroelectrics, 7, 81 (1974).
- Katsufuji et al. (2001) T. Katsufuji, S. Mori, M. Masaki, Y. Moritomo, N. Yamamoto, and H. Takagi, Phys. Rev. B, 64, 104419 (2001).
- Katsufuji et al. (2002) T. Katsufuji, M. Masaki, A. Machida, M. Moritomo, K. Kato, E. Nishibori, M. Takata, M. Sakata, K. Ohoyama, K. Kitazawa, and H. Takagi, Phys. Rev. B, 66, 134434 (2002).
- Nnert et al. (2007) G. Nnert, Y. Ren, H. T. Stokes, and T. T. M. Palstra, (2007a), arXiv:cond-mat/0504546 .
- Nnert et al. (2007) G. Nnert, M. Pollet, S. Marinel, G. R. Blake, A. Meetsma, and T. T. M. Palstra, Journal of Physics-Condensed Matter, 19, 466212 (2007b).
- Jeong et al. (2007) I. K. Jeong, N. Hur, and T. Proffen, Journal of Applied Crystallography, 40, 730 (2007).
- Kim et al. (2009) J. Kim, K. C. Cho, Y. M. Koo, K. P. Hong, and N. Shin, Applied Physics Letters, 95, 132901 (2009).
- Lonkai et al. (2004) T. Lonkai, D. G. Tomuta, U. Amann, J. Ihringer, R. W. A. Hendrikx, D. M. Többens, and J. A. Mydosh, Phys. Rev. B, 69, 134108 (2004).
- Abrahams (2009) S. C. Abrahams, Acta Crystallographica Section B-structural Science, 65, 450 (2009).
- Ibberson et al. (1992) R. M. Ibberson, W. I. F. David, and K. S. Knight, The High Resolution Powder Diffractometer (HRPD) at ISIS-a User Guide, Rutherford Appleton Laboratory Report RAL-92–031 (1992).
- Ibberson (2009) R. M. Ibberson, Nuclear Instruments and Methods in Physics Research Section A: Accelerators, Spectrometers, Detectors and Associated Equipment, 600, 47 (2009).
- Larson and Von Dreele (2000) A. C. Larson and R. B. Von Dreele, General Structure Analysis System (GSAS), Los Alamos National Laboratory Report LAUR 86-748 (2000).
- Orobengoa et al. (2009) D. Orobengoa, C. Capillas, M. I. Aroyo, and J. M. Perez-Mato, Journal of Applied Crystallography, 42, 820 (2009).
- Perez-Mato et al. (2010) J. M. Perez-Mato, D. Orobengoa, and M. I. Aroyo, Acta Crystallographica Section A, 66, 558 (2010).
- Campbell et al. (2006) B. J. Campbell, H. T. Stokes, D. E. Tanner, and D. M. Hatch, Journal of Applied Crystallography, 39, 607 (2006).
APPENDIX: Supplementary Information
| Atom | Wyckoff | x | y | z | u 100 (Å2) |
|---|---|---|---|---|---|
| Position | |||||
| Y1 | 2b | 0 | 0 | ||
| Y2 | 4d | ||||
| Mn | 6g | 0.3067(6) | 0 | ||
| O1 | 12k | 0.3344(4) | 0 | 0.08845(9) | |
| O2 | 2a | 0 | 0 | ||
| O3 | 4c |
| Atom | Wyckoff | x | y | z | 100 (Å2) | 100 (Å2) | 100 (Å2) |
|---|---|---|---|---|---|---|---|
| Position | |||||||
| Y | 2a | 0 | 0 | 0 | |||
| Mn | 2b | 0.2522(13) | |||||
| O1 | 2a | 0 | 0 | 0.2535(11) | |||
| O2 | 2b | 0.0895(9) | |||||
| O3 | 2b | 0.9185(9) |
| Atom | Wyckoff | x | y | z | 100 (Å2) | 100 (Å2) | 100 (Å2) |
|---|---|---|---|---|---|---|---|
| Position | |||||||
| Y1 | 2a | 0 | 0 | 0 | |||
| Mn | 2c | ||||||
| O1 | 2b | 0 | 0 | ||||
| O2 | 4f | 0.08557(7) |