Radio and Deep Chandra Observations of the Disturbed Cool Core Cluster Abell 133
Abstract
We present results based on new Chandra and multi-frequency radio observations of the disturbed cool core cluster Abell 133. The diffuse gas has a complex bird-like morphology, with a plume of emission extending from two symmetric wing-like features. The plume is capped with a filamentary radio structure that has been previously classified as a radio relic. X-ray spectral fits in the region of the relic indicate the presence of either high temperature gas or non-thermal emission, although the measured photon index is flatter than would be expected if the non-thermal emission is from IC scattering of the CMB by the radio emitting particles. We find evidence for a weak elliptical X-ray surface brightness edge surrounding the core, which we show is consistent with a sloshing cold front. The plume is consistent with having formed due to uplift by a buoyantly rising radio bubble, now seen as the radio relic, and has properties consistent with buoyantly lifted plumes seen in other systems (e.g., M87). Alternatively, the plume may be a gas sloshing spiral viewed edge on. Results from spectral analysis of the wing-like features are inconsistent with the previous suggestion that the wings formed due to the passage of a weak shock through the cool core. We instead conclude that the wings are due to X-ray cavities formed by displacement of X-ray gas by the radio relic. The central cD galaxy contains two small-scale cold gas clumps that are slightly offset from their optical and UV counterparts, suggestive of a galaxy-galaxy merger event. On larger scales, there is evidence for cluster substructure in both optical observations and the X-ray temperature map. We suggest that the Abell 133 cluster has recently undergone a merger event with an interloping subgroup, initiating gas sloshing in the core. The torus of sloshed gas is seen close to edge-on, leading to the somewhat ragged appearance of the elliptical surface brightness edge. We show that the additional buoyant force from a passing subcluster can have a significant effect on the rise trajectories of buoyant bubbles, although this effect alone cannot fully explain the morphology of Abell 133. The radio observations reveal a large-scale double-lobed structure not previously identified in the literature. We conclude that this structure represents a previously unreported background giant radio galaxy at , the northern lobe of which overlies the radio relic in the core of Abell 133. A rough estimate indicates that the contribution of this background lobe to the total radio emission in the region of the relic is modest (%).
Subject headings:
galaxies: clusters: general — cooling flows — galaxies: clusters: individual (Abell 133) — intergalactic medium — radio continuum: galaxies — X-rays: galaxies: clusters1. Introduction
Abell 133 is an X-ray luminous cluster at (Struble & Rood 1999) with indications of a central cooling flow (White et al. 1997). X-ray emission from Abell 133 was first detected by the Ariel 5 satellite (Cooke et al. 1977). In the radio, the cD contains a point-like source associated with some extended emission, and a filamentary diffuse structure roughly 40 kpc northwest of the cD with an unusually steep spectral index, which has been classified as a radio relic (Slee et al. 2001, hereafter S01). ROSAT and Very Large Array (VLA) observations revealed a correlation between central bright X-ray and diffuse radio emission (Rizza et al. 2000). Rizza et al. (2000) detect a bridge of 1.4 GHz radio emission connecting the central source and the diffuse relic, although S01 find no evidence for a connection based on higher fidelity observations at the same frequency.
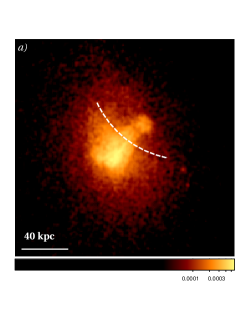
More recently, Chandra (Fujita et al. 2002, hereafter F02) and XMM-Newton (Fujita et al. 2004, hereafter F04) observations revealed a complex bird-like morphology in the central diffuse gas, with a plume of emission extending from symmetric wing-like features at the core. The plume is capped by the diffuse radio structure, and there is a clear deficit of X-ray emission in the region of the relic (excluding the region of the overlapping plume). F02 and F04 consider several formation mechanisms for the plume and wings. They conclude that the plume was likely formed due to lifting of cool central gas by the buoyantly rising radio bubble, similar to what is seen in M87. With the addition of XMM-Newton observations, F04 suggest that the wings are formed by the passage of a weak shock through the cool core. As the shock front passes through the dense central gas, it curves around the central density peak, giving rise to the edges that define the X-ray wings. They also place an upper limit on non-thermal emission from inverse Compton (IC) scattering of cosmic microwave background (CMB) photons by relativistic radio-emitting particles in the region of the relic.
In this paper, we report on results from a new Chandra observation of Abell 133 and from multi-frequency VLA radio observations. Based on these new observations, we re-interpret the origin of the structure in the diffuse gas, examine the connection between the X-ray and radio features, and draw conclusions about the dynamical state and history of Abell 133. We assume an angular diameter distance to Abell 133 of 223.7 Mpc, which gives a scale of 1.08 kpc/″. All error ranges are 68% confidence intervals (i.e., 1), unless otherwise stated.
2. Observations and Data Reduction
2.1. X-ray Observations
Abell 133 was originally observed with Chandra on October 13, 2000, for 36 ksec with the Chandra CCD Imaging Spectrometer (ACIS), pointed such that the central core was visible on the back-side illuminated ACIS-S3 CCD. It was subsequently observed twice in June 2002 with the front-side illuminated ACIS-I CCD array for a total of 90 ksec, with the pointing offset such the core was just beyond the corner of the field of view (FOV), to study the extended diffuse cluster emission (Vikhlinin et al. 2005). Most recently, Abell 133 was observed on August 29, 2008, for 70 ksec with the ACIS-I CCD array, pointed such that the cluster core was well within the FOV. We consider the data from all four of these observations whenever possible, although the core itself is only covered by the ACIS-S3 and most recent ACIS-I observations. The details of these observations are given in Table 1. These data were reduced using the method we have applied previously, e.g., in Randall et al. (2008). All data were reprocessed from the level 1 event files using the latest calibration files (as of CIAO4.1). CTI and time-dependent gain corrections were applied where applicable. LC_CLEAN was used to remove background flares111http://asc.harvard.edu/contrib/maxim/acisbg/. The mean event rate was calculated using time bins within 3 of the overall mean, and bins outside a factor of 1.2 of this mean were discarded. The resulting cleaned exposure times were 30 ksec for ACIS-S3, 43 ksec and 42 ksec for the ACIS-I offset pointings, and 69 ksec for the targeted ACIS-I observation, giving total cleaned exposure times of 99 ksec in the core and 184 ksec west of the core.
Diffuse emission from Abell 133 fills the image FOV for each observation. We therefore used the standard CALDB222http://cxc.harvard.edu/caldb/ blank sky background files appropriate for each observation, normalized to our observations in the 10-12 keV energy band. To generate exposure maps, we assumed a MEKAL model with keV, Galactic absorption, and abundance of 30% solar at a redshift , which is consistent with typical results for the extended emission from detailed spectral fits (see § 4).
2.2. Radio Observations
We obtained low frequency radio observations of Abell 133 (PI: Clarke) using the VLA. Observations at frequencies of 74 and 330 MHz were obtained in the extended A configuration on August 16, 2003, and 330 MHz observations in B configuration were taken on July 9, 2002. Details of the observations are presented in Table 2.
The low frequency observations were all taken in multi-channel continuum mode to allow excision of radio frequency interference and reduce the effects of bandwidth smearing. The A configuration 74 MHz data used Cygnus A as a bandpass and gain calibrator, while the 330 MHz A configuration observations were calibrated using 3C48 as a bandpass, phase, and flux calibrator. The B configuration 330 MHz observations used 3C48 as the bandpass and flux calibrator and the nearby calibrator source 0116-208 as a phase calibrator. All data were processed using the NRAO Astronomical Image Processing System (AIPS). The images were produced through the standard Fourier transform deconvolution method. The data were processed through several loops of imaging and self-calibration to reduce the effects of phase and amplitude errors. Due to the large fields of view at these low frequencies all data were processed within AIPS using the wide-field imaging techniques which correct for distortions in the image caused by the non-coplanarity of the VLA. This technique involved using a set of overlapping maps (facets) to cover the desired image area (Cornwell & Perley 1992).
The first round of phase calibration of the 74 MHz data was undertaken using the best 330 MHz B configuration images as the input model. This method corrects any phase offsets between the two data sets. All data sets were checked for positional errors introduced during calibration by comparing positions from Gaussian fits of ten compact sources surrounding the target to known source positions from the literature. The 330 MHz A configuration data was found to have a small position shift which was corrected using the known source positions.
In addition to our low frequency observations of this system, we have also extracted and reduced VLA archive data at 1400 MHz taken in C configuration. The data were recorded and analyzed in multi-channel continuum mode. The observations included 3C48 as a flux and bandpass calibrator and 0116-208 as a phase calibrator. As with the low frequency observations, data were processed within AIPS following the standard techniques including several rounds of phase-only, followed by amplitude and phase self-calibration. Additionally, we include higher resolution 1400 MHz radio data from Slee et al. (2001) in our analysis.
3. Image Analysis
3.1. The X-ray Image
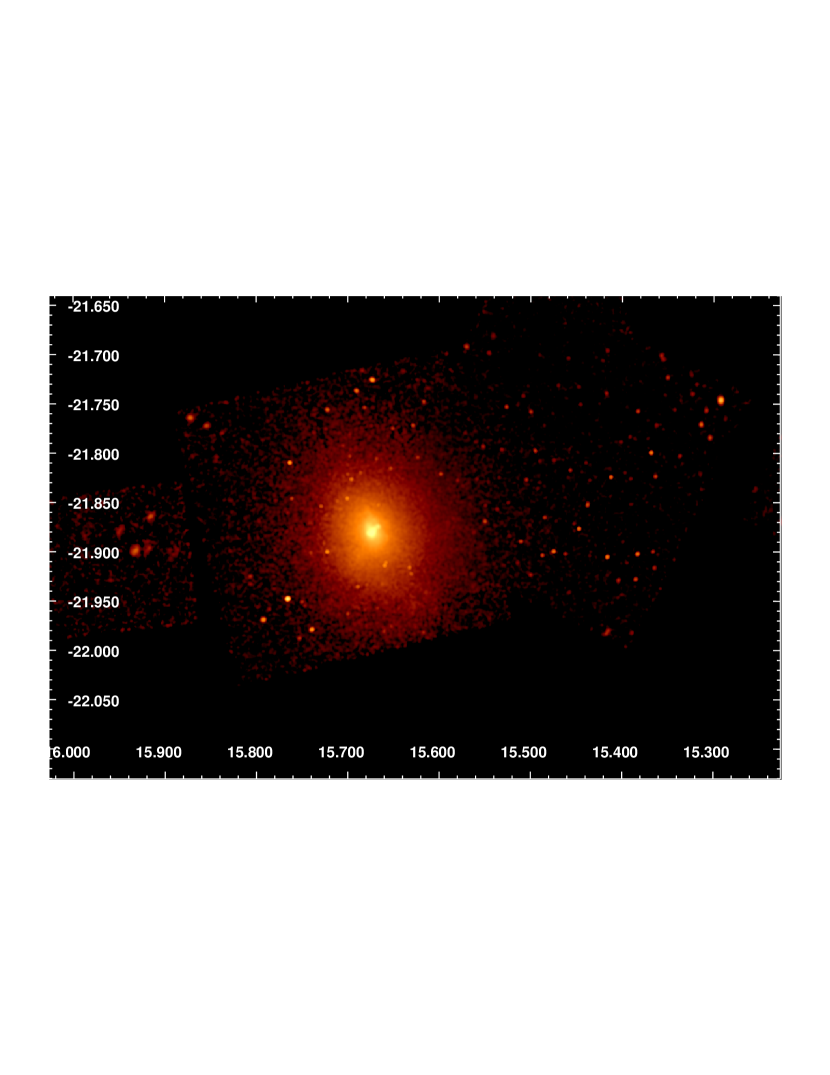
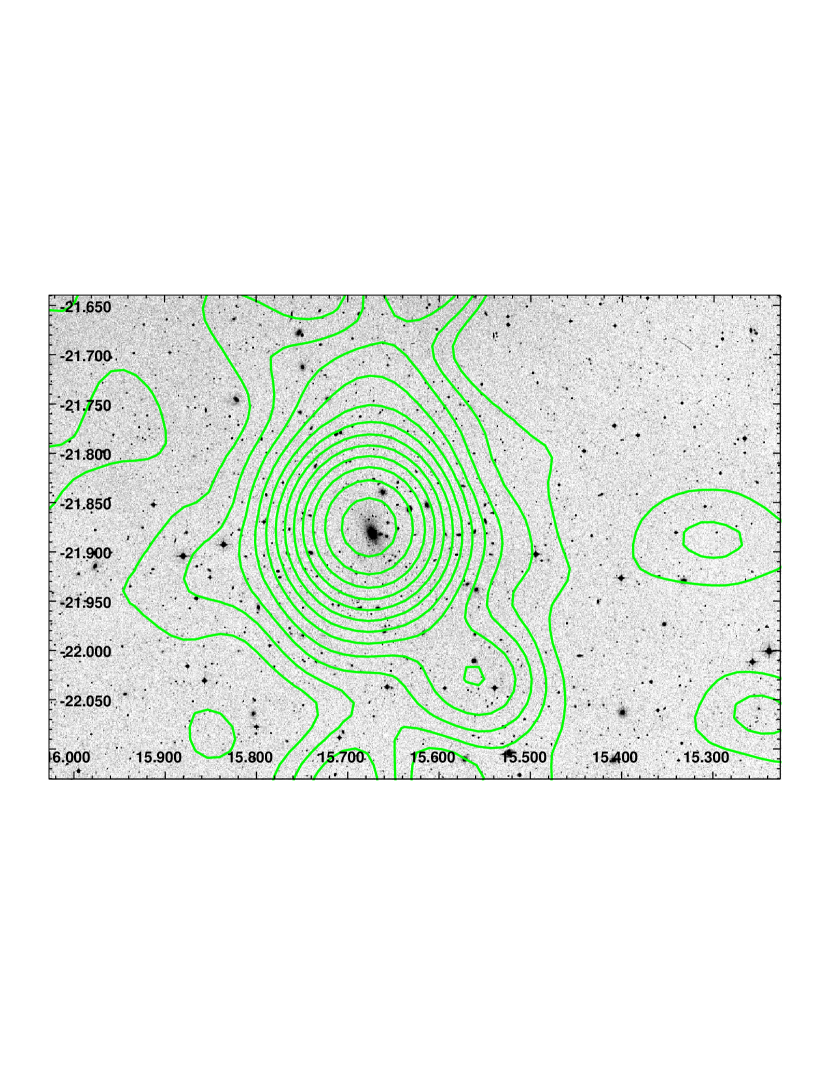
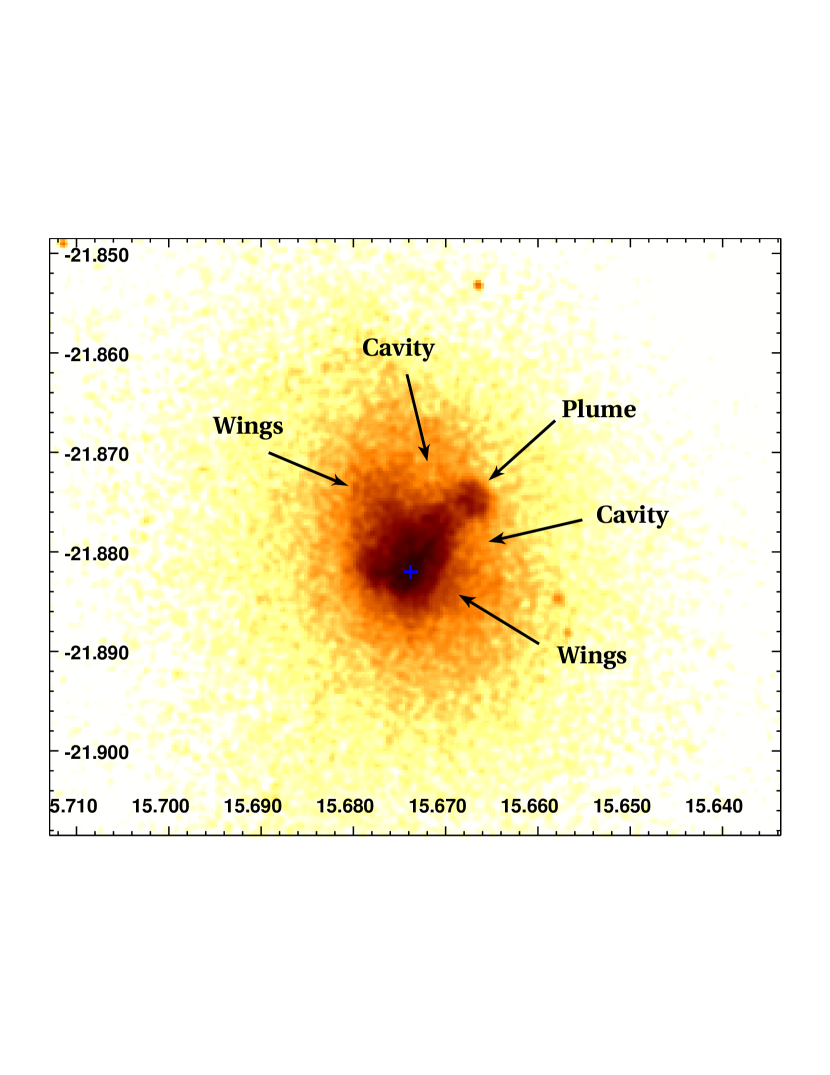
The exposure corrected, background subtracted, smoothed X-ray image is shown in the left panel of Figure 1. In the right panel, the optical DSS image of the same field is shown with ROSAT All Sky Survey (RASS) contours overlaid, which show the extended emission from Abell 133 outside of the Chandra FOV. The image shows complex structure in the core, and an ellipticity in the extended cluster emission, elongated to the north-northeast and south-southwest, that is not evident in the ROSAT contours (although they do show a second peak to the southwest, along the elongation axis). A close-up of the X-ray emission from the core is shown in Figure 2. The core shows a complex “bird-like” morphology, previously noted by F02, with diffuse wings of emission extending from the southern end of a long plume oriented from southeast to northwest (the “tongue” identified by F02). On either side of the plume, north of the X-ray wings, there are two surface brightness depressions, which were identified as X-ray cavities (presumably devoid of X-ray emitting gas) by Bîrzan et al. (2004; 2008). Although the cD galaxy (marked with a blue cross in Figure 2, position from 2MASS catalog by Skrutskie et al. 2006) is near the peak of diffuse X-ray emission, the overall emission is not centered on the galaxy. There is a finger of bright emission extending from the brightness peak in the southeast along the interior of the plume, and terminating just before the round cap to the plume, giving the impression that the plume has formed from gas being pushed or pulled out of the central core. The complex morphology of the diffuse emission, as well as the offset of the central cD galaxy from the local X-ray centroid, indicate a highly disturbed, non-relaxed core.
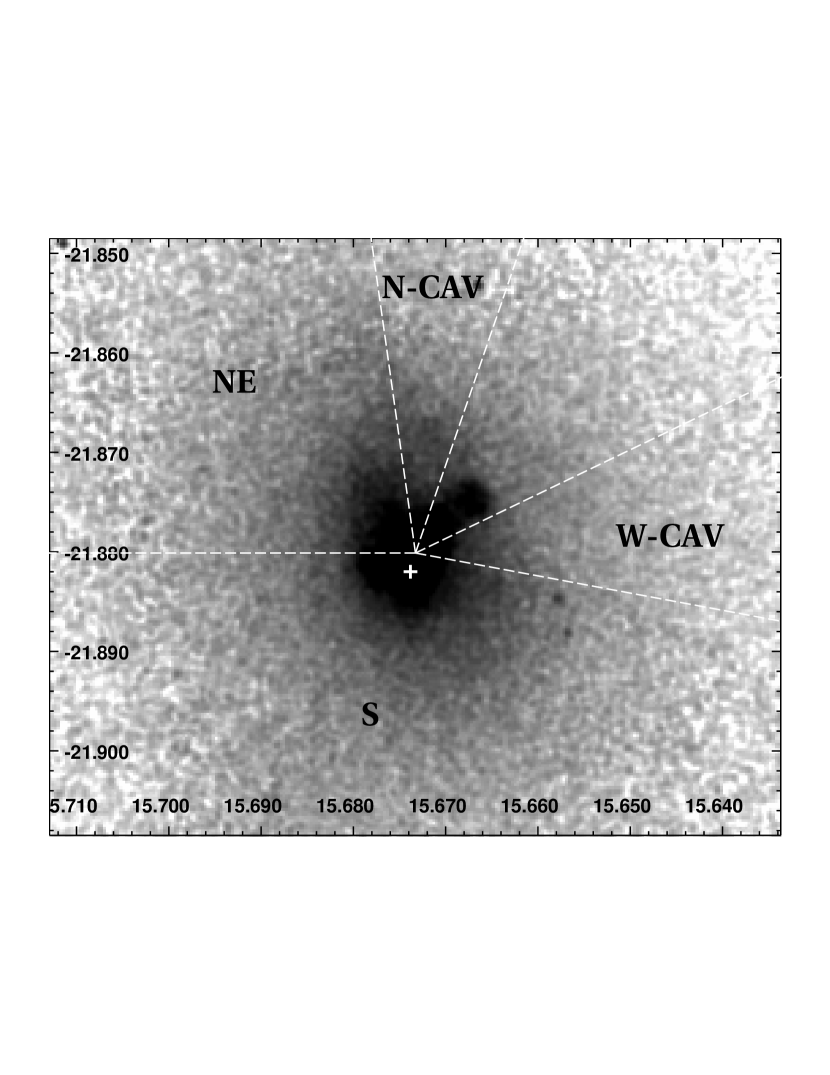
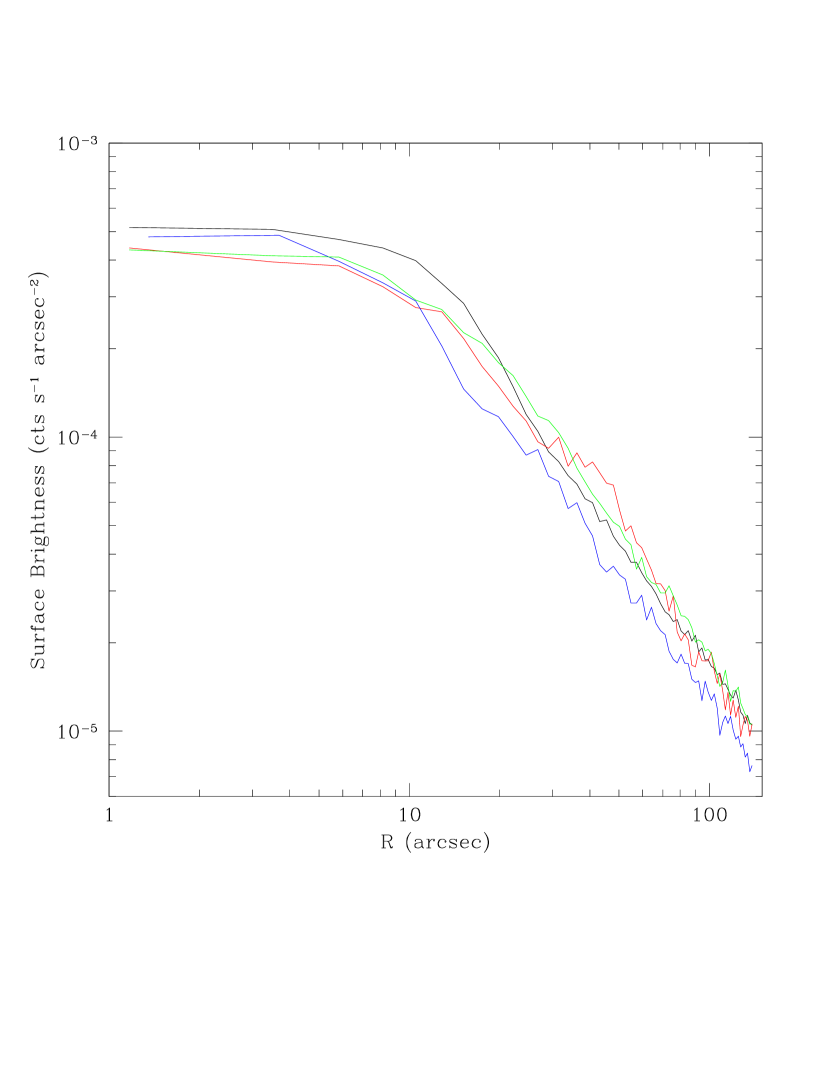
To verify the surface brightness depressions on either side of the plume, we extracted the radial surface brightness profiles in four sectors: one for each of the depressions, and the remaining azimuthal range split into two sectors to the northeast and south (the sector containing the plume was excluded). These sectors are shown in Figure 3. The complex structure in the diffuse emission makes it difficult to chose a central position for our extraction regions. We choose to use the centroid of the X-ray emission within 30″ (33 kpc) of the core, which we find to be (01h02m41.6s, -21∘52′48.4″ [J2000]), 9″ from the position adopted by F02 based on the centroid of the emission at smaller radii. As can be seen from Figure 1, this position does not coincide with the central cD galaxy, nor does it coincide with any bright peaks in the X-ray emission, but rather it is offset from the cD galaxy in the direction of the plume. However, it is consistent with the centroid of the extended emission at large radii, and is therefore appropriate for studying surface brightness profiles outside of the core. The 0.6–5 keV exposure corrected surface brightness profiles for concentric annuli in each sector are shown in Figure 4. The left panel shows the measurements, with error bars, while the right panel shows the profiles as connected lines, without error bars, for clarity. Each of the sectors corresponding to surface brightness depressions show deficits between roughly 10-30″ (red and blue lines in the right panel), consistent with the X-ray image and with existing size estimates for the X-ray cavities (Bîrzan et al. 2004) and coincident radio lobes (Bîrzan et al. 2008) given in the literature. Such depressions are not seen in the northern and southern sectors (green and black lines in the right panel of Figure 4), which instead show abrupt changes in slope at about 27″. We discuss these surface brightness discontinuities further in § 4.3.
To quantify the significance of the cavities, we measured the net surface brightness in annular sectors across the cavities (corresponding to the sectors shown in Figure 3), and in a 247∘ wide sector excluding the cavities and bright plume. The radial range of the sectors was 10″– 30″. We find average 0.3–2 keV net rates of cts s-1 pix-1 for the western cavity, cts s-1 pix-1 for the northern cavity, and cts s-1 pix-1 for the wide sector. Thus, the decrement associated with the northern cavity is significant at 8.3, while the western cavity is significant at 20.
3.2. Radio Images
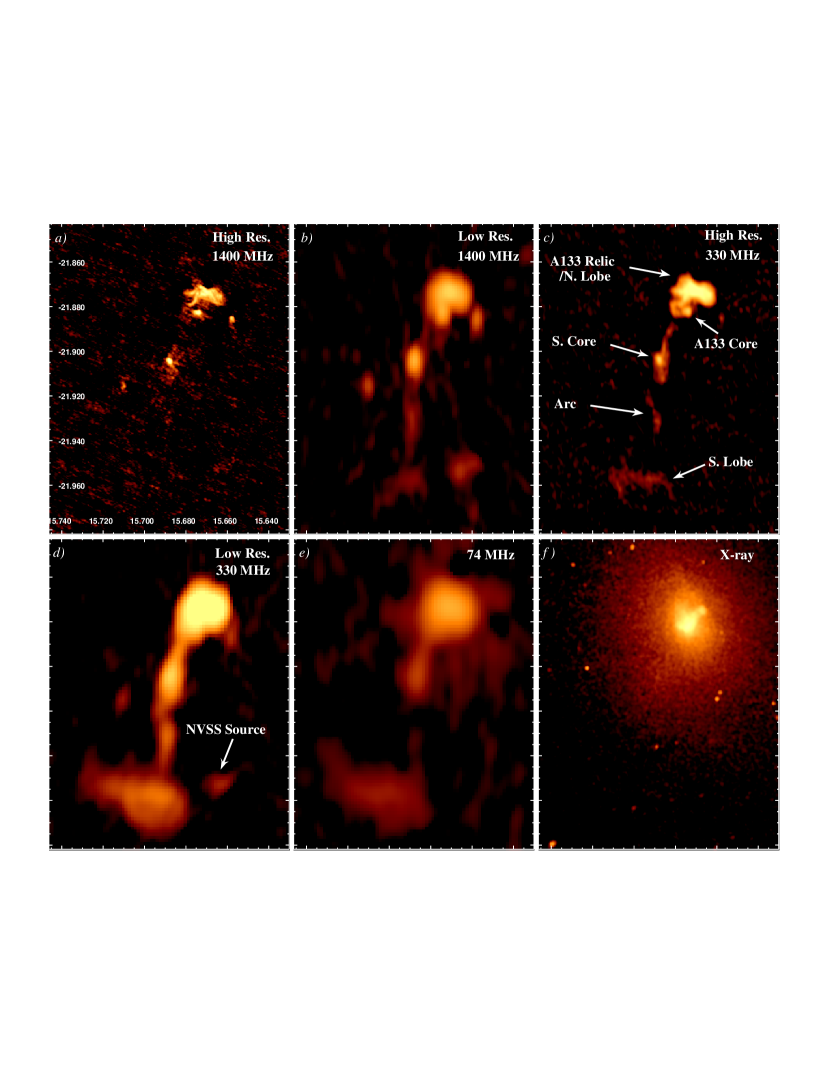
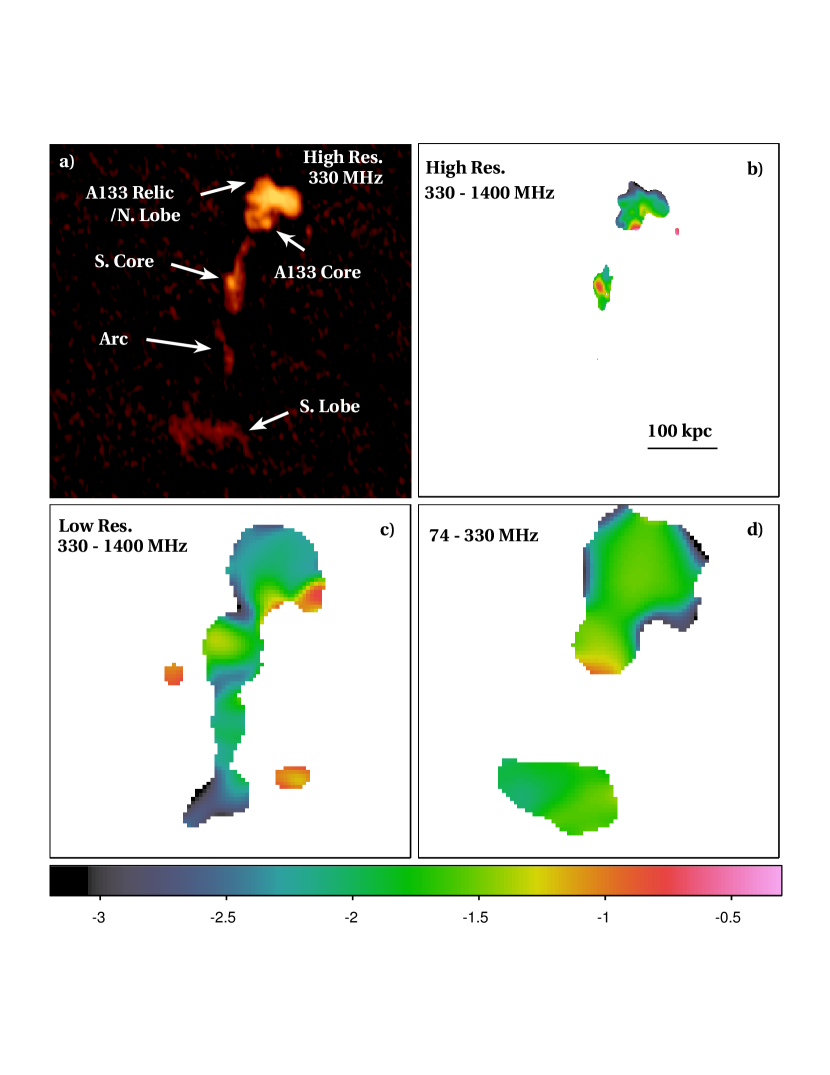
Radio images derived from VLA observations at multiple frequencies and array configurations are shown in Figure 5. The high-resolution 1.4 GHz image in Figure 5a (taken from S01) clearly shows the well-known diffuse radio source NVSS J010241-215230 just north of the core in Abell 133 (throughout this paper we will refer to this source as the “relic”, or sometimes the “northern lobe”, depending on context). The relic exhibits complex filamentary structure. The core source in Abell 133 is roughly 34″ (37 kpc) southeast of the relic. The position of the core matches the optical position of the cD galaxy. There is some extended emission associated with this core, in particular to the east, where there is a bright inner 6.7″ (7.2 kpc) extension connecting to a fainter loop feature that extends 24″ (26 kpc) from the core. Based on older 1400 MHz VLA observations (which we do not consider here), Rizza et al. (2000) claim to detect a bridge of emission connecting the relic with the cD galaxy. S01 argue that this claim is not supported by their more sensitive, higher-resolution VLA observations (shown in Figure 5a). Our 330 MHz A configuration image shown in Figure 5c does appear to show a connection between the cD and the relic, although the resolution is lower than in Figure 5a. Figure 5a also shows two other prominent core-like sources, one 54″ (59 kpc) west of the cD (which we we call the “western core”), with some extended emission to the south, and a second 1.53′ (100 kpc) southeast of the cD (which we will call the “southern core”), with some extended emission to the southwest. Both sources were noted by S01 (galaxies E and J, respectively, in their Figure 6), and, as they point out, optical identifications put the western source within the cluster (, Merrifield & Kent 2001), while southeastern source is at a much higher redshift (, Owen et al. 1995).
The lower frequency observations (and the lower-resolution 1400 MHz image shown in Figure 5b) reveal unexpected structure in the large-scale radio emission. The southern core shows two opposite extensions to the north and south (which we will call the “jets” of the southern core), with the northern jet extending to the relic in Abell 133 in Figures 5d,e. A diffuse southern lobe is revealed, roughly 3.2′ south of the southern core, somewhat larger than the distance to the relic in the north (2.2′). The lobe has a shell-like morphology in Figures 5b,c (low-resolution 1400 MHz and high-resolution 330 MHz images), but appears more uniform in Figures 5d,e (low-resolution 330 MHz and 74 MHz images). It is visible in Figure 10 of Bîrzan et al. 2008, although they do not discuss this feature. It is distinct from the source reported in the NRAO VLA Sky Survey (NVSS, Condon et al. 1998), NVSS J010239-215708, indicated in Figure 5d and also evident in Figure 5b (we note that the NVSS source is coincident with the position of the optically detected cluster APMCC 138 reported by Dalton et al. [1997] at , close to the redshift of Abell 133). The southern jet of the southern core points in the direction of the southern lobe, and connects to the lobe in Figures 5b,d. The jet shows multiple twists, turns, and bright spots, most evident in Figures 5c,d (the “arc” indicated in Figure 5c).
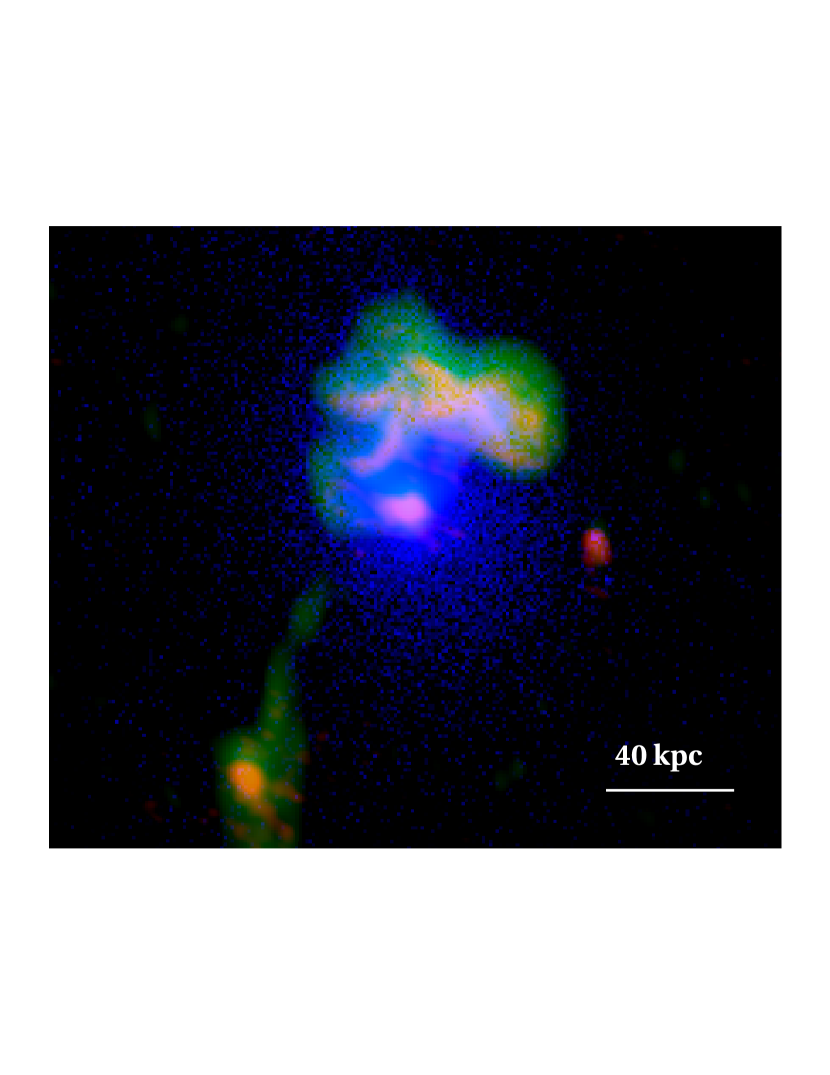
The large-scale morphology of the low frequency radio observations is consistent with what is expected for a double-lobed radio galaxy. If this is the case, the redshift of the optical source associated with the southern core () gives a total projected extent of 1.6 Mpc (6.2′), measured from the outer edge of the southern lobe to the outer edge of the northern lobe/relic. However, as pointed out by F02, the relic feature to the north is obviously associated with the X-ray core and plume in Abell 133. This is clearly seen in Figure 6, which shows the Chandra X-ray image (blue) overlaid with the 1400 MHz B configuration image (red) and 330 MHz A configuration (green). The plume is capped by radio emission, which overlaps the cavities discussed in § 3.1, and is brightest in the northern cavity. The bridge of emission between the high-redshift southern core and Abell 133 is also evident. The low frequency radio observations therefore reveal that the radio emission in the region of Abell 133 is a complicated combination of possibly overlapping foreground and background sources. We discuss these features further in § 6.4.2.
4. X-ray Spectra
The X-ray image (Figure 1) shows complicated structure in the core of Abell 133, as well as fainter ICM emission filling the FOV. We generated a temperature map as a guide for detailed spectral fitting to disentangle the various components and study the structure seen in the ICM. Spectra are grouped to a minimum of 40 counts per bin throughout.
4.1. Temperature Map
The temperature map was derived using the same method as developed in Randall et al. (2008). For each temperature map pixel, we extracted a spectrum from a circular region containing 1000 net counts (after subtracting the blank sky background). The resulting spectrum was fit in the 0.6 – 7.0 keV range with an absorbed apec model using xspec, with the abundance allowed to vary. Our detailed spectral fits indicate an absorbing column of about 1.8 times the Galactic value of cm-2, consistent with what was found by F02. We therefore fixed the hydrogen column density at cm-2, which we find from detailed fits to the diffuse emission within the central 1.86′ (121 kpc) presented in § 4.2. The resulting temperature map is shown in Figure 7. Faint regions had extraction radii on the order of 1.4′ (91 kpc), while the brightest regions, near the core, had radii of 5″ (5.4 kpc). Even with the coarse binning in the temperature map (9.8 arcsec2 pix-1) the “bird-like” morphology of the central core can be seen, with cool wings of emission to the northeast and southwest, on either side of the cooler plume extending to the northwest. There is a curling tail of cooler emission extending east of the core, which is not associated with the radio bridge to the southern core noted in § 3.2. Overall, the diffuse emission is patchy, with regions of cooler and hotter gas with statistically significant temperature differences. There is little large-scale structure in the map, expect perhaps on average higher temperatures in the southern half of the map as compared to the north.
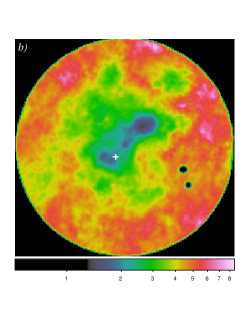
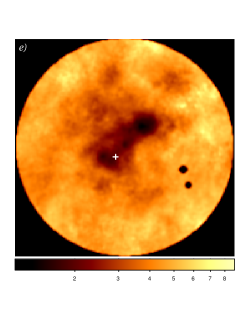
A higher-resolution temperature map of the core region is shown in Figure 8b. The extraction radii ranged from 3″ (3.3 kpc) in the core to 15″ (16.3 kpc) in the faint regions near the edge of the map. The white cross marks the optical position of the cD galaxy. The map reveals complex thermal structure in the core. The beginning of the eastern channel of cooler gas seen in the larger FOV temperature map shown in Figure 7 can be seen to the east. The plume is visible as an extension of cool gas with minima on the northern and southern tips, a cool central minimum, and some filamentary structure along the northeastern edge, which roughly coincides with the filamentary structure seen in the 1400 MHz radio observations (Figures 5a & 6). The coolest gas is at the northwest tip of the plume, although we show in § 4.2 that this is a projection effect, and that the gas in the southern tip is as cool or cooler. The southern minimum is offset from the cD galaxy, and contains two distinct “sub-minima” separated by about 6″ (6.5 kpc). The raw XMM-Newton Optical Monitor (XMM-OM) image, shown in Figure 8f, shows two similarly separated peaks, although at an offset position and position angle. The double peaks are also seen in 2MASS, GALEX, and less clearly in DSS images. The positions for the peaks match in XMM-OM, 2MASS, GALEX, and DSS images. The positions of Chandra point sources in the field match those from observations at other wavelengths, suggesting that the astrometry is sound. The temperature map is effectively smoothed due to the extended size of the extraction regions, but the regions are small near the core (3″ radii), and if the offset between the optical and cool gas peaks was due to smoothing inherent in the temperature map we would expect the gas peaks to be offset along the cool plume of emission, to the northwest, whereas the gas is offset southeast of the cD. We conclude that this offset is real, and is likely the result of a dynamical disruption of the core. We discuss this further in § 6.1.
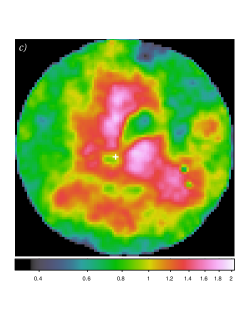
The projected abundance map is shown in Figure 8c. It was derived using the same method as the temperature map, but with 4000 net counts per extraction region, so that the abundances could be measured to within 5-10%. The regions with highest abundance are on either side of the plume, which has roughly half the abundance of the surrounding region. In § 4.2, we show that the apparent lower abundance in the plume is a projection effect, resulting from fitting a single temperature model emission from gas at a range of temperatures. Both the temperature and abundance maps show regions of rapid change, or ragged edges, surrounding the central plume at radii ranging from about 20 to 40 kpc. These features are examined in detail in § 4.3.
The projected pseudo-pressure and pseudo-entropy maps are shown in Figures 8d & 8e. The column density map was estimated using the square root of the 1.2-2.5 keV Chandra image, as in Forman et al. (2007). Combining this with the temperature map we compute the pseudo-pressure map as and the pseudo-entropy map as . The structure in the pseudo-entropy map is similar to what we see in the temperature map. The pseudo-pressure map shows an edge northwest of the cD galaxy, which coincides with the northern edge of the wing features in the X-ray image (compare the overlaid curve in Figures 8a & 8d). We discuss this edge further in § 6.3.
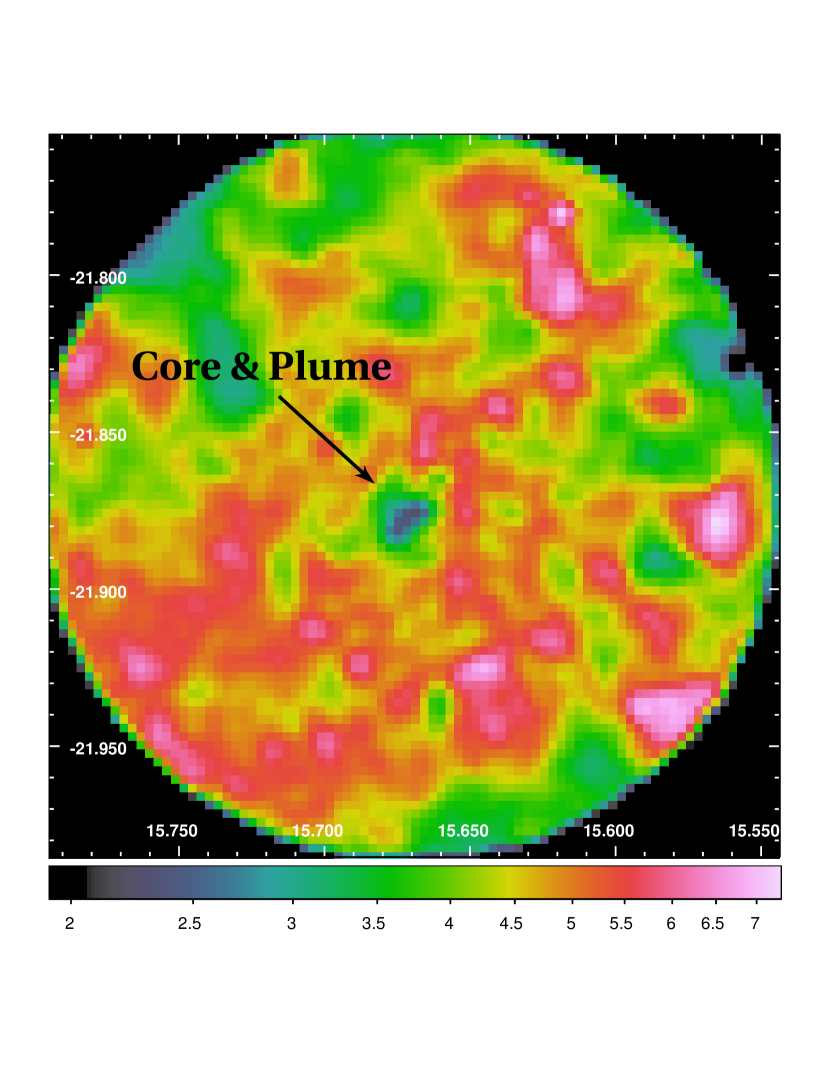
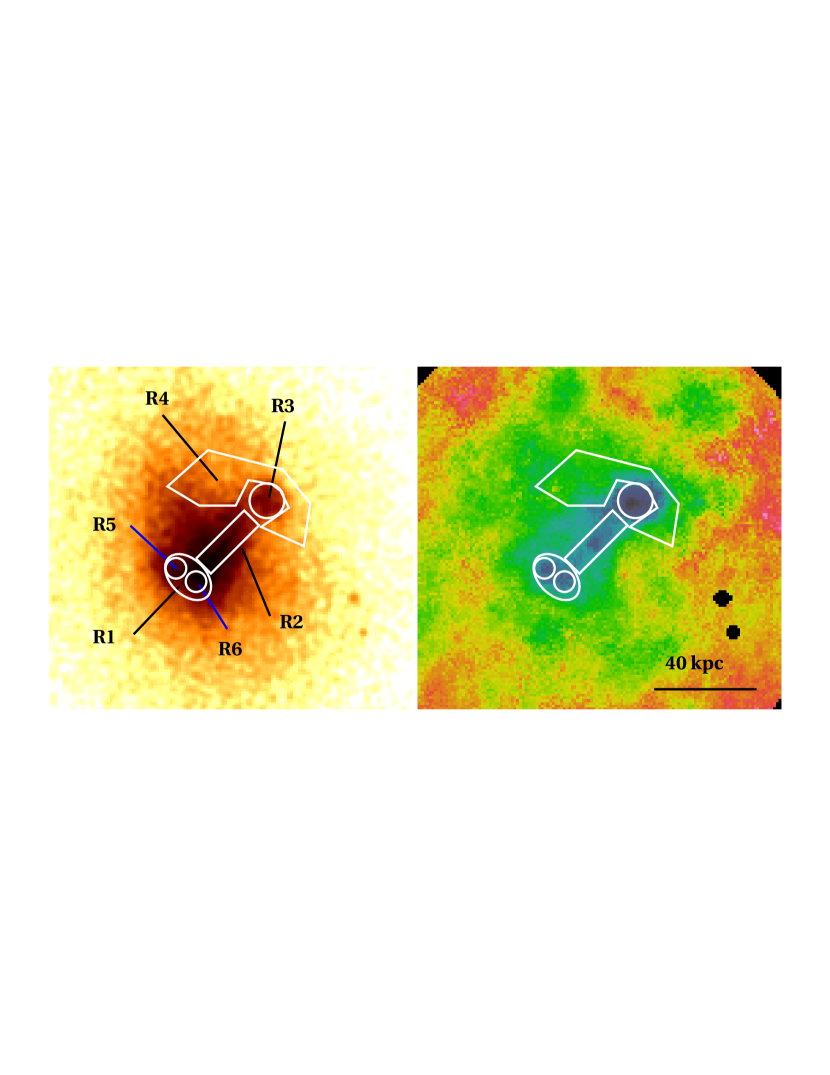
To look for large-scale temperature structure, we generated a coarsely binned (20″ pix-1) temperature map of the entire ACIS-I FOV from the most recent Chandra observation. The result is shown in Figure 10. The extended emission appears to be hotter on average in the south and southeast as compared to the north, consistent with Figure 7. There is a hot, 6 keV spot to the southwest, and a cool clump of gas extending to the edge of the chip to the north. These features are explored further in § 4.2.
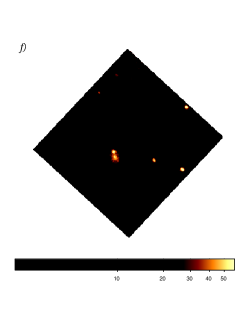
4.2. Detailed Spectra
Based on the derived temperature map and X-ray image of the core, we defined 6 regions for detailed spectral analysis of the core, shown overlaid on the X-ray image and temperature map in Figure 9. A summary of the fitted spectral models for each region is given in Table 3, along with a fit to the total diffuse emission within 1.9′ (121 kpc) of our adopted central position. Each region was fitted with either a two temperature apec model (with abundances tied) or an apec plus power-law model. In each case, the two component model was a significant improvement over a single thermal model. The fit to the total diffuse emission implies an absorption of cm-2, above the Galactic value of cm-2 derived from HI maps (Kalberla et al. 2005). This is consistent with what was found by F02. Such “absorption excesses” have been found from X-ray observations of other clusters (e.g., Pointecouteau et al. 2004). Since the absorption excess is likely due to variations in the Galactic absorbing column, which can vary across the field in a complicated way, we left the absorption free to vary in the fits in Table 3. We checked the impact of this freedom by redoing each fit with the absorption fixed at the value found from the fit to the total diffuse emission and at the Galactic value. In all cases the best fitting parameter values agreed well within the 1 confidence ranges, except for the abundance of the low temperature component for the fit to the total diffuse emission (which was 40% larger). We conclude that either fixing the absorbing column at a reasonable value or allowing it to vary does not significantly affect the fitting results in Table 3.
The fits to regions R1-R3 find a higher abundance than that indicated by the projected abundance map shown in Figure 8c. This is due to the two temperature thermal model, which effectively deprojects emission from the central core and plume. Fitting a multi-temperature spectrum with a single thermal model, as is done when generating the temperature map of the core, will generally give an abundance measurement that is lower than the true abundance of the gas, although the best-fitting temperature is expected to be within the range bounded by the lowest and highest temperature components (see Buote et al. 2000). Similarly, the detailed spectral fits show that the temperature of the cool gas in the southern peak (R1), near the cD galaxy, is consistent with the temperature of the gas in the “cap” of the plume (R3). This is in contrast to the temperature map shown in Figure 8b, which shows the coolest gas in the cap. This suggests that projection effects from hotter gas at larger radii is more significant for the southern peak than the northern cap.
4.2.1 X-ray Spectrum of the Radio Relic
The spectrum of the region containing the radio relic in the core of Abell 133 is of particular interest as we expect some non-thermal IC emission from the interaction between CMB photons and the synchrotron-emitting particles in the relic. Additionally, the relic may contain thermal gas that is so hot and tenuous that its X-ray emission is negligible, although it contributes significantly to the pressure support for the X-ray cavity (Bîrzan et al. 2008 find that, under the assumptions of equipartition and cavities devoid of X-ray emitting gas, the ratio of energy in protons to electrons must be several hundred to achieve pressure balance with the surrounding ICM). Region R4 roughly corresponds to the region of the radio relic shown in Figure 5, and to the relic region defined by F04. As shown in Table 3, the two temperature and temperature plus power-law models both provide an improved fit over the single temperature model. For the two temperature model, the higher temperature could not be significantly constrained. However, if we assume that the hot gas is contained within the radio relic, we can place an upper limit on its temperature by requiring that the thermal pressure be less than the local thermal pressure outside of the relic. Assuming an oblate spheroidal geometry for the relic with the minor axis in the plane of the sky, and taking the external pressure from the deprojected profiles presented in § 4.3, the lower limit on the normalization of the high temperature component suggests an upper limit of keV. For the thermal plus power-law model, using the best-fit photon index, we find a 0.3-10 keV flux from the power-law component of ergs cm-2 s-1 with an upper limit of ergs cm-2 s-1, which is lower than the previous tightest constraint of ergs cm-2 s-1 derived by F04 from XMM-Newton observations. We note that the best-fitting photon index is relatively flat, and inconsistent with the steep indices found in this region from the radio observations (see § 5.2). If this component represented a detection of IC emission from the radio emitting particles we would expect the indices to be roughly equal. However, although the 1 confidence intervals do not overlap the radio and X-ray indices agree within the 90% confidence intervals (although with large uncertainties on the X-ray index). We conclude that statistically we cannot distinguish between a high temperature thermal model and a non-thermal model for the second component in the region of the relic. Although the flat spectral index argues against this component arising solely from IC emission from the radio-emitting particles, the errors are large, and the X-ray and radio slopes are plausibly consistent.
4.2.2 The Double Core
As noted in § 4.1, Figure 8b reveals two distinct temperature minima within the core. The double-peaked nature of the core is also evident in several other observations at other wavelengths, although the cool gas peaks are slightly offset to the southeast. The multiple peaks may represent an early stage galaxy-galaxy merger within the cD galaxy. To determine whether the gas in each peak has a common origin, we fit spectra extracted from each region (R5 and R6 in Table 3). The temperatures are the same, and although the best-fitting abundance value is substantially higher in the northeastern minimum, they are in agreement within the (large) errors. Assuming a spherical geometry for each region and calculating the entropy as
| (1) |
we find that in region R5 keV cm2 and for R6 keV cm2 (errors are statistical only, and do not include uncertainties due to assumptions about geometry, etc.). Although the entropy of the gas in the optically brighter, southwestern minimum is substantially lower, the values are consistent within the errors. We conclude that, although the abundance and entropy measurements are suggestive, we cannot unambiguously identify these structures as originating from distinct systems.
4.2.3 Thermal Structure of the Wings and Plume
F04 find evidence for a temperature gradient along the plume, such that the temperature decreases from the core in the southeast to the cap in the northwest. They interpret this as support for their model where the wing features shown in Figure 2 are the result of a merger shock propagating through the cool core from the southeast to the northwest. The front is distorted as it passes through the denser gas in the core, giving it a curved appearance. Our spectral fits to R1, R2, and R3 show no evidence for temperature differences. To further test for changes in temperature along the plume, we split the plume into 7 contiguous regions, including the core and northern cap, each containing about 2000 net counts. Each region was fitted with a two temperature model, with abundances tied and fixed at 1.3 times solar and the higher temperature fixed at 2.3 keV, consistent with results from the fits to R1-R3 in Table 3. The absorbing column density was fixed at cm-2. We find no evidence for systematic temperature variations along the plume. All regions are consistent with a lower temperature of 1.1 keV within 3, and most are consistent with this temperature to within 1.
F04 also find marginal evidence for a temperature jump across the edge defined by the wing features (indicated by the white dashed line in Figure 8), consistent with a shock passing through the core from the southeast. This result relies on fitting a two temperature model and fixing the abundances and temperature of the hotter component. Their single temperature models show no temperature jump across the edge (see their Table 4). To test this result with the new Chandra data, we defined regions corresponding to those shown in F04 (their Figure 12). The results from fits to these regions are given in Table 4, where we have adopted the labels from F04 of WU, WD, NU, and ND (west upstream, west downstream, etc., where “upstream” and “downstream” refer to the position relative to the putative shock front). For the Chandra data we consider here, we have sufficient counts in each region to fit two temperature models in each region, and therefore directly measure projection effects. We do not reproduce the temperature rise in the upstream region reported by F04, and in fact find the upstream region to be cooler in the northeastern wing. We discuss this discrepancy further in § 6.3.
4.2.4 Thermal Structure of the Extended ICM
As with the core region, we followed up features seen in the large FOV temperature map shown in Figure 10 with detailed spectral analysis. The map shows a cool clump of gas 8.7′ (564 kpc) to the northeast, a hot spot 7.2′ (468 kpc) to the southwest, and a large hot trail of emission south of the core. We defined four regions (labeled in Figure 10), one each for the hot spot and northern clump, and, since the northeast and southwest are contaminated by the clump and the hot spot, one each for the southeast and northwest corners to test for temperature asymmetries. The results are shown in Table 5. Since the features in question are in relatively faint regions, we checked the impact of systematic uncertainties in the background by varying the background normalization by % and re-fitting the spectra. In no case were the results significantly affected, with the best fitting values agreeing well within the 1 confidence ranges.
The northwestern and southeastern corners are well described by single temperature models with temperatures of 4.1 keV and 4.6 keV respectively (adding a second thermal or power-law component did not improve the fit in either case). The detailed fits support the impression from the temperature map that the emission is hotter to the south, with the temperature difference significant at 2.5. The northern clump is also well-described by a single thermal model at a much lower temperature of 2.3 keV. Adding a second thermal component did not improve the fit, suggesting that the contribution from the projected hot ICM is negligible.
The hot spot to the southwest is reasonably well-described by a single temperature model with keV. If a second thermal or power-law component is included the fit is slightly improved, as measured by the chi-squared per degree-of-freedom, , with the null hypothesis probability increasing from 30% to 45%. In both cases the lower temperature component is roughly 2.5 keV. In the case of the two temperature model, the higher temperature is only very poorly constrained, with keV. Both models describe the data equally well, and we cannot discriminate between them.
As a check on these results, we extracted spectra from each of the regions shown in Figure 10 from the XMM-Newton observations presented in F04. We find temperatures of , , , and . Thus, we confirm results from the Chandra measurements (Table 5), with the emission in the southeast being somewhat hotter than the emission in the northwest by about 10% (at 1.5 significance), and the northern clump being cooler than both (at 1.6 significance). However, we do not confirm the higher temperature of the hot spot found from Chandra observations. Additionally, the measured XMM-Newton temperatures are significantly lower than the Chandra temperatures for the same regions (Table 5). This latter result may be due to cross-calibration issues (although our temperature measurements from Chandra and XMM-Newton agree well in the region of the bright core), or it may be due to contamination from the bright cool core (which has temperatures in the 2–3 keV range) as a result of XMM-Newton’s relatively large PSF. The fact that the hot spot is not detected in the XMM-Newton data may also be a result of the large PSF, with scattered emission from brighter, cooler regions swamping the emission from the hotter (possibly non-thermal) component. However, it is possible that the high Chandra temperature of the hot spot is a spurious result, possibly due to systematic uncertainty related to the background or instrumental calibration. Thus, we conclude that, while the measured temperature differences are only marginally significant, the results from XMM-Newton support the results from Chandra on the relative temperatures of the northwestern and southeastern corners and the northern cool clump. We do not find evidence for the southwestern hot spot in the XMM-Newton data.
4.3. Deprojected Profiles
In this section, we consider the average radial temperature, abundance, and density profiles of the gas in Abell 133. Accurate deprojected profiles out to large radii have already been given by Vikhlinin et al. (2005) using ROSAT and the earlier Chandra data. We therefore only consider the combined Chandra data here, with the focus on detecting structure in the central regions, which may gives clues as to the dynamical state of Abell 133.
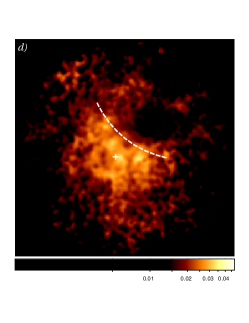
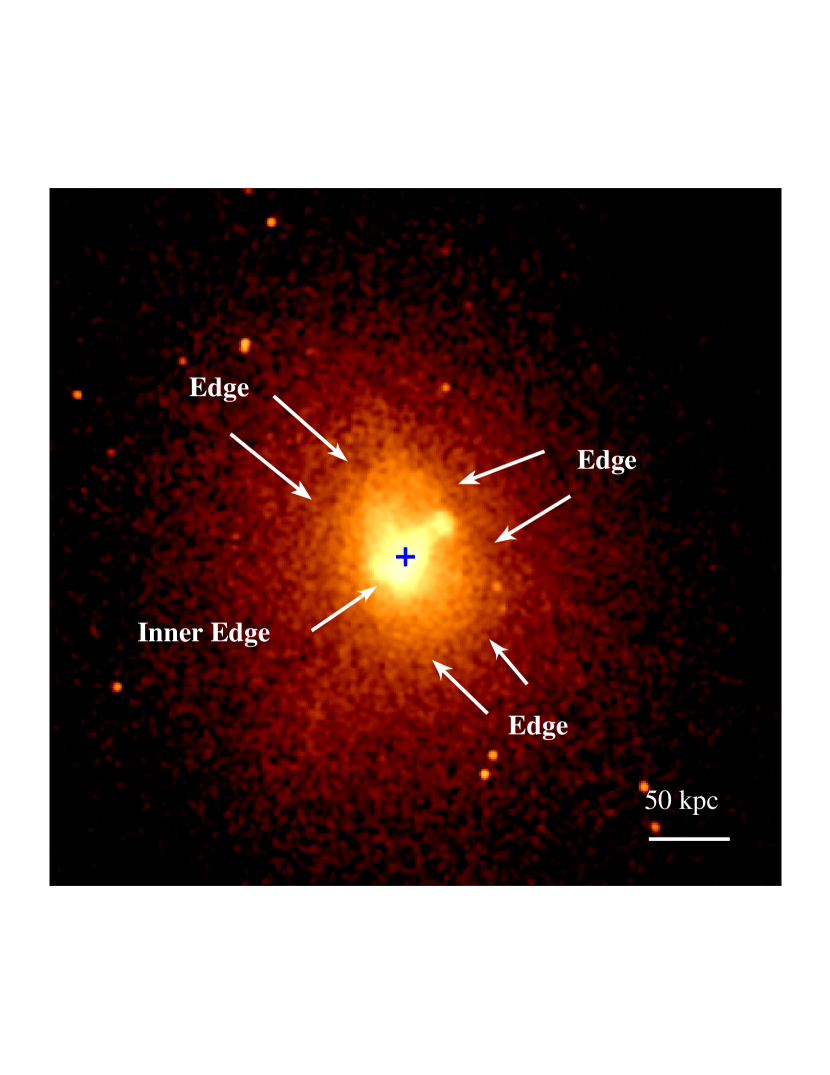
Figure 11 shows a smoothed Chandra image of the core, with smoothing and scaling chosen to highlight structure in the diffuse emission. The innermost cool gas, which makes up the core and the plume, is sharply contrasted with the surrounding gas, particularly to the southeast, where there is a prominent edge feature. Additionally, there is an outer elliptical edge which completely encompasses the central core. This corresponds to the edge detected in the southeast by F02, with the deeper Chandra observation revealing its full annular extent. To the northwest, the edge lies just beyond the tip of the plume. Our adopted center for radial profiles, indicated by the blue cross in Figure 11, is roughly at the center of the outer elliptical edge. The outer edge roughly corresponds with the edges in the temperature and abundance maps (Figures 8b,c) noted above.
To quantitatively study these edges, we extracted the 0.6-5.0 keV surface brightness profile in elliptical annuli, centered on the blue cross in Figure 11. Each annulus had an axial ratio of , where and are the semi-major and -minor axes, respectively, and a major axis position angle of 20∘ from north, which roughly corresponds to the shape of the edge feature indicated in Figure 11. The sector covering the plume feature, between 285-352∘ measured east from north, was excluded.
The resulting integrated emission measure profile is shown in Figure 12. The profile has a power law shape, with discontinuous jumps at roughly 20 and 30 kpc (where distance is measured along the minor axis of the ellipse, such that the jumps are at 28 and 42 kpc along the major axis). Following our previous work, we fit the profile by projecting a 3 dimensional density profile consisting of three power laws, connected with two discontinuous breaks, or “jumps”. The free parameters were the normalization, the inner (), middle (), and outer () power law slopes, the position of the density discontinuities ( and ), and the amplitude of the jumps ( and ). A prolate spheroidal geometry was assumed, with the major axis in the plane of the sky. The best-fitting model is shown as the solid line in Figure 12, with the fitted break radii indicated by the vertical dashed lines. The model provides an acceptable fit, with . This is a significant improvement over the fit from a single power law model, which gave . The best-fitting parameters (with 90% confidence intervals) were , , , kpc, , , and . The fitted model therefore confirms the presence of small, but statistically significant, density jumps at roughly 19 and 32 kpc along the minor axis of the elliptical extraction region, coincident with the surface brightness edges indicated in Figure 11.
We also extracted deprojected density, temperature, and abundance profiles using the “onion peeling” method employed, e.g., by Blanton et al. 2003. First, the projected temperature, abundance, and xspec normalization are determined by fitting an absorbed apec model to the outermost annulus. Fits to spectra from annuli at smaller radii are then determined by adding an additional component for each outer annulus, with fixed temperature and abundance, and a normalization scaled to project from the outer to the inner annulus. We note that this procedure misrepresents the errors, since the contributions from outer shells are fixed. The absorbing column density was fixed at cm-2. As above, a prolate spheroidal geometry was assumed, using annuli with the same axial ratio and position angle as those used to extract the emission measure profile shown in Figure 12 (again, the sector containing the plume was excluded).
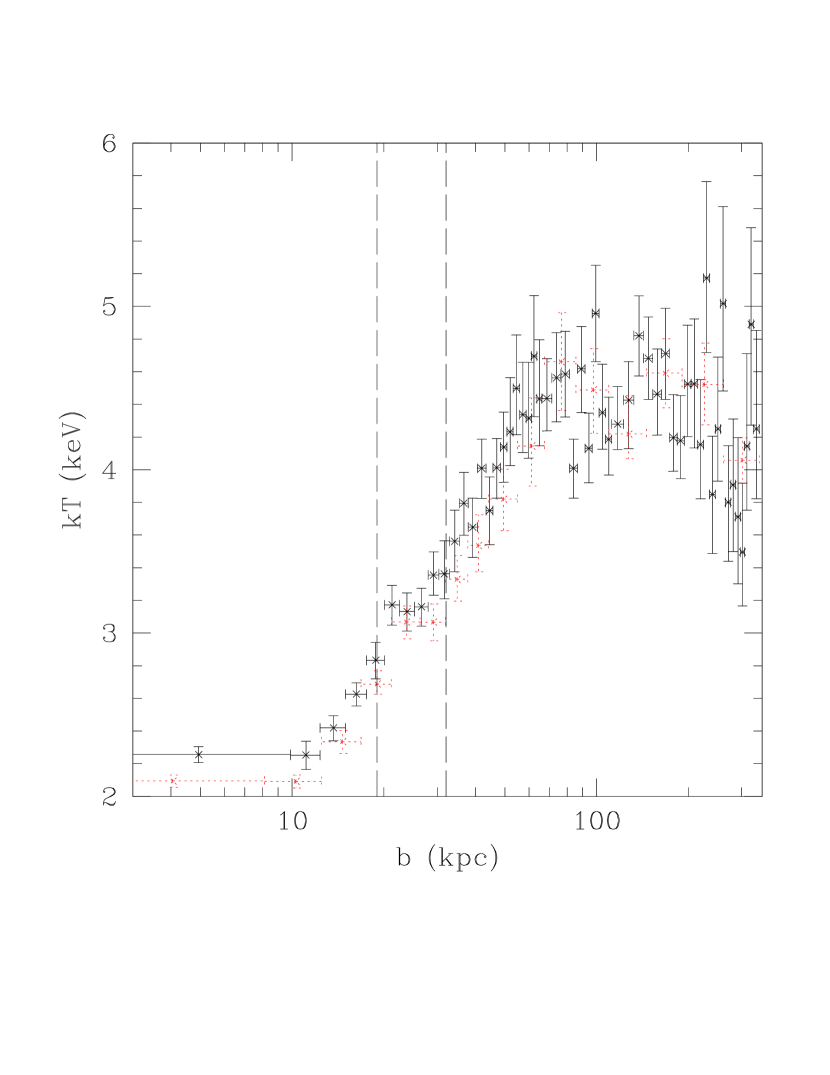
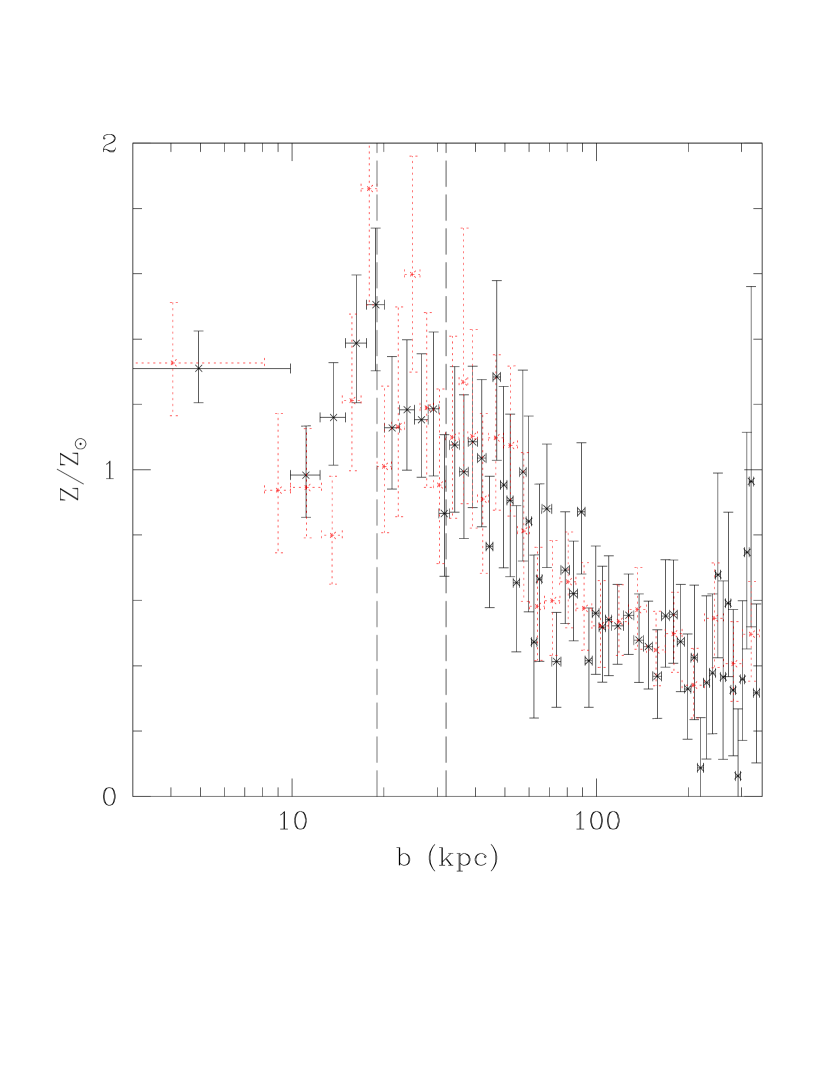
The resulting deprojected electron density profile is shown in Figure 13. The dashed lines indicate the best fitting break radii derived above from the emission measure profile. The profile is consistent with small jumps in the vicinity of the break radii, although the inner jump is offset by a few kpc (i.e., a few arc-seconds). The deprojected temperature profile (dotted lines) is plotted along side the projected temperature profile (solid lines) in Figure 14. Both temperature profiles show a rapid increase across the inner edge and a leveling off just outside the edge, from 2.69 to 3.07 keV in the deprojected profile. The deprojected temperature profile is consistent with a similar temperature jump across the outer edge, from 3.07 to 3.33 keV. Finally, the projected and deprojected abundance profile is shown in Figure 15. The deprojected profile indicates a decrease in abundance across the inner edge, with no obvious jump across the outer edge. The inner abundance edge is qualitatively similar to edges seen in M87 reported by Simionescu et al. 2007, who conclude that they may indicate bulk, or, in the case of M87, oscillating motion of the central cD galaxy with respect to the ambient ICM. From the temperature and abundance jump across the inner edge, we conclude that this feature represents the interface between the cool, metal-rich gas associated with the central cD galaxy and the hotter surrounding gas. The outer edge has characteristics of a cold front, now commonly seen in galaxy clusters, where a temperature increase across a surface brightness edge is accompanied by a corresponding density decrease, such that the pressure profile is continuous across the edge (see Markevitch & Vikhlinin 2007 for a review), although, as seen in Figure 8b, the structure of the edge is ragged and somewhat complicated, unlike the smooth edges seen in other systems. This feature may represent a sloshing cold front, as seen in simulations (Ascasibar & Markevitch 2006) and observations of other systems (Mazzotta et al. 2001; Dupke et al. 2007; Gastaldello et al. 2009; Randall et al. 2009), possibly disrupted by the activity associated with the radio relic (resulting in the formation of the plume and the X-ray cavities) and viewed at an angle such that the oscillatory motion is not close to the plane of the sky. We discuss this feature in the context of the dynamical state of Abell 133 further in § 6.1.
5. Radio Spectra
5.1. Spectral Index Maps
Using the radio observations at multiple frequencies, we constructed 2D spectral index maps of the features seen in Figure 5. The radio spectral index relates the integrated brightness and frequency by
| (2) |
To study the low frequency spectral index structure we have cut the UV coverage to be matching for the A configuration 74 MHz and B configuration 330 MHz data sets. After re-imaging with the new UV ranges, we convolved the (similar resolution) 74 and 330 MHz images to a circular beam of = 42″. Finally, the two input maps were blanked at the 5 level on each map prior to constructing the spectral index map of the target. In addition to the spectral index map, we have calculated an error map based on the statistical noise in the images. We account for calibration errors in calculating the final error on the spectral index by including an uncertainty of 6% on the flux calibration of the 74 MHz data (Cohen et al. 2004) and a 3% calibration error on the 330 MHz data (Lane et al. 2004). We use similar techniques to those described above to obtain spectral index maps between 330 and 1400 MHz for both the high and lower resolution data sets.
The resulting spectral index maps are shown in Figure 16. The structure of the maps support the impressions given by the radio brightness maps presented in § 3.2: the structure to the north consists of a relatively flat () core adjacent to a steep () diffuse source, which has previously been classified as a radio relic (S01). The southern core is also found to be flat, with two steeper jets extending to the north and south. In Figure 16c we see that the global structure is consistent with what would be expected from a double-lobed radio source: a flat core (the southern core labeled in Figure 16a) with two jets that steepen with distance and terminate in lobes. The northern lobe is coincident with the radio relic in the core of Abell 133, while the southern lobe is steeper in the west where it connects to the jet (we verified that this gradient is not due to contamination from the nearby NVSS source). The spectral maps are therefore consistent with the interpretation suggested in § 3.2, where emission from a distant, background radio galaxy associated with the southern core overlaps emission from the radio relic in Abell 133.
5.2. Integrated Spectral Index of Individual Features
In addition to the spectral maps, we calculated the average integrated spectral index and measured fluxes for some of the main features. The results are given in Table 6. Our flux and spectral index measurements for the relic/northern lobe in Abell 133 are consistent with results given by Bîrzan et al. (2008). Both the southern core and the core source in the Abell 133 cD galaxy have relatively steep spectra for cores, with indices . This suggests either that each source is a “dying” core, or, more likely, that contamination from nearby diffuse emission is steepening the indices. The spectral index maps seem to support contamination: for example in the 330 – 1400 MHz map in the region of the southern core, the indices get as flat as -0.8, and for the Abell 133 core they reach -0.4. These peak values are slightly offset from the cores in a direction opposite from the brightest diffuse emission, suggesting that the diffuse emission contaminates the spectral index measurements at the location of the cores but has a smaller effect on the side of the core where the diffuse emission is fainter. The measurements of the southern core, its jets, and the arc show the spectral index steepening with distance, although these regions may suffer from missing flux at 1.4 GHz and are therefore artificially steep.
6. Discussion
6.1. The Dynamical State of Abell 133
It is clear that Abell 133 has been dynamically disturbed. At smaller radii, the surface brightness map shows an elliptical edge surrounding the core between 30-50 kpc (Figure 11), which is roughly aligned with the ellipticity at larger radii. The temperature map (Figure 8b), temperature profile (Figure 14), and density profile (Figure 13) show evidence for modest jumps at the location of the edge. The edge is well-described by a spheroidal discontinuous power-law density model, with a density jump of about 1.18 (§ 4.3), consistent with what is expected from gas sloshing in the core due to interactions with a merging subgroup. The temperature map of the core (Figure 8b) shows two distinct temperature minima within the central cD galaxy, indicative of some small-scale dynamical process (possibly a galaxy-galaxy merger). Similar double peaks are seen in optical, UV, and NIR images, although the position and rotation angle of the X-ray minima are offset from these features. This offset also suggests a dynamical process acting on the gas, such as gas sloshing or stripping, where the cool diffuse gas clouds have been displaced from the potential minima of their respective galaxies, while the collisionless stars remain undisturbed. Thus, although the evidence for gas sloshing from the X-ray edges alone is not as conclusive as seen in some other systems (e.g., NGC 5098, Randall et al. 2009), we conclude that there is strong evidence that Abell 133 has been dynamically disturbed by an interloping subgroup, and we suggest that the elliptical edge in the surface brightness map is a gas sloshing edge, seen in simulations and in other galaxy groups and clusters, possibly viewed at a high angle of inclination such that the plane of the sloshing motion is not close to the plane of the sky, leading to the somewhat ragged appearance of the edge.
Since gas sloshing requires a relatively massive perturber, we looked for evidence of substructure in Abell 133. The RASS contours shown in Figure 1 indicate a peak roughly 10.6′ (690 kpc) southwest of Abell 133. This peak is outside the FOV of the Chandra images. The XMM-Newton data reveal a bright source at this location, with a spectrum that is reasonably well-described by a power-law (with photon index and ), and poorly described by an apec model (with ). This source is therefore likely an AGN. Thus, we see no evidence for a nearby subcluster in the available X-ray data.
Using optical data and redshift measurements, Way et al. (1997) find evidence for substructure in Abell 133, including an associated subgroup to the southwest, and conclude that Abell 133 is likely “dynamically young”. Using a 2D wavelet analysis technique, Flin & Krywult (2006) find evidence for three distinct substructures within 1.5 Mpc of the cluster center, all roughly along the major axis of the elliptical X-ray brightness contours of Abell 133, at 1970 kpc and 550 kpc from the X-ray core (we note that their adopted cluster center for Abell 133 corresponds roughly to the southwestern source seen in the ROSAT image, which is why it is possible for the separation from the X-ray center to be larger than their maximum 1.5 Mpc search radius). Finally, Dalton et al. (1997) report an optically selected galaxy cluster at the position of the NVSS source indicated in Figure 5d at , which is close to the redshift of Abell 133 () and likely an associated subcluster.
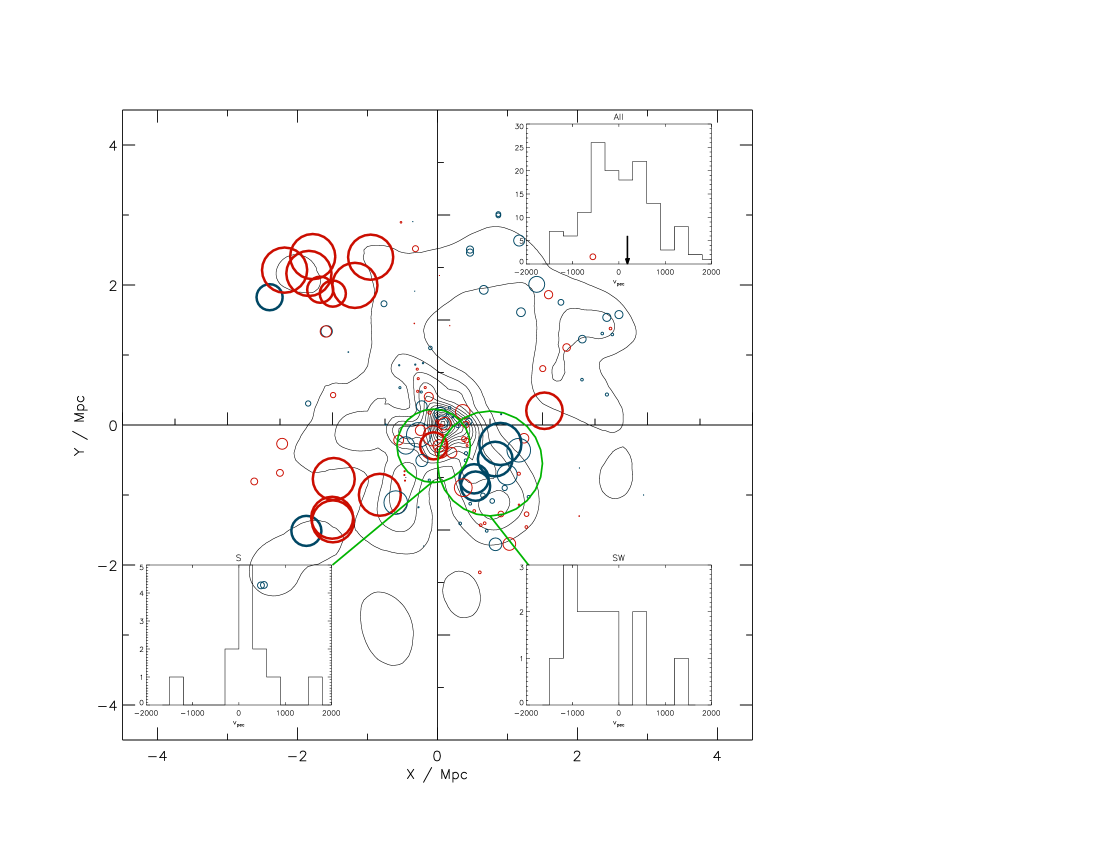
As a further check for evidence of substructure, we performed our own 3D substructure test, using published galaxy positions and redshifts and a technique based on Kolmogorov-Smirnov (K-S) likelihood analysis that we have employed previously (e.g., Owers et al. 2009). For our sample, we used all galaxies within 3.5 Mpc with redshifts given in the NASA/IPAC Extragalactic Database (NED), plus those given in Way et al. (1997). The “bubble” plot for the resulting 138 galaxies is shown in Figure 17. In this plot, each circle has a radius
| (3) |
where is the probability (measured using the K-S likelihood) that the peculiar velocity distribution of the nearest neighbors to the galaxy is the same as the global velocity distribution (where is the total number of galaxies in the sample). Blue/red circles have negative/positive peculiar velocities relative to the cluster redshift, and bold circles occurred less than 10% of the time in 5000 Monte Carlo simulations. The total k-statistic, which is a measure of substructure in the cluster, is given by the sum of for the entire sample. We find that the total k-statistic measured is not significant, and is in fact only 0.03 from the mean of the distribution produced by 5000 Monte Carlo realizations, where the velocities are randomly shuffled between galaxies. Overlaid are galaxy density contours selected from the SuperCOSMOS survey (Hambly et al. 2001). Cluster members were selected by requiring that they lie within mag of the red-sequence to a limiting magnitude of . The red-sequence was defined by matching the spectroscopically confirmed cluster members with the SuperCOSMOS data and fitting the red-sequence with a straight line. There were 792 galaxies that met this criteria.
Despite the insignificant total k-statistic found from the bubble plot analysis, Figure 17 shows a concentration of blue circles to the southwest (4 of which occurred less than 10% of the time in the Monte Carlo simulations) that is roughly coincident with the substructure detected by Flin & Krywult (2006) and a peak in the overlaid galaxy density contours. Furthermore, there appears to be a similar excess of red-shifted galaxies kpc south of Abell 133. The velocity histograms for all 138 galaxies, as well as those for the southwestern and southern excesses seen in the bubble plot, are shown in Figure 17. To confirm the peculiar velocity of the cD galaxy with respect to the cluster mean, we calculated the as in Way et al.(1997) with our (slightly) larger sample. We find , with a value less than zero (which would indicate a cD velocity consistent with the cluster mean) occurring only 26 times in 10,000 bootstrap re-samplings. This is essentially the same result found by Way et al. (1997), confirming that the cD has a high peculiar velocity, as expected in a sloshing scenario (Ascasibar & Markevitch 2006). Thus, although the “bubble” plot test is inconclusive, results from previous studies argue for the presence of substructure in the cluster, with potential subgroups kpc and kpc south/southwest of the cluster center, consistent with the major axis of the elliptical X-ray isophotes, thus providing perturber candidates to explain the dynamical disturbance of Abell 133.
We can estimate the time since core passage for a perturbing subcluster using the total mass profile for Abell 133 derived by Vikhlinin et al. (2006). They find that the density profile is well described by a NFW profile (Navarro et al. 1996, 1997) with kpc, and that the total mass within 500 times the critical density at the cluster redshift is . Therefore, for a test particle starting at rest from a turn-around radius of 3.6 Mpc (with a small impact parameter), the time since core passage for a current separation of 600 kpc (300 kpc) is yr ( yr). This is a lower limit for the observed subclusters since they need not necessarily move in the plane of the sky, and the true separation is likely to be larger than the projected separation. Given the lower limit on the age of the radio relic from Bîrzan et al. (2008) of yr, it is plausible that one of the subclusters passed by the core during the lifetime of the relic, affecting its morphology. We discuss the implications of this scenario for the radio relic in § 6.4.
The large FOV temperature map (Figure 10) and the detailed spectral fits presented in Table 5 also show some evidence for merger activity. The elongated cool clump of gas to the north, which is significantly cooler than the ambient ICM at similar radii, may be the remnant of material that has been stripped from a merging subcluster as it passed from the northeast to the southwest. The orientation is consistent with the orientation of the elliptical X-ray isophotes in the diffuse emission (Figure 1). Furthermore, the hot trail of gas south of the cluster is similar to what would be expected if a subcluster passed through this region, shock heating the gas as it passed from the east, then south of the core. This is consistent with the structure of the inner X-ray surface brightness edges shown in Figure 11, in that the sharpest edge is to the southeast, as would be expected from gas sloshing if the perturber passed southeast of the core (see Ascasibar & Markevitch 2006). We note that the interpretation of the cool clump to the north as stripped gas from a subcluster and the hot trail to the south as shock heated ICM gas from the passage of the subcluster are not necessarily inconsistent, since the orbit of the subcluster may be curved as projected onto the plane of the sky (although one might expect the elongation axis of the cool clump to point more to the south in such a unified model). Finally, the hot spot to the southwest is equally well-described by a two temperature model with a poorly constrained high-temperature component at keV, or a thermal plus power-law model. Either of these are consistent with a shock in this region, where the second component either detects shock heated gas or inverse Compton (IC) emission from shock-accelerated particles. However, the presence of this hot spot is not confirmed by XMM-Newton, and while this may be due to contamination by scattered light from bright, cooler regions due to XMM-Newton’s large PSF we consider the Chandra detection of the hot spot to be a marginal result.
From the combined evidence above, we propose a model where a merging subcluster has passed from the northeast to the southwest of the core, possibly leaving behind stripped gas to the northeast and shock heating the ICM south of the core. The merger has elongated the X-ray isophotes at large radii in the northeast-southwest direction. The subcluster passed in front of or behind the core, initiating sloshing in the central gas in a plane at some inclination angle with respect to the plane of the sky. Since the putative spiral of sloshed gas is viewed from the side, it has an elliptical appearance with ragged edges. Optical observations indicate a subcluster roughly 600 kpc southwest of the core, which seems a plausible candidate for the merging subcluster (a second optically selected subcluster 300 kpc south of Abell 133 is also a viable perturber candidate, although it is located too far to the east to explain the western hot spot shown in Figure 10 as shock heated gas).
6.2. The X-ray Plume
F02 consider four possibilities for the formation of the X-ray plume indicated in Figure 2: (1) a cooling wake, where hot ICM gas is attracted into the wake of the moving cD galaxy and cools, (2) convective lift initiated by the displacement of core gas due to ram pressure stripping by a merging subcluster, (3) disruption of the cold front (which they detect to the southeast) due to Kelvin-Helmholtz instabilities, and (4) gas lifted by a buoyant bubble, in this case the radio relic in Abell 133. Based on arguments presented in F02 and F04, they conclude that the plume has most likely been formed due to uplifted gas by a buoyant bubble. Examples of cool gas plumes capped, and presumably uplifted by, mushroom-cap shaped radio bubbles are seen in other systems (e.g., M87, Forman et al. 2007; NGC 5813, Randall et al. 2010) and reproduced in numerical simulations (Churazov et al. 2001). In this scenario, the gas in the plume was once co-spatial with the gas in the core. If this is the case, we would expect the entropy in the core and in the tip of the plume to be similar, assuming that the plume gas has not conducted heat from or become mixed with the ambient ICM. We therefore calculated the entropy for regions R1 and R3 (indicated in Figure 9) using results from the two-temperature fits presented in Table 3 and assuming a spherical geometry for R3 and a prolate spheroidal geometry for R1, with the major axis in the plane of the sky. We find very similar entropy for each region, with keV cm2 and keV cm2, supporting the idea that the gas has been uplifted (however, not only are the statistical errors large, but there are additional systematic errors from the assumptions about the geometry, so this result is not conclusive).
As noted by F02, one concern is whether the bubble would be able to uplift the mass of gas in the plume and remain buoyant. Roughly, we expect this to be the case if the mass of gas displaced by the bubble is greater than the mass of entrained gas. Assuming a spherical geometry for the tip of the plume and a cylindrical geometry for the plume (R3 and R2 in Figure 9), we find densities and masses in these regions of cm-3, , cm-3, and . The total mass of the plume is therefore , which is consistent with the estimate given by F02 of . Taking the average ICM density at the location of the relic from Figure 13, and assuming an oblate spheroidal geometry for the relic, with the minor axis in the plane of the sky, we find that the mass of gas displaced by the bubble is approximately , more than 6 times the gas mass in the plume. As a check on this result, we did the same test with the eastern filament and eastern ear-shaped radio lobe in M87 (Forman et al. 2007). In the case of M87, we find and , so that the displaced gas mass is roughly 3.5 times the mass in the plume, on the order of what we see in Abell 133 where a very similar process seems to be at work. We conclude that, in principle, the bubble is capable of buoyantly lifting the cool gas in the plume, and that this is formation mechanism of the plume is fully consistent with the observations and with the conclusions of F04.
Another possibility is that the plume was formed by the gas sloshing in the core. Consider Figure 7 in Markevitch & Ascasibar (2006), which shows the time evolution of merger induced gas sloshing. At 1.9 Gyr, a cool plume feature forms, which, if viewed from the right or left (within the merger plane) would look similar to the structure seen in Abell 133. In this interpretation, the cool spot at the tip of the plume corresponds to the end of the spiral trail of the innermost cool gas in the simulations, and is extended along the line of sight. The radio relic could have formed at the core prior to the onset of sloshing, and subsequently dragged along by the sloshing motions of the gas, and thus appears to be at the tip of the plume. This requires that the perturber passed from the northwest to the southeast of the cluster (in projection), on a trajectory perpendicular to that in our model proposed to explain the elliptical cold front edge. In this scenario, the southeastern subcluster reported by Dalton et al. (1997) provides a possible perturber candidate. Although this model is plausible, it is difficult to test without detailed hydrodynamic simulations, which are beyond the scope of this paper.
6.3. The X-ray Wings
F04 argue that the formation of the X-ray wings, indicated in Figure 2, is due to a weak merger shock passing through the cool core from the southeast and disrupting it. Their interpretation is based on a detection of a thermal gradient along the plume such that it is cooler northwest of the boundary defined by the wing features indicated in Figure 8a,d, and a similar jump in temperature across the edge of the southwestern wing (they do not detect a temperature difference across the northeastern wing). The edges of the wings therefore represent the edge of the shock front, which has been distorted as it passed through the dense core of Abell 133, giving it a curved appearance. The edge in the pseudo-pressure map north of the cD galaxy, which coincides with the northern edge of the wing features in the X-ray image (compare the overlaid curve in Figures 8a & 8d), seems to support this scenario. However, as F04 point out, the “evidence is marginal because it is based on keeping the temperatures of the projected hot component fixed, and the evidence disappears when all temperatures are left free”. With the new Chandra data, we are able to fit two-temperature models in these regions without fixing temperature parameters, thereby more accurately accounting for projection effects. As shown in Table 3, we find no evidence for a change in temperature between the core (R1), the plume (R2), and the tip of the plume (R3). In § 4.2, we did a further test of this result by dividing the plume (R2) into 7 contiguous regions, each with net counts, and fitting each region with a two-temperature model with fixed temperature and abundance for the projected hot component. We find that all of the fitted temperatures are consistent with 1.1 keV within 3, and most are consistent within 1.
Table 4 gives our results from spectral fits across the wings, with regions defined as in F04. The single-temperature fits show no evidence for upstream and downstream temperature differences, consistent with what F04 find. The two temperature fits show an increase in the lower temperature across the northern wing, but not the western (this is in contrast to F04, who find a decrease across the western wing, but not the northern). However, for the upstream regions the best-fitting higher temperatures are unreasonably hot and essentially unconstrained. We interpret this as indicating that the upstream regions are simply devoid of cool gas from the core, and the two temperature model instead mostly deprojects the inner 2-3 keV gas from 5-6 keV gas at larger radii (seen in the temperature map in Figure 7), which is only poorly measured in these fits. Alternatively, since the upstream regions are coincident with the radio relic, the measurement of such high temperatures may indicate the presence of very hot gas within the bubbles, or could be the result of fitting a thermal model to a non-thermal component, presumably arising from IC scattering of the CMB by synchrotron-emitting particles within the relic (see the discussion of region R4 in § 4.2). Either interpretation is consistent with the upstream regions corresponding to X-ray cavities created by the radio relic pushing out the cool central gas in these regions, as suggested by Bîrzan et al. (2004; 2008), creating the wing morphology seen in the surface brightness map. This is also consistent with the detection of the edge in the pseudo-pressure map along the northern edge of the X-ray wings since the decrease in X-ray pressure in this region can be attributed to the additional support from the radio-filled cavities. Since we find cooler low-temperature gas downstream in the northern wing we conclude that our results are inconsistent with the F04 model of a shock passing through the core from the southeast, but are consistent with the wing features arising from the displacement of cool gas by the buoyantly rising radio-filled relic.
6.4. Radio Relic and Lobes
There have been at least two suggestions as to the origin of the diffuse radio source in Abell 133 (which we refer to as the “relic” or “northern lobe”, depending on context). First, it may be a radio relic, as suggested by its steep spectral index (it is the third steepest source in the sample of 24 objects from Bîrzan et al. 2008) and non-central location (S01). However, some of the properties of the source seem to be at variance with radio relics observed in other clusters. While we have argued that Abell 133 is dynamically disturbed, there is no clear indication of a merger shock, which is thought to be required to re-accelerate the radio emitting particles (although see the discussion of Figure 10 in § 6.1). Furthermore, the integrated polarization is low (%; S01) and shows complicated spatial variations (F02), in contrast to most radio relics. Second, this feature may be an old detached radio lobe associated with the central source in the cD galaxy (Rizza et al. 2000), similar to the attached eastern “ear” lobe in M87 (Owen et al. 2000; Forman et al. 2007) and consistent with our above conclusion that the X-ray plume was formed via buoyant lift by a rising bubble. However, in such sources one typically finds two lobes produced by a double-sided jet (although there are examples of single-lobed systems, e.g., Bagchi et al. 2009). In this section we re-examine the nature of this source in the context of our conclusions about the dynamical state of Abell 133 and the large-scale double-lobed morphology revealed by deeper radio observations (Figure 5).
6.4.1 Relic Rise Time, Synchrotron Age, and Morphology
Since we have concluded that the X-ray plume was formed due to buoyant lift of cool gas by the rising relic, it is of interest to compare the relic age to the buoyant rise time. We can estimate a lower-limit on rise-time of the relic by assuming that the bubble rises with an average speed equal to the sound speed in the gas. For a local ambient ICM temperature of 2.3 keV (consistent with results in Table 3) the sound speed is 782 , giving a lower-limit rise-time of yr. This is a lower limit since the bubble need not rise in the plane of the sky, and since the bubble may rise at some fraction of the sound speed. If we take average values and assume that (as suggested by Churazov et al. 2001), and that the bubble rises along a vector 45∘ from the plane of the sky, the rise time increases to yr. Bîrzan et al. (2008) estimate the synchrotron age of the radio relic to be yr. Thus, the lower limits placed on and allow , as expected (i.e., the age of the relic should be more than the time it took to rise to its current position). However, using low frequency radio observations, particularly at 29.9 MHz (Finlay & Jones 1973) and 80 MHz (Slee 1995), S01 estimate a synchrotron age of yr, close to our estimated lower limit on , but shorter than the “average” rise time of yr given above. Based on their value of and the assumption that the relic likely does not rise in the plane of the sky, S01 conclude that the rise time and the age of the relic are inconsistent, and suggest that the relic may have come from the galaxy directly west of the core in Abell 133 (visible, e.g., in Figure 5a) rather than from the cD galaxy itself.
More recent Chandra observations make it clear that the relic has in fact risen from the central cD galaxy, inconsistent with the S01’s suggestion that the relic has come from another galaxy just outside of the core. We note that the estimate of the relic age by S01 may be inaccurate, both because the low frequency radio observations have very poor resolution (∘) and fluxes must be corrected by subtracting off the contribution from other sources in the field (which requires some assumption about spectral indices), and because the flux in the region of the relic may be contaminated by the putative background lobe discussed in § 6.4.2 (although an estimate of the latter effect is difficult given the data we consider here). As a check on the relic age estimate of S01, we used the model applied, e.g., in Parma et al. (2007) and Giacintucci et al. (2007), including the new radio data to estimate the synchrotron age. Our results are fully consistent with those of S01. We conclude that an improved estimate of the relic age will require additional low frequency radio data below 74 MHz (e.g., from LOFAR).
If we assume that the relic age given by S01 is accurate, the most natural solution to the inconsistency noted by S01 is that the bubble rises along a vector that is close to the plane of the sky, so that the rise time is close to the lower limit and consistent with yr. That this is the case is suggested by the X-ray images alone, specifically by the fact that we see cavities in the cooler central ICM that are co-spatial with the relic (detailed spectral fits indicate that the cavities are devoid of cooler keV gas, see § 4.2). If the relic was much in front of or behind the core, such that it was beyond the cooler gas encompassed by the edge indicated in Figure 11, we wouldn’t expect to see cavities in the cool gas (in fact, we would not expect to see cavities at all, since the lower surface brightnesses at larger radii make density contrasts more difficult to detect [Bîrzan et al. 2009]). If the central gas were significantly extended along the line of sight the bubble may have risen along this extension, although not only would it still be difficult to detect the bubble for large inclination angles of the extension due to the large column density of cool gas behind (or in front of) the bubble, but, as we show in § 4.3, the surface brightness profile is well-described by an ellipsoidal density model with the major axis in the plane of the sky. Thus, we conclude that the relic has likely risen in a direction that is close to the plane of the sky, resolving the inconsistency between and reported by S01.
However, we note that our interpretation of Abell 133 as a dynamically disturbed system can in principle resolve a situation where , and it is of general interest to consider these effects. First, the cosmic ray particles in radio relics are thought to be re-energized by compression from merger shocks, as proposed by Enßlin & Gopal-Krishna (2001). If the particles have been re-accelerated due to a merger with a subgroup, the true age of the relic will be larger than the synchrotron age estimated from the current radio luminosity and spectral index (however, in § 6.1 we showed that for the potential perturbing subclusters the time since the merger is yr, also longer than the S01 estimate of ). Second, we note that the close passage of a perturbing subgroup, which has initiated gas sloshing in the core, can in principle decrease the rise time required to get to the current position. The passage will temporarily deepen the gravitational potential, causing gas to flow towards the subgroup and increasing the buoyant force on the bubble. To estimate the strength of this effect, we used the mass model for Abell 133 described in § 6.1 to estimate the duration and speed of the core passage phase of a putative subcluster. To maximize the effect, we assumed an impact parameter of 37 kpc (equal to the projected distance between the relic and the AGN) and that the subcluster mass profile at small radii is the same as that of Abell 133, truncated at 100 kpc. (Although the subcluster’s total mass will be less than that of the main cluster it may be more concentrated, giving more mass in the core. However the core of the subcluster cannot be more massive than the core of the main cluster otherwise the main core would have been completely destroyed by the merger, so we maximize the effect by making the core and subcluster masses equal.) We find an average speed at core passage of . The buoyant acceleration of the bubble is
| (4) |
where is the density in the bubble, is the density of the ambient ICM, and is the gravitational acceleration. We assume that , so that . The maximum velocity the bubble can attain is determined by the drag force, which is given by
| (5) |
where is the cross-sectional area of the bubble and is the drag coefficient (we use , see Churazov et al. 2001). Therefore, balancing the buoyant force with gives a maximum bubble velocity of
| (6) |
where kpc is the semi-minor axis of the bubble. Using the above model and starting the bubble at rest 5 kpc from the core gives yr neglecting the contribution from the subcluster, and yr including the subcluster. Thus, even a favorable estimate of the subcluster’s influence on the rise time gives gives only a 16% effect, insufficient to reduce the average rise time enough to be consistent with the estimate of from S01.
Our proposed merger/gas sloshing model can have some additional consequences for the radio observations, in particular when considering the morphology of the relic and jet. As noted by S01, the 1.4 GHz image (Figure 5a) shows a clear separation between the loop feature extending east of the Abell 133 core and the filamentary radio relic. However, at lower frequencies the jet and relic seem to connect (Figure 5c), and Rizza et al. (2000) report a connection in their 1.4 GHz observations. If we assume that features are indeed connected, one then needs to explain not only the apparent misalignment between the inner jet (which points east by northeast) and the direction of the bubble from the core (north by northwest), but also the lack of a counter jet and relic as observed in other systems (e.g., M87). We note that not only can gas sloshing, in principle, push around the lighter radio plasma (without affecting the cooler, denser, X-ray plume), deforming the jet and giving rise to some of the fine filaments seen in the high-resolution radio images, but the additional buoyant force from a passing subcluster can change the rise trajectory of buoyant bubbles, possibly pushing two bubbles together as they rise from the core (such “misalignment” of buoyantly rising bubbles is clearly observed in other systems, e.g., M87 [Forman et al. 2007]). To test this effect, we applied the same model we used to calculate the effect of the subcluster on the buoyant rise time (described above). We used a smaller velocity at core passage of 1000 and evolved the bubbles starting just prior to core passage to maximize the effect.
First, we consider the case where the subcluster moves in the same plane as the jets. The resulting trajectories of the bubbles are shown in Figure 18. In this figure, the subcluster passes along the line , moving from left to right. Without the influence of the subcluster, the bubbles rise buoyantly along the -axis. We see that while the subcluster has a significant effect on the rise trajectories, the final separation between the bubbles is too large for them to overlap. However, if we view this case at an angle such that the initial direction of the jets (and the direction of motion of the subcluster) is close to our line of sight (consistent with our suggestion that the motion of the perturbing subcluster is not in the plane of the sky), then the bubbles can overlap in projection (see the dotted lines in Figure 18). In this projection, the jets still point along the -axis, giving rise to a misalignment between the jet direction and the bubble trajectory, similar to what is observed (Figure 5a). Therefore, the additional buoyant force of a merging subcluster can, in principle, address the primary objection to the interpretation of the relic as a detached radio lobe (namely that only one lobe is observed), although there are some difficulties with the details of our model. In this simulation, the rise time of the bubbles is yr, and the final true separation between the bubbles and the core is kpc. The separation places the bubbles just outside the central cool gas, although, as we argue above, the X-ray images suggest that the relic has evacuated cavities in the cool central gas, and therefore cannot be much more than kpc from the core and must have risen close to the plane of the sky (since the projected separation from the core is kpc). Thus, while this model can potentially reproduce some of the observed radio features, it is not fully consistent with the observations (although we note that sloshing induced gas motions can in principle add to the rising speed of the bubble and resolve this inconsistency).
We also considered the case where the merger axis of the subcluster is perpendicular to the plane defined by the inner jets. The subcluster passes by the core, equidistant from each bubble, so the effect on each bubble is the same and the trajectories are symmetric. The resulting trajectory for a rising bubble is shown in Figure 19. The results are similar to the case where the subcluster passes parallel to the inner jet axis: while the additional buoyant force from the subcluster can significantly affect the rise trajectories and give a possible projection where the bubbles are co-spatial and separated from the central AGN, the final distance from the core ( kpc) puts the bubbles outside of the central cool gas and is inconsistent with the observation of cavities in the gas. We conclude that, although we have shown that an interloping subcluster can in principle have a significant effect on the morphology and evolution of buoyant radio bubbles, our simplistic model fails to reproduce what we see in Abell 133 (although the added effect of sloshing-induced gas motions could resolve this discrepancy).
6.4.2 Radio Lobes
The overall structure of the low-resolution, low-frequency radio images (Figure 5) and spectral index maps (Figure 16) is consistent with what one would expect for a double-lobed radio galaxy. Optical observations place the galaxy core at a redshift of , much larger than the redshift of Abell 133 (). However, the high-resolution 1.4 GHz radio image reveals the bright, complex relic in the region of the northern lobe, and X-ray observations unambiguously associate the relic with cool central gas in Abell 133. We are therefore left with three possibilities: (1) the radio galaxy is associated with Abell 133, and the radio core overlaps with the optical source by chance, as does the northern lobe with the relic; (2) the core and jet features are at , but the lobes are unassociated with this source (with at least the northern lobe/relic being in Abell 133), and the alignment between the jets/arc and the lobes is coincidental; and (3) there is a giant background radio galaxy, oriented such that the northern lobe overlies the relic in Abell 133. Unfortunately, we are unable to distinguish between these three scenarios with the current data (although we searched for a surface brightness depression associated with the southern lobe and found none, the low X-ray surface brightness at this radius would make any putative cavity associated with the lobe extremely difficult to detect [Bîrzan et al. 2009], so the non-detection cannot be used to argue that the southern lobe is a background source). Out of these three possibilities, we suggest that the third option of a double-lobed background radio galaxy is most likely since it requires the smallest number of random coincidences.
Assuming that the radio observations represent a radio galaxy at , we find that the total extent of the lobes is 1.6 Mpc (compared to 400 kpc if the galaxy were at the redshift of Abell 133). This is within the range of what has been found for other giant radio galaxies (Schoenmakers et al. 2001 find a strong drop in the number of sources larger than Mpc). We do not measure IC emission in the region of the southern lobe, and therefore cannot infer the energy density in electrons () and magnetic fields (), but the size of the radio galaxy (which correlates linearly with these properties, Isobe et al. 2009) implies ergs cm-3 and ergs cm-3.
Flux contamination from a putative background lobe may explain some of the properties of the relic in Abell 133 that seem to be at variance with relics observed in other clusters. Blending with a background source may well lead to the complex polarization map presented by F02. Additionally, since the background lobe is expected to be old (more than yrs) and to not contribute much flux at high frequencies (as is typical for giant radio galaxy lobes) it may steepen the combined spectrum. To estimate the effects of the background lobe, we assume that it has the same flux as the southern lobe. (Note that this assumption need not be valid, since opposite radio lobes can vary significantly in brightness. An example of an extreme case is the single-lobed giant radio galaxy reported by Bagchi et al. [2009].) We find that the background lobe contributes 13%, 11%, 7%, and 3% of the total flux in the region of the relic in the 74 MHz, high-resolution 330 MHz, low-resolution 330 MHz, and low-resolution 1.4 GHz images respectively. These flatten the spectral indices of the relic (Table 6) by 2.2% for , 2.9% for , and 0.7% for , in each case within or on the order of the 1 error range. We conclude that the background northern lobe will not significantly alter the spectral index for the relic unless it is significantly brighter than the southern lobe.
In conclusion, we find it most likely that the large-scale double-lobed feature represents a background giant radio galaxy, with the northern lobe obscured by the brighter relic in Abell 133. The nature of the radio relic remains unclear. Its morphology and association with a (presumably uplifted) plume of cool gas is very similar to the eastern “ear” radio lobe feature in M87 (Forman et al. 2007). The putative background northern lobe does not significantly flatten the spectral index of the relic, and it is unclear whether it can explain the unusual polarization map presented in F02. The steep index suggests a radio relic classification, and while we do not find clear evidence of a merger shock, which would be required to re-accelerate the particles in the relic, we have argued that Abell 133 is a dynamically disturbed system, and find some evidence for shock heated gas south of the cluster core. The free-fall time of the gas at the tip of the X-ray plume is yr, a factor of two larger than the most likely rise time of the bubble of yr, so that the plume may persist for some time after it has decoupled from the buoyant action of the relic. In the case of the double-lobed radio galaxy interpretation, we have shown that the passage of a merging subcluster can in principle move the bubbles buoyantly so that they overlap in projection and give something similar to what is observed, although in our simple model the bubbles end up too far from the core to produce the observed radio cavities. We conclude that the most likely interpretation is that the diffuse source is a relatively young radio relic, re-energized by the dynamical activity in Abell 133. Its youth not only explains its proximity to the core (and its association with the X-ray plume), but it would require less energy to re-accelerate the younger particle population, in which case a weak shock or even gas sloshing may provide the necessary energy to compress the relic.
7. Summary
We have presented results from deep Chandra and VLA observations of the cool core cluster Abell 133. The elliptical X-ray isophotes, the offset between the cool gas and cD galaxy, optical substructure detections, and a weak elliptical sloshing edge (which is sharpest to the southeast) suggest that Abell 133 is dynamically disturbed. The detection of multiple peaks in the cD galaxy at optical, NIR, and UV wavelengths and corresponding minima in the X-ray temperature map suggests an ongoing galaxy-galaxy merger, and the offset between the cool gas minima and the peaks at longer wavelengths suggest bulk gas motion in the core, consistent with gas sloshing from a recent subcluster merger. The large scale temperature map reveals a cool clump of gas to the north, possibly indicating stripped gas from a merging subcluster, and somewhat higher temperature gas to the south (as compared to the north), possibly due to ICM gas heating by a merger shock. Although optical tests for substructure are inconclusive, there is evidence for substructure to the south and southwest of the core. We suggest a model where a merging subcluster (possibly one of the optically detected substructures) has passed southeast of the core, leaving the cool clump of stripped gas to the north, shock heating the ICM in the south, and initiating gas sloshing in the core. Since the subcluster does not move in the plane of the sky, we view the sloshing spiral (seen in simulations and observations of other systems) at an angle, resulting in the ragged elliptical surface brightness edge we identify as a cold front.
We find that the bird-like morphology of the central gas can be fully explained by the presence of the diffuse radio source in Abell 133. The plume of cool gas is buoyantly lifted by the relic, as seen in simulations and observations of other systems, and in agreement with previous work. Our results regarding the X-ray wings are inconsistent with the previously suggested model where they arise from a shock passing through the cool core since we rule out temperature jumps across the putative shock front. Instead, the wings are created by X-ray cavities occupied by the radio relic on either side of the plume.
In the radio, we identify a previously unreported Mpc background giant radio galaxy at . The northern lobe of this source overlaps with the relic in Abell 133, contributing modestly to the total flux in this region and marginally affecting measured spectral indices. The nature of the steep-spectrum relic source in Abell 133 remains unclear. The agreement between the lower limit on the rise time and synchrotron age of the relic, along with its association with X-ray cavities in the central cool gas, suggest that the relic has risen along a vector close to the plane of the sky, forming the cool X-ray plume via buoyant lift. X-ray spectral fits in the region of the relic indicate the presence of either high-temperature gas or non-thermal emission. Although the measured photon index is flatter than the spectral slope inferred from radio observations, indicating that the non-thermal emission is not from IC scattering of the CMB by the radio emitting particles, the slopes are consistent within the (large) 90% confidence intervals. We have argued that it is most likely a young relic, possibly re-energized by a weak shock or gas sloshing associated with the recent merger, although other interpretations remain plausible. We have shown that, in principle, the additional buoyant force of a passing subcluster can significantly affect the trajectories of buoyantly rising radio bubbles and explain the drastic misalignment of the eastern inner jet and the rise direction of the relic, although the details of our simple model do not fully agree with the observations in the case of Abell 133.
References
- (1)
- (2) Ascasibar, Y., & Markevitch, M. 2006, ApJ, 650, 102
- (3)
- (4) Bagchi, J., Gopal-Krishna, Krause, M., Konar, C., Joshi, S. 2009, ASPC, 407, 200
- (5)
- (6) Bîrzan, L., McNamara, B. R., Nulsen, P. E. J., Carilli, C. L., & Wise, M. W. 2008, ApJ, 686, 859
- (7)
- (8) Bîrzan, L., McNamara, B. R., Nulsen, P. E. J., Wise, M. W. 2009, pre-print (arXiv:0909.0397)
- (9)
- (10) Bîrzan, L., Rafferty, D. A., McNamara, B. R., Wise, M. W., & Nulsen, P. E. J. 2004, ApJ, 607, 800
- (11)
- (12) Blanton, E. L., Sarazin, C. L., McNamara, B. R. 2003, ApJ, 585, 227
- (13)
- (14) Buote, D. A. 2000, MNRAS, 325, 676
- (15)
- (16) Churazov, E., Brüggen, M., Kaiser, C. R., Böhringer, H., & Forman, W. 2001, 554, 261
- (17)
- (18) Cohen, A. S., Lane, W. M., Kassim, N. E., Lazio, T. J. W., Cotton, W. D., Perley, R. A., Condon, J. J., & Erickson, W. C. 2004, BAAS, 205, 9105
- (19)
- (20) Condon, J. J., Cotton, W. D., Greisen, E. W., Yin, Q. F., Perley, R. A., Taylor, G. B., & Broderick, J. J. 1998, AJ, 115, 1693
- (21)
- (22) Cooke, B. A. et al. 1978, MNRAS, 182, 489
- (23)
- (24) Cornwell, T. J., & Perley, R. A. 1992, A&A, 261, 353
- (25)
- (26) Dalton, G. B., Maddox, S. J., Sutherland, W. J., & Efstathiou, G. 1997, MNRAS, 289, 263
- (27)
- (28) Dupke, R., White, R. E., & Bregman, J. N. 2007, ApJ, 671, 181
- (29)
- (30) Enßlin, T. A., & Gopal-Krishna 2001, A&A, 366, 26
- (31)
- (32) Finlay, E. A., & Jones, B. B. 1973, Australian J. Phys., 26, 389
- (33)
- (34) Flin, P. & Krywult, J. 2006, A&A, 450, 9
- (35)
- (36) Forman, W. R. et al. 2007, ApJ, 665, 1057
- (37)
- (38) Fujita, Y., Sarazin, C. L., Kempner, J. C., Rudnick, L., Slee, O. B., Roy, A. L., Andernach, H., & Ehle, M. 2002, ApJ, 575, 764 (F02)
- (39)
- (40) Fujita, Y., Sarazin, C. L., Reiprich, T. H., Andernach, H., Ehle, M., Murgia, M., Rudnick, L., & Slee, O. B. 2004, ApJ, 616, 157 (F04)
- (41)
- (42) Gastaldello, F., Buote, D. A., Temi, P., Brighenti, F., Mathews, W. G., & Ettori, S. 2009, ApJ, 693, 43
- (43)
- (44) Giacintucci, S., Venturi, T., Murgia, M., Dallacasa, D., Athreya, R., Bardelli, S., Mazzotta, P., & Saikia, D. J. 2007, A&A, 476, 99
- (45)
- (46) Hambly, N. C. et al. 2001, MNRAS, 326, 1279
- (47)
- (48) Isobe, N., Tashiro, M. S., Gandhi, P., Hayato, A., Nagai, H., Hada, K., Seta, H., Matsuta, K. 2009, ApJ, 706, 454
- (49)
- (50) Kalberla, P. M. W., Burton, W. B., Hartmann, D., Arnal, E. M., Bajaja, E., Morras, R., Pöppel, W. G. L. 2005, A&A, 440, 775
- (51)
- (52) Lane, W. M., Clarke, T. E., Taylor, G. B., Perley, R. A., & Kassim, N. E. 2004, AJ, 127, 48
- (53)
- (54) Markevitch, M., & Vikhlinin, A. 2007, PhR, 443, 1
- (55)
- (56) Mazzotta, P., Markevitch, M., Vikhlinin, A., Forman, W. R., David, L. P., & VanSpeybroeck, L. 2001, ApJ, 555, 205
- (57)
- (58) Merrifield, M. R., & Kent, S. M. 1991, AJ, 101, 783
- (59)
- (60) Navarro, J. F., Frenk, C. S., & White, S. D. M. 1996, ApJ, 462, 563
- (61)
- (62) —— 1997, ApJ, 490, 493
- (63)
- (64) Owen, F. N., Ledlow, M. J., & Keel, W. C. 1995, AJ, 109, 140
- (65)
- (66) Owers, M. S., Warrick, J. C., & P. E. J. Nulsen 2009, ApJ, 693, 901
- (67)
- (68) Parma, P., Murgia, M., de Ruiter, H. R., Fanti, R., Mack, K.-H., & Govoni, F. 2007, A&A, 470, 875
- (69)
- (70) Pointecouteau, E., Arnaud, M., Kaastra, J., & de Plaa, J. 2004, A&A, 423, 33
- (71)
- (72) Randall, S. W. et al. 2010, pre-print (arXiv:1006.4379)
- (73)
- (74) Randall, S. W., Jones, C., Markevitch, M., Blanton, E. L., Nulsen, P. E. J., & Forman, W. R. 2009, ApJ, 700, 1404
- (75)
- (76) Randall, S., Nulsen, P., Forman, W., Jones, C., Machacek, M., Murray, S., & Maughan, B. 2008, ApJ, 688, 208
- (77)
- (78) Rizza, E., Loken, C., Bliton, M., Roettiger, K., Burns, J. O., & Owen, F. N. 2000, ApJ, 119, 21
- (79)
- (80) Schoenmakers, A. P, de Bruyn, A. G., Röttgering, H. J. A., & van der Lann, H. 2001, 374, 861
- (81)
- (82) Simionescu, A., Böringer, H., Brüggen, M., & Finoguenov, A. 2007, A&A, 465, 749
- (83)
- (84) Skrutskie, M. F. et al. 2006, AJ, 131, 1163
- (85)
- (86) Slee, O. B. 1995, Australian J. Phys., 48, 143
- (87)
- (88) Slee, O. B., Roy, A. L., Murgia, M., Andernach, H., & Ehle, M. 2001, AJ, 122, 1172 (S01)
- (89)
- (90) Struble, M. F. & Rood, H. J. 1999, ApJS, 125, 35
- (91)
- (92) Vikhlinin, A., Markevitch, M., Murray, S. S., Jones, C., Forman, W., & Van Speybroeck, L. 2005, ApJ, 628, 655
- (93)
- (94) Vikhlinin, A., Kravtsov, A., Forman, W., Jones, C., Markevitch, M., Murray, S. S., & Van Speybroeck, L. 2006, ApJ, 640, 691
- (95)
- (96) Way, M. J., Quintana, H., & Infante, L. 1997, pre-print (arXiv:9709036)
- (97)
- (98) White, D. A., Jones, C., & Forman, W. 1997, MNRAS, 292, 419
- (99)
| Obs ID | Date Obs | Target | CCDs Used | Cleaned Exposure |
|---|---|---|---|---|
| (ksec) | ||||
| 2203 | 2000-10-13 | A133 | S3, S1 | 30.0 |
| 3183 | 2002-06-24 | A133-OFFSET | I0, I1, I2, I3, S2 | 43.0 |
| 3710 | 2002-06-26 | A133-OFFSET | I0, I1, I2, I3, S2 | 42.0 |
| 9897 | 2008-08-29 | A133 | I0, I1, I2, I3, S2 | 68.7 |
| Date | VLA Configuration | Frequency | Bandwidth | Duration | rms | Obs. Code |
|---|---|---|---|---|---|---|
| (MHz) | (MHz) | (hours) | (mJy/bm) | |||
| 2002 Jun 9 | B | 328.5/321.6 | 6.25/6.25 | 2.3 | 0.88aaThe rms listed is for the map made by combining both frequencies. | AC647 |
| 2002 Dec 9 | C | 1364.9/1435.1 | 25/25 | 3.1 | 0.065aaThe rms listed is for the map made by combining both frequencies. | AM735 |
| 2003 Aug 16 | A | 73.8/328.5 | 1.5/6.25 | 3.2 | 65.9/0.86 | AC647 |
| Region | /dof | |||||
|---|---|---|---|---|---|---|
| (keV) | (keV) | () | (cm-2) | |||
| R1 | 1.10 | 2.21 | 1.27 | … | 5.1 | 154/127=1.21 |
| R2 | 1.04 | 2.32 | 1.47 | … | 1.7 | 159/108=1.48 |
| R3 | 1.06 | 2.21 | 1.41 | … | 2.5 | 90/88=1.02 |
| R3 | 1.34 | … | 0.42 | 0.4 | 5.1 | 96/88=1.09 |
| R4 | 2.82 | … | 1.27 | … | 3.7 | 157/126=1.25 |
| R4 | 2.14 | 54.40 | 0.86 | … | 4.8 | 142/123=1.16 |
| R4 | 2.23 | … | 0.76 | 0.27 | 5.6 | 141/123=1.14 |
| R5 | 1.10 | 2.39 | 1.73 | … | 5.1 | 64/55=1.16 |
| R6 | 1.11 | 2.22 | 0.91 | … | (5.1) | 62/72=0.81 |
| TotalaaFit to the total diffuse emission within the central 1.9′ (121 kpc). | 2.10 | 5.43 | 0.84/0.67bbSeparate abundances given for lower and higher temperature components, respectively. | … | 2.9 | 791/777=1.02 |
| Region | /dof | ||||
|---|---|---|---|---|---|
| (keV) | (keV) | () | (cm-2) | ||
| ND | 3.00 | … | 1.10 | (2.9) | 98/89=1.10 |
| ND | 1.48 | 3.11 | 1.06 | (2.9) | 93/86=1.08 |
| NU | 3.02 | … | 1.43 | (2.9) | 86/76=1.19 |
| NU | 2.55 | 14.17 | 1.26 | (2.9) | 83/69=1.21 |
| WD | 3.69 | … | 1.35 | (2.9) | 51/66=0.77 |
| WD | 2.01 | 4.95 | 1.12 | (2.9) | 44/63=0.70 |
| WU | 3.75 | … | 0.60 | (2.9) | 935/30=1.17 |
| WU | 2.07 | 21.72 | 0.31 | (2.9) | 26/27=0.98 |
| RegionbbRegions labeled in Figure 10. | /dof | ||||
|---|---|---|---|---|---|
| (keV) | (keV) | () | |||
| N. Clump | 2.31 | … | 0.14 | … | 69/83=0.83 |
| Hot Spot | 6.74 | … | 0.66 | … | 64/59=1.09 |
| Hot Spot | 2.31 | (0.66) | … | 57/57=1.01 | |
| Hot Spot | 2.72 | … | (0.66) | 1.19 | 58/57=1.02 |
| NW Corner | 4.11 | … | 0.46 | … | 477/433=1.10 |
| SE Corner | 4.59 | … | 0.34 | … | 445/419=1.06 |
| Feature | aaErrors do not include calibration errors.bbSubscripts indicate frequency in MHz and VLA configuration. | aaErrors do not include calibration errors.bbSubscripts indicate frequency in MHz and VLA configuration. | ccSubscripts indicate frequencies and VLA configurations used to calculate index. | ccSubscripts indicate frequencies and VLA configurations used to calculate index. | ccSubscripts indicate frequencies and VLA configurations used to calculate index. |
|---|---|---|---|---|---|
| (mJy) | (mJy) | ||||
| A133 Core | 146.46 | 22.68 | -1.29 | … | … |
| A133 Core JetddEmission connecting the Abell 133 core to the relic, not detected at higher frequencies. | 289.92 | … | … | … | … |
| Relic/N. LobeeeRegion includes the Abell 133 core jet but excludes the core itself. | 3267.20 | 136.75 | -2.20 | -2.11 | -1.60 |
| S. CoreffRegion is difficult to isolate, so measurements are likely contaminated by nearby emission. | 129.72 | 23.21 | -1.19 | -1.12 ffRegion is difficult to isolate, so measurements are likely contaminated by nearby emission. | -2.10 ffRegion is difficult to isolate, so measurements are likely contaminated by nearby emission. |
| S. Core N. JetffRegion is difficult to isolate, so measurements are likely contaminated by nearby emission. | 91.9 | … | -1.48 | -2.49 ggMeasurements may suffer from missing 1.4 GHz flux, leading to artificially steep spectral indices. | … |
| S. Core S. JetffRegion is difficult to isolate, so measurements are likely contaminated by nearby emission. | 60.9 | … | … | -2.95 ggMeasurements may suffer from missing 1.4 GHz flux, leading to artificially steep spectral indices. | … |
| Arc | 39.15 | … | … | -1.96 ggMeasurements may suffer from missing 1.4 GHz flux, leading to artificially steep spectral indices. | … |
| S. Lobe | 203.72 | … | … | … | -1.65 |
| W. Core | 11.33 | 4.92 | -0.58 | … | … |