An Emerging Class of Bright, Fast-evolving Supernovae with Low-mass Ejecta
Abstract
A recent analysis of supernova (SN) 2002bj revealed that it was an apparently unique type Ib SN. It showed a high peak luminosity, with absolute magnitude M, but an extremely fast-evolving light curve. It had a rise time of days followed by a decline of 0.25 mag per day in B-band, and showed evidence for very low mass of ejecta ( M⊙). Here we discuss two additional historical events, SN 1885A and SN 1939B, showing similarly fast light curves and low ejected masses. We discuss the low mass of ejecta inferred from our analysis of the SN 1885A remnant in M31, and present for the first time the spectrum of SN 1939B. The old environments of both SN 1885A (in the bulge of M31) and SN 1939B (in an elliptical galaxy with no traces of star formation activity), strongly support old white dwarf progenitors for these SNe. We find no clear evidence for helium in the spectrum of SN 1939B, as might be expected from a helium-shell detonation on a white dwarf, suggested to be the origin of SN 2002bj. Finally, the discovery of all the observed fast-evolving SNe in nearby galaxies suggests that the rate of these peculiar SNe is at least 1-2 % of all SNe.
Subject headings:
supernovae: general – supernovae: individual (1885A, 1939B, 2002bj) – (stars:) white dwarfs1. Introduction
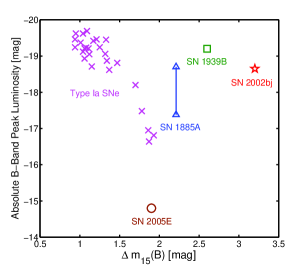
Recently, various peculiar fast-evolving SNe have been discussed in the literature (Perets et al., 2010a; Poznanski et al., 2010). Poznanski et al. (2010) studied the type Ib SN 2002bj. They showed its rise time ( day) and following decay () was much faster than type Ib SNe as well as regular type Ia SNe (; e.g. Benetti et al. 2005; see Fig. 1), and even faster than the faint (typically M mag) and fastest SN 1991bg-like events (; e.g. Benetti et al. 2005; see Fig. 1). Nevertheless, it reached a peak luminosity of M mag, i.e. it was not a faint SN. The total inferred mass in its ejecta was found to be at most M⊙. Perets et al. (2010a) described a class of type Ib events (with the prototypical SN 2005E), also inferred to have M⊙ of ejecta, and likely associated with old environments. However, these SNe differ from SN 2002bj as they show faint peak luminosities (typically M mag), they have a slower evolution (, although the rise time is unknown) and are calcium rich.
Such properties for supernovae of type Ib are remarkable. Type Ib SNe, i.e. showing evidence of helium (but not hydrogen) in their spectra, are generally thought to originate from the core-collapse explosion of massive (stripped) stars of at least a few solar masses, and show much slower evolution. The old environments found for the class of SN 2005E-like events, and the low ejected mass, found for both types of SNe (SN 2005E-like SNe and SN 2002bj), therefore suggest different explosion model(s) for them. One suggested mechanism is helium-shell detonations on white dwarfs (WDs; Perets et al., 2010a; Poznanski et al., 2010; Perets et al., 2010b; Waldman et al., 2010).
The existence of thermonuclear helium-detonation SNe from the explosion of helium-accreting sub-Chandrasekhar mass WDs was theoretically predicted a few decades ago (Woosley et al., 1986; Iben et al., 1987; Iben & Tutukov, 1991; Livne & Arnett, 1995). Variants of these models (including helium deflagration) predicted faint SNe, ejecting M⊙ of material (e.g. Iben et al., 1987; Bildsten et al., 2007; Shen et al., 2010; Waldman et al., 2010; Woosley & Kasen, 2010). Bildsten et al. (2007) studied the production of fast evolving SNe with low ejected mass (so called ’.Ia’ SNe). They initially suggested their light curves evolve even faster than observed for SN 2005E (Bildsten et al., 2007), e.g. , possibly as fast as observed in SN 2002bj. However, detailed light curve modeling by Shen et al. (2010), Waldman et al. (2010) and Woosley & Kasen (2010) show that the expected light curves from their helium-detonation SN models, some of which peak at similar luminosities, decay more slowly than SN 2002bj (Waldman et al., 2010), while lower luminosity models are possibly similar to SN 2005E, under appropriate conditions. The rise time of these SNe, however, is comparable with that expected from these models (Shen et al., 2010; Waldman et al., 2010).
In the case of SNe similar to SN 2005E, a larger sample (8 SNe) and several independent properties support the WD helium-shell detonation scenario (including their old stellar environments and their calcium rich spectra; Perets et al., 2010a, b). However, this is not the case for SN 2002bj.
In the following we present the study of two other SNe with bright but fast-evolving light curves (SNe 1885A and 1939B) similar to 2002bj in the observed B/V-band. These historical SNe were previously suggested to originate from helium-shell detonations (Chevalier & Plait, 1988), but were not considered in the study of SN 2002bj. In this study we would like to remedy this and give additional data to complement the picture.
The data for these SNe are of course less complete than could be obtained with modern instruments. However, we do not find evidence of any systematic errors or biases, suggesting that the data quality is sufficient to reveal the intrinsic properties of the SNe.
The SNe we discuss provide additional clues to the origin of the fastest evolving SNe. In particular, they provide direct evidence for old, non-star forming environments for at least some of these SNe (SNe 1885A and 1939B), likely excluding young massive progenitors and pointing to low-mass, old progenitors such as WDs. They also provide further evidence for the low ejecta mass (much lower than the Chandrasekhar mass) of such SNe, and possibly the importance of other elements and/or processes beside 56Ni decay in driving the SN light curves at early epochs. In addition, the low ejecta mass inferred for SN 1885A is consistent with the low X-ray luminosity of the observed SN remnant (SNR) in M31, as we will show, thus providing a light-curve-independent constraint on the SN ejecta. These events also provide us with further data on the frequency of such SNe. Finally, the lack of clear evidence for helium in the spectrum of SN 1939B could give an additional, although puzzling, clue to the origin of these SNe and the processes involved in their explosions.
2. Observational data
2.1. SN 2002bj
This recently studied SN was shown to be an unusually fast-evolving type Ib SN (Poznanski et al., 2010). Here we reproduce some of its observations to serve as context for the discussion of the two additional fast-evolving SNe described below.
2.2. SN 1885A
SN 1885A (S Andromeda), discovered in the bulge of M31, was the first SN reported in the modern era of astronomy. Its close proximity (the second closest after SN 1987A) enabled many observations of its light curve to be made following its discovery in August 1885 (Fig. 2; based on de Vaucouleurs & Corwin, 1985, data extracted from the published light curve figure) as well as direct observations of its SNR in recent years (Fesen et al., 1989, 2007). Unfortunately, quantitative spectroscopic measurements of SNe did not begin until a few decades after the detection of SN 1885A. Nevertheless, descriptions of the SN colors, and more importantly several prism measurements, provide some information on its spectral features.
2.3. SN 1939B
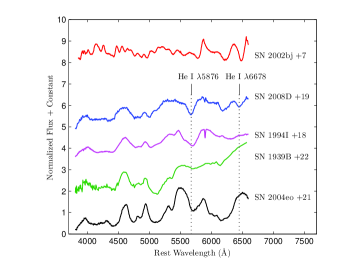
SN 1939B, discovered in the elliptical galaxy NGC 4621 in the Virgo cluster, was one of the first SNe reported by Zwicky. It was observed by several people who provided a detailed light curve (Fig. 2, based on data from Leibundgut et al., 1991, that combined several independent but consistent data sources; re-analysis of some of the original plates by Schaefer & Girard 1999 was also found to be consistent). Although mentioned in the original discovery report (Zwicky & Minkowki, 1939; Adams & Seahes, 1940), a spectrum taken by Minkowski three weeks post maximum was never published. With the invaluable help of the Carnegie Observatories archive we have been able to locate the original spectrum plate, and present the reduced spectrum for the first time (Fig. 3). In the absence of any documentation, we assume that the observational setup was similar to that described in other contemporaneous works (e.g. Minkowski 1939, 1942). A trace was extracted from both the SN spectrum and the arc spectra by following a line of maximum light. The wavelength solution was fitted using Legendre polynomials, yielding residuals of less than 1 Å. Because no flux calibration is available for the data, the general shape of the spectrum was normalized to most resemble the continuum of SN2004eo at 21 days (Fig. 3), enabling a direct comparison of their spectral features.
3. Properties
3.1. Light curves
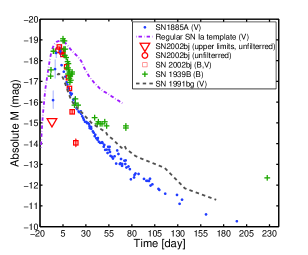
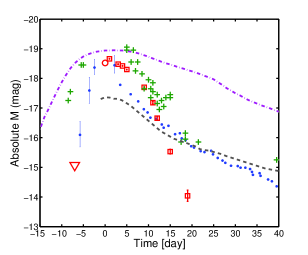
The light curves of SNe 1885A, 1939B and 2002bj (as well as SN 1991bg) are shown in Fig. 2111Data from the NASA/IPAC extragalactic database (NED) were used for distance modulus and Galactic extinction (based on Schlegel et al. 1998) of the host galaxies of the SNe; distance modulus error bars are of the order of mag, these are not shown. The light curves are not corrected for extinction inside the host galaxies.. All three light curves peak at luminosities typical of type Ia SNe, but show a very fast rise to maximum and fast decay. The upper limit for the rise time of SN 2002bj is days; SN 1885A rises at quite a similar timescale of days. The rise time of SN 1939B is somewhat longer, days. All three SNe decay fast, faster than SN 1991bg-like sub-luminous SNe, with of and for SNe 1885A, 1939B and 2002bj, respectively, where we assume a constant for SN 1885A during the 15 days post-peak (as seen for SN 2002bj, and inferred for SN 1885A, e.g. de Vaucouleurs & Corwin 1985; van den Bergh 2002), as only V-band data are available for this SN.
The light curves of SNe 1885A and 1939B were followed for a long period and show a break at and days, respectively, with a power-law-like decay afterward222Note that some photographic light curves of SNe show a leveling at late epochs, possibly due to background contamination (Leibundgut et al., 1991). However, when discussing this effect Leibundgut et al. (1991) specify several such leveling SNe, but do not consider SN 1939B to be one of these. Moreover, SN 1939B does not level out to some possible background level as might be expected by an interpretation of background light [as indeed seen in the leveling of SNe specifically mentioned by Leibundgut et al. (1991) in that context], but continues to fainter magnitudes, e.g. the latest point of SN 1939B is more than two magnitudes fainter than the position of the light curve break. Similarly, SN 1885A does not show signs of leveling, and continuously becomes much fainter at late times after the break.. The slope of SN 1885A at this epoch ( mag per day) is similar to that observed for type Ia SNe at late epochs (see the non-stretched SN Ia template light curve in Fig. 2, and the light curve of SN 1991bg). The light curve of SN 1939B, however, decays more slowly after the break ( mag per day).
The late time exponential decay behavior of SN 1885A may suggest a similar origin as for regular type Ia SNe at this epoch, namely the radioactive decay of 56Co. The resemblance between SNe 1885A and 1991bg at this epoch is in stark contrast to their early behavior, showing a large difference between their peak luminosities. In type Ia SNe the peak luminosity is thought to be driven by the energy deposition from 56Ni decay, whereas the late decay is thought to be driven by its product (56Co). At early epochs the -rays (emitted as 56Ni decays to 56Co and then to 56Fe) are still trapped in the ejecta and deposit their energy there through successive Compton scatterings. At later times, however, and especially for the case of low ejecta mass (as is likely the case for the fast evolving SNe) the column density of the ejecta may may not be thick enough to trap the -rays and they may escape without depositing their energy into the ejecta. In principle, this could explain the difference between the luminosities of the SNe at different epochs, as SN 1885A seems to have much lower mass of ejecta. However, when estimating the difference in the fraction of -rays absorbed inside the ejecta we find that it could only account for a small fraction of the observed difference, as we now show.
The electron (Thompson) optical depth is:
| (1) | |||||
| (2) |
where is the atomic number, is the mass number, mp is mass of proton, is the Thompson cross-section and is the radius at time . Therefore the optical depth at the epoch of peak luminosity is sufficient to trap most of the -rays. Assuming a similar energy source from radioactive decay, we expect the ratio between the luminosities of SNe 1885A and SN 1991bg to reflect the ratio between their 56Ni ejecta mass, MNi. Next, following Kasliwal et al. (2010) we use a fitting formula (as given in Kulkarni 2005; Equation 47) to estimate the fraction of -rays that are effectively absorbed inside the ejecta, . At late times (100 days) we find to be M⊙ and M⊙ for SN ejecta of M⊙ (corresponding to the mass estimate derived below for SN 1885A) and M⊙ (for a typical type Ia SN), respectively. At this epoch the radiation is dominated by the energy deposition from the radioactive decay of 56Co rather than the 56Ni decay (which has a half life time of only days), and therefore where LCo is the radioactive power released by the decay of 56Co (following Kasliwal et al. 2010, where the kinetic energy of positrons is 3.5 % of LCo; Sollerman et al. 2002). We find that the difference in -rays absorption between the two SNe changes their relative luminosities by only a factor of . As can be seen in Fig. 2 the ratio between the SN luminosities at peak vs. late epoch can not be accounted for by this factor. Even if the effective optical depth is ten times larger than the simple Thompson optical depth we use (e.g. Swartz et al. 1995 find few to ten times larger depth) the ratio we find changes only by order unity (0.4 instead of 0.5). We note that the estimated Thompson optical depth we use is calculated at the bottom of the ejecta, where as not all of the -rays is emitted from there. It is therefore possible that a large fraction of the -rays may not be trapped even at peak luminosity. This issue is more likely to affect the less massive ejecta of SN 1939B, in which case the observed peak luminosity of SN 1939B is even lower than it would have been if all the -rays were trapped. The inconsistency between the peak and the tail ratios for SN 1939B and SN 1991bg which we discuss might therefore be even larger than we calculated. We conclude that one requires a different/additional mechanism to drive the light curve at an early epoch. One possible explanation is that SN 1885A had other radioactive elements with short lifetime which contributed to the early light curve generation (e.g. Shen et al. 2010; Waldman et al. 2010).
Note that an additional data point at day 20 (post-maximum) exists for SN 2002bj in bands other than V (see figure 1 in Poznanski et al., 2010), possibly suggesting a steeper slope than SN 1885A and SN 1939B at this epoch. This is seen in the B and R bands, which likely bracket the V band to a similar magnitude. The I band behavior, however, shows a less steep slope, and is quite unique; we see an for SN 2002bj at this epoch, which is much larger than found for any type of SNe (compare with Poznanski et al., 2002). The color evolution of SN 1885A and SN 1939B is unknown, as no filtered data are available. Color descriptions summarized by de Vaucouleurs & Corwin (1985) suggest a value of for SN 1885A at peak, much larger than the observed for SN 2002bj.
3.2. SN 1885A remnant
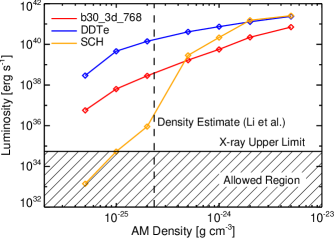
SN 1885A is one of the very rare cases where both the SN and its SNR could be observed. After several failed attempts to find optical, radio, and X-ray emission at the location of SN 1885A, the SNR was finally discovered in absorption against the bulge of M31 (Fesen et al., 1989) and later studied in detail using HST (Fesen et al., 2007). The lack of direct emission from this 125 yr old SNR is remarkable. More than a decade of monitoring X-ray binaries in the central region of M31 with Chandra (Williams et al., 2006; Li et al., 2009) has only yielded an upper limit on the X-ray luminosity of erg s-1 from the SNR, assuming a Raymond-Smith model with kbTKeV (Zhiyuan Li, private communication, 2010).
The thermal X-ray emission from a young SNR is determined mainly by the density of the ambient medium and the mass and kinetic energy of the SN ejecta (e.g., Hamilton & Sarazin, 1984; Badenes et al., 2003). Li et al. (2009) have analyzed the properties of the diffuse X-ray emission in the central arcminute of M31 (which includes the position of SN 1885A), and find an average density of cm-3. This gas density is low, as befits the bulge of a spiral galaxy, but only an order of magnitude lower than the ambient medium density around the Tycho SNR (Badenes et al., 2006), and only a factor 2-3 lower than around the remnant of SN 1006 (Raymond et al., 2007), which are prototypical Type Ia SNRs. We used the code described in Badenes et al. (2003, 2005) to calculate the thermal X-ray luminosity of SNR models with an age of yrs, assuming different ambient medium densities and SN ejecta configurations. For all canonical Type Ia SN ejecta (i.e., explosions with M M MCh and kinetic energy of at least a few erg; see Fig. 4 for the specific models used), our calculations predict X-ray luminosities in excess of ergs s-1 at the value of the ambient medium density estimated by Li et al. (2009), and well above ergs s-1 even for densities a factor two lower. Such high luminosities are inconsistent with the observed X-ray upper limit, even after correcting for absorption. Only Type Ia SN models with significantly lower ejected masses, such as sub-Chandrasekhar explosions, might be able to reproduce X-ray fluxes low enough to match the observations. It is of course possible that SN 1885A is in a local ’bubble’ with a density much lower than the average value found by Li et al. (2009), but taken at face value, the lack of direct emission from the remnant of SN 1885A seems hard to reconcile with the possibility that its birth event was a canonical Type Ia SN, and suggests much lower ejecta mass and energy.
3.3. Spectra
The available spectra of the fast-evolving SNe are shown in Fig. 3. A good quantitative spectrum of SN 1885A is not available. A historical reconstruction based on observations made with prisms is described by de Vaucouleurs & Corwin (1985). The spectral data suggest that it is not a type II SN, but given its poor quality, it cannot be used to conclusively classify SN 1885A as a specific type I SN. We do note that de Vaucouleurs & Corwin (1985) and Pastorello et al. (2008) mentioned the possibility of a type Ib/c identification (the latter suggesting SN 1885A was a massive star exploding in a He-rich circumstellar medium, though the stellar environment of this SN is likely old). However, detailed analysis by Wheeler & Harkness (1990) argue against any evidence for helium lines. We conclude that SN 1885A most resembles a type Ia or a type Ic SN.
The spectrum of SN 1939B, taken days after peak, seems to resemble both that of regular type Ia and type Ic SNe, e.g. SN 2004eo (Ia) and SN 1994I (Ic; see fig. 3 for comparison) as well as faint SNe such as SN 1986G (spectrum not shown). We find no evidence of hydrogen, and no clear evidence for helium lines in the spectrum.
Naturally, the recently studied SN 2002bj has much better spectral observations than the historical SNe. Possible helium lines are seen in its spectra and may show it to be a type Ib SN, however, Kasliwal et al. (2010) suggest a different interpretation, making this SN more similar to a type Ia or a type Ic SN. Note also that this SN shows other similarities with type Ia SNe, mostly in its absorption feature near 6150 Å (rest frame), usually attributed to Si II (Poznanski et al., 2010).
3.4. Inferred masses
Calculations based on the fast light curve of SN 2002bj (Poznanski et al., 2010), resulted in M⊙ of mass in the ejecta. We can use a similar treatment, following Arnett (1982), by relating the mass, kinetic energy, and the timescale of the SN light curve, to estimate the ejecta mass in SN 1939B. The ejecta mass of a given supernova can be estimated using its light curve and the observed ejecta velocities. The expansion velocity, , of a SN is proportional to , where Ekin is the kinetic energy and Mej is the ejected mass, while the typical duration of a SN light curve is tME (Arnett, 1982). Combining these equations and assuming that two objects have the same opacity, we have
| (3) |
and
| (4) |
Given the spectral similarity of SN 1939B (line widths) to SNe 1986G and 2004eo, we take the photospheric velocities to be similar to these. We adopt a velocity of km s-1 (given the similarity to SN 1986G and SN 2004eo, which were found to have typical SN Ia photospheric velocities of and km s-1, respectively). The timescale for the rise and fall of SN 1939B is comparable to that of SN 2002bj, although slightly longer (where Poznanski et al. 2010 find the rise time to be 3 times shorter than typical SNe Ia). Taking a rise time of days, and comparing these values with an average type Ia SN with days, and taking the following typical velocities of km s-1 (Hayden et al., 2010), total ejecta mass of M⊙ and total energy of erg, we find the ejecta mass of SN 1939B to be M⊙ with a kinetic energy of (where similar opacities are assumed). No data are available for the photospheric velocities of SN 1885A and similar direct estimate can not be done. However, if we take the expansion velocity of its SNR, km s-1 (Fesen et al. 2007) to be the typical ejecta velocity, we find the total ejecta mass to be M⊙ and the kinetic energy is of erg (taking a similar rise time as SN 2002bj of days); this is consistent with our analysis of the SNR in section 3.2, showing that the energetics and ejecta mass are likely below those of canonical type Ia SNe. We conclude that all three SNe seem to have a low ejecta mass, M⊙ and low kinetic energies, erg.
3.5. Environments
Both SNe 1885A and 1939B are found in old environments. Multi-band photometric observations of the environment of SN 1885A (Olsen et al., 2006) in the bulge of M31 found it to be composed of an old stellar population, with a characteristic age of Gyr. SN 1939B occurred in the elliptical galaxy NGC 4621. HST images of the galaxy (WF4 detector, with the F555W and F814W filters and an exposure time of 1050 s, taken on Feb 5th, 1995) and of the location of SN 1939B were used by Van Dyk et al. (1999) for PSF fitting and subtraction of foreground stars. Their analysis yielded color measurement of mag for the unresolved light within their error circle (), which was found to be consistent with a background of K-giant stars. This confirms that the close environment of SN 1939B shows no traces of star formation, and likely excludes local star-formation activity in this elliptical galaxy at the SN position (Van Dyk et al., 1999). SN 2002bj is found at the outer region of a nearly face-on barred spiral galaxy (NGC 1821; Poznanski et al. 2010). As mentioned by Poznanski et al. (2010), the diverse stellar population of such galaxies preclude any strong inference on the progenitor system.
We note that the old environment found for two out of the three SNe in the sample (where the properties of the close environment of third, SN 2002bj, are not known) suggest the progenitors for these SNe are old, possibly older than those of regular type Ia SNe. This may be similar to the case of SN 1991bg-like and SN 2005E-like events; 70 % and 50 % of which, respectively, are found in early type galaxies (E and S0; Howell, 2001; Perets et al., 2010a). The progenitors of these SNe are therefore most likely to be WDs.
3.6. Rates
Many calculations of SN rates have been reported in the literature, some of which included the SNe discussed in this paper. Although these studies did not discuss the fast-evolving SNe specifically (except for those using the LOSS survey data; Li et al., 2010; Poznanski et al., 2010), they can be used to estimate how common these objects are. In table 1 we summarize the relative fraction of such SNe, based on various SN rate estimates. Poisson statistics are used to derive uncertainties. Based on these calculations, we conclude that the various estimates are generally consistent with a fraction of % of all observed SNe being bright and fast-evolving SNe. Given the typically much shorter timescale of these SNe (2-3 shorter than typical type Ia SNe), the actual fraction could be twice as large for large cadence surveys, and therefore our estimate likely serves as a lower limit, with an upper limit of .
| Fast evolving | Total | Fraction (%) | Ref. |
|---|---|---|---|
| 1 (1939B) | 5 | Zwicky,1942 | |
| 1 (1939B) | 30 | Katgert & Oort,1967 | |
| 1 (1885A) | 45 | Tammann,1970 | |
| 2 (1885A, 1939B) | 96 | Tammann et al.,1994 | |
| 0 | 110 | Cappellaro et al.,1997 | |
| 1 (2002bj) | 103 | Poznanski et al.,2010 |
∗The sample is only of Sb and Sc galaxies
∗∗They reported SN 2002bj relative to 31 type Ia SNe, the total number of SNe, 103, is estimated given the fractional rate of type Ia SNe to be (Li et al., 2010).
4. Summary
In this study we explored two fast evolving SNe: 1885A and 1939B. These SNe and the recently studied SN 2002bj display similar light curve behavior; they all show a fast rise to a bright peak magnitude followed by a rapid decay. These results point to a low mass (M⊙) of ejected material, which is consistent with our analysis of the SN 1885A remnant. This analysis shows the SNR to be highly peculiar and inconsistent with the typical kinematics and ejecta masses of type Ia SNe. The spectra of the fast-evolving SNe are puzzling. Our newly analyzed spectrum of SN 1939B shows no clear evidence for helium, and the spectra of SN 1885A likely does not show evidence for helium either. Note, however, that the spectrum of SN 1939B is of low quality, and a modern spectrum of SN 1885A is not available. Helium lines are possibly observed in the spectrum of SN 2002bj [but see Kasliwal et al. (2010), for a possible alternative interpretation]. None of the spectral data show evidence for hydrogen. The environments of SNe 1885A and 1939B are old, in the bulge of M31 and in the elliptical galaxy NGC 4621. The local environments of these SNe show no traces of star-formation activity.
The fast light curve and the low mass of ejected material of all three events suggest an emerging class of fast evolving type I SNe, although more data are still required to form a clear observational picture. If these events are related, we may conclude that fast-evolving SNe are more likely to originate in old environments where no star formation occurs, and are likely to result from the explosion of WDs. However, the specific explosion model for these SNe, and the consistency with suggested models (e.g. the helium-shell detonation scenario) are not yet known. Specifically, the role of helium, if any, in these events, as well as the origin of the light curve differences between them (especially at late times) are unclear. Modern spectroscopic follow-up of a larger sample of such objects is required to resolve these issues. Such objects can be found by surveys of large volumes at high cadence such as the Palomar Transient Factory (PTF) survey. Indeed, recently, such SN event (SN 2010X) have been found by PTF. Although this This event is found to be fainter than the fast SNe discussed here ( mag in the r-band; mag fainter than SN 2002bj), it similarly shows fast rise and decay times ( days). A detailed discussion and analysis of this SN can be found in Kasliwal et al. (2010).
References
- Adams & Seahes (1940) Adams, W. S. & Seahes, F. H. 1940, Mount Wilson Observatory Annual Report, 12, 1
- Altavilla et al. (2004) Altavilla, G. et al. 2004, MNRAS, 349, 1344
- Arnett (1982) Arnett, W. D. 1982, ApJ, 253, 785
- Badenes et al. (2003) Badenes, C. et al. 2003, ApJ, 593, 358
- Badenes et al. (2005) —. 2005, ApJ, 624, 198
- Badenes et al. (2006) —. 2006, ApJ, 645, 1373
- Benetti et al. (2005) Benetti, S. et al. 2005, ApJ, 623, 1011
- Bessell (2005) Bessell, M. S. 2005, ARA&A, 43, 293
- Bildsten et al. (2007) Bildsten, L. et al. 2007, ApJL, 662, L95
- Cappellaro et al. (1997) Cappellaro, E. et al. 1997, A&A, 322, 431
- Chevalier & Plait (1988) Chevalier, R. A. & Plait, P. C. 1988, ApJ, 331, L109
- de Vaucouleurs & Corwin (1985) de Vaucouleurs, G. & Corwin, Jr., H. G. 1985, ApJ, 295, 287
- Fesen et al. (1989) Fesen, R. A., Saken, J. M., & Hamilton, A. J. S. 1989, ApJ, 341, L55
- Fesen et al. (2007) Fesen, R. A. et al. 2007, ApJ, 658, 396
- Garnavich et al. (2004) Garnavich, P. M. et al. 2004, ApJ, 613, 1120
- Schaefer & Girard (1999) Schaefer, B. E., & Girard, T. M. 1999, Anni Mirabiles, 69
- Hamilton & Sarazin (1984) Hamilton, A. J. S. & Sarazin, C. L. 1984, ApJ, 284, 601
- Hayden et al. (2010) Hayden, B. T. et al. 2010, ApJ, 712, 350
- Howell (2001) Howell, D. A. 2001, ApJ, 554, L193
- Iben & Tutukov (1991) Iben, Jr., I. & Tutukov, A. V. 1991, ApJ, 370, 615
- Iben et al. (1987) Iben, I. J. et al. 1987, ApJ, 317, 717
- Kasliwal et al. (2010) Kasliwal, M. M. et al. 2010, ApJ, 723, L98
- Katgert & Oort (1967) Katgert, P. & Oort, J. H. 1967, Bull. Astron. Inst. Netherlands, 19, 239
- Kulkarni (2005) Kulkarni, S. R. 2005, ArXiv:astro-ph/0510256
- Leibundgut et al. (1991) Leibundgut, B. et al. 1991, A&AS, 89, 537
- Leibundgut et al. (1993) —. 1993, AJ, 105, 301
- Li et al. (2010) Li, W. et al. 2010, arXiv:1006.4613
- Li et al. (2009) Li, Z., Wang, Q. D., & Wakker, B. P. 2009, MNRAS, 397, 148
- Livne & Arnett (1995) Livne, E. & Arnett, D. 1995, ApJ, 452, 62
- Minkowski (1939) Minkowski, R. 1939, ApJ, 89, 156
- Minkowski (1942) —. 1942, ApJ, 96, 199
- Nugent et al. (2002) Nugent, P., Kim, A., & Perlmutter, S. 2002, PASP, 114, 803
- Olsen et al. (2006) Olsen, K. A. G. et al. 2006, AJ, 132, 271
- Pastorello et al. (2008) Pastorello, A. et al. 2008, MNRAS, 389, 113
- Perets et al. (2010a) Perets, H. B. et al. 2010a, Nature, 465, 322
- Perets et al. (2010b) —. 2010b, arXiv:1012.0570
- Poznanski et al. (2002) Poznanski, D. et al. 2002, PASP, 114, 833
- Poznanski et al. (2010) —. 2010, Science, 327, 58
- Raymond et al. (2007) Raymond, J. C. et al. 2007, ApJ, 659, 1257
- Schlegel et al. (1998) Schlegel, D. J., Finkbeiner, D. P., & Davis, M. 1998, ApJ, 500, 525
- Shen et al. (2010) Shen, K. J. et al. 2010, ApJ, 715, 767
- Sollerman et al. (2002) Sollerman, J., et al. 2002, A&A, 386, 944
- Swartz et al. (1995) Swartz, D. A., Sutherland, P. G., & Harkness, R. P. 1995, ApJ, 446, 766
- Tammann (1970) Tammann, G. A. 1970, A&A, 8, 458
- Tammann et al. (1994) Tammann, G. A., Loeffler, W., & Schroeder, A. 1994, ApJS, 92, 487
- Travaglio et al. (2004) Travaglio, C. et al. 2004, A&A, 425, 1029
- van den Bergh (2002) van den Bergh, S. 2002, AJ, 123, 2045
- Van Dyk et al. (1999) Van Dyk, S. D. et al. 1999, AJ, 118, 2331
- Waldman et al. (2010) Waldman, R. et al. 2010, arXiv:1010.1522.
- Wheeler & Harkness (1990) Wheeler, J. C. & Harkness, R. P. 1990, Reports on Progress in Physics, 53, 1467
- Williams et al. (2006) Williams, B. F. et al. 2006, ApJ, 643, 356
- Woosley et al. (1986) Woosley, S. E., Taam, R. E., & Weaver, T. A. 1986, ApJ, 301, 601
- Woosley & Kasen (2010) Woosley, S. E., & Kasen, D. 2010, arXiv:1010.5292
- Zwicky & Minkowki (1939) Zwicky, F. & Minkowki, R. 1939, IAU Circ., 774, 1
- Zwicky (1942) Zwicky, F. 1942, ApJ, 96, 28