The origin of the infrared emission in radio galaxies. III. Analysis of 3CRR objects
Abstract
We present Spitzer photometric data for a complete sample of 19 low redshift ( 0.1) 3CRR radio galaxies as part of our efforts to understand the origin of the prodigious mid- to far-infrared (MFIR) emission from radio-loud AGN. Our results show a correlation between AGN power (indicated by [OIII] emission line luminosity) and 24m luminosity. This result is consistent with the 24m thermal emission originating from warm dust heated directly by AGN illumination. Applying the same correlation test for 70m luminosity against [OIII] luminosity we find this relation to suffer from increased scatter compared to that of 24m. In line with our results for the higher-radio-frequency-selected 2Jy sample, we are able to show that much of this increased scatter is due to heating by starbursts which boost the far-infrared emission at 70m in a minority of objects (1735%). Overall this study supports previous work indicating AGN illumination as the dominant heating mechanism for MFIR emitting dust in the majority of low to intermediate redshift radio galaxies (0.03 0.7), with the advantage of strong statistical evidence. However, we find evidence that the low redshift broad-line objects ( 0.1) are distinct in terms of their positions on the MFIR vs. [OIII] correlations.
1 Introduction
Identifying the origin of prodigious thermal mid- to far-infrared (MFIR) emission is a key component for a comprehensive understanding of Active Galactic Nuclei (AGN). However, this task is not trivial, because the thermal MFIR emitting dust structures cannot be resolved in most of these galaxies. Therefore, past studies have favored a statistical approach to investigations, focusing on samples of radio galaxies, which can be selected without bias with respect to orientation (Golombek et al., 1988; Impey & Gregorini, 1993 Heckman et al., 1992, 1994; Hes et al., 1995; Haas et al., 2004; Shi et al., 2005; Cleary et al., 2007). Although these studies suggested that the mid-IR (530m) emitting structures are heated by AGN illumination, the lack of sample completeness and the low mid-IR detection rate meant that the AGN heating hypothesis could not be supported with a full statistical analysis.
Additionally, in the past, linking the active nucleus with the origin of the far-IR (30m) emission from cool dust components proved difficult. The failure of uniform compact dust torus models to produce the observed far-IR SEDs of AGN (Pier & Krolik, 1992) led to the proposal of clumpy dust torus geometries (Nenkova et al., 2002, 2008) which produce the required dust temperatures through cloud shadowing. Alternatively, other studies argued that the cool dust producing the far-infrared emission is predominantly heated by starbursts (Rowan-Robinson, 1995, Schweitzer et al., 2006). However, the idea that starbursts dominate the heating of the far-IR emitting dust in AGN has yet to be firmly established with solid observational evidence.
To address the problems associated with previous MFIR investigations of radio-loud AGN, that suffered from biased, incomplete and/or inhomogeneous samples, we carried out a program of deep Spitzer/MIPS MFIR photometric observations for a complete sample of 47 2Jy radio galaxies with redshifts 0.05 0.7 (Program 20233: PI Tadhunter). The results from these data are published in T07, D08 and D09. The results have shown that [OIII] optical emission line luminosity () is significantly correlated with both the mid- (24m) and far-infrared (70m) luminosities ( and respectively). The AGN-photoionised narrow-line region (NLR) is emitted on a small scale (5 kpc), therefore the 5007 emission from the NLR is likely to provide a good indication of the intrinsic power of the illuminating AGN (e.g. Rawlings & Saunders, 1991; Tadhunter et al., 1998; Simpson, 1998 and discussion in D09). Consequently, the correlations between isotropic MFIR luminosity and [OIII] optical emission line luminosity provide strong empirical evidence to support AGN illumination as the dominant heating mechanism of the thermal MFIR emitting dust. Moreover, since radio-loud quasars, broad-line and narrow-line galaxies follow similar correlations between MFIR and [OIII] luminosities, without significant offsets between the two groups, the results also provide strong support for the orientation-based unified schemes for powerful, radio-loud AGN (Barthel, 1989).
In addition, we carefully considered the starburst contribution to the AGN heating of dust. We found that the objects showing optical evidence for starburst activity from spectral synthesis modeling of their spectra, appear to have enhanced far-IR emission compared to the general sample. Our interpretation of these results is that, while AGN illumination is the primary heating mechanism for both the warm (mid-IR emitting, 24m) and cool (far-IR emitting, 70m) dust in most powerful radio galaxies, heating by starbursts acts to substantially boost the 70m luminosity in the 2030 of objects in the 2Jy sample with optical evidence for star formation activity.
The above results support the conclusions for previous studies of powerful radio galaxies (Heckman et al., 1994; Hes et al., 1995; Haas et al., 2004; Shi et al., 2005; Cleary et al., 2007) with the advantage of a thorough statistical analysis afforded to us by the complete and well detected sample. Having established these results for the 2Jy sample, which represents radio-loud AGN at intermediate redshifts (0.05 0.7), it is natural to investigate whether we find similar results for other samples of radio-loud AGN.
The low frequency (170 MHz) selected 3C sample of radio-loud AGN has been favored by many previous investigators, because the low selection frequency means that it is unlikely to be affected by an orientation bias. Recently, deep optical spectroscopic data at both high and low resolution have been published for 3CR sources (Buttiglione et al., 2009), allowing us to create a sample that is complete in both MFIR and [OIII] observations. Furthermore, the 3CR objects make an ideal comparison to the higher frequency selected (2.7 GHz) 2Jy sample. Investigation of a low selection frequency sample allows us to test whether the selection frequency of the 2Jy sample leads to any biases that may affect our understanding of the MFIR emission from radio-loud AGN.
We present here the analysis of Spitzer photometric observations for a complete sample of 3CRR radio galaxies (Laing et al., 1983) with 0.1. The following investigation serves to test our previous conclusions concerning the origin of the thermal MFIR, based on the southern 2Jy sample, using a sample of radio-loud objects with, on average, lower redshifts and radio powers, as well as a different selection frequency.
2 Samples and data reduction
| Name | RA(J2000) | Dec(J2000) | Opt. Class | Rad. Class | SB | SB ref | |
|---|---|---|---|---|---|---|---|
| 3C33 | 0.060 | 01 08 52.8 | 13 20 14 | NLRG | FRII | No | 6 |
| 3C35 | 0.067 | 01 12 02.2 | 49 28 35 | WLRG | FRII | No | 7 |
| 3C98 | 0.030 | 03 58 54.4 | 10 26 03 | NLRG | FRII | No | 2 |
| DA240 | 0.036 | 07 48 36.9 | 55 48 58 | WLRG | FRII | No | 2 |
| 3C192 | 0.060 | 08 05 35.0 | 24 09 50 | NLRG | FRII | No | 7 |
| 4C73.08 | 0.058 | 09 49 45.9 | 73 14 23 | NLRG | FRII | No | - |
| 3C236 | 0.101 | 10 06 01.7 | 34 54 10 | WLRG | FRII | SB | 1,4 |
| 3C277.3 | 0.085 | 12 54 11.7 | 27 37 33 | WLRG | FRI/FRII | No | 8 |
| 3C285 | 0.079 | 13 21 17.8 | 42 35 15 | NLRG | FRII | SB | 1,2 |
| 3C293 | 0.045 | 13 52 17.8 | 31 26 46 | WLRG | FRI/FRII | SB | 5 |
| 3C305 | 0.042 | 14 49 21.6 | 63 16 14 | NLRG | FRII/CSS | SB | 5 |
| 3C321 | 0.096 | 15 31 43.4 | 24 04 19 | NLRG | FRII | SB | 1,3 |
| 3C326 | 0.090 | 15 52 09.1 | 20 05 24 | NLRG | FRII | No | 9 |
| 3C382 | 0.058 | 18 35 03.4 | 32 41 47 | BLRG | FRII | U | 10 |
| 3C388 | 0.092 | 18 44 02.4 | 45 33 30 | WLRG | FRII | No | 9 |
| 3C390.3 | 0.056 | 18 42 09.0 | 79 46 17 | BLRG | FRII | U | 10 |
| 3C403a | 0.059 | 19 52 15.7 | 02 30 23 | NLRG | FRII | No | 9 |
| 3C445a | 0.057 | 22 23 49.6 | 02 06 12 | BLRG | FRII | U | 10 |
| 3C452 | 0.081 | 22 45 48.8 | 39 41 16 | NLRG | FRII | no | 7 |
Note. — The basic parameters for the 3CRR sample are presented. Note that 2 of the objects in the 3CRR sample are in common with the 2Jy sample: 3C403 (PKS194902), 3C445 (PKS222102). Fluxes were measured from Spitzer observations downloaded from the Spitzer archive. Definitions for column 5 are: NLRG – narrow-line radio galaxy, BLRG – broad-line radio galaxy, WLRG – weak-line radio galaxy. Definitions for column 7 are: No – No optical starburst, U – Uncertain starburst objects, SB - Optical starburst objects. SB references are: (1) Holt et al. (2007), (2) Aretxaga et al. (2001), (3) Tadhunter et al. (1996), (4) O’Dea et al. (2001), (5) Tadhunter et al. (2005), (6) Robinson (2001), (7) Wills et al. (2002), (8) Clark (1996), (9) Tadhunter, private communication, (10) Osterbrock et al. (1976). Note that, as well as the evidence based on optical spectroscopy, the presence of energetically significant star formation activity in 3C285, 3C293, 3C321, and 3C305 is supported by the detection of PAH features in their mid-IR Spitzer/IRS spectra (Dicken et al., 2010, in preparation; Shi et al., 2007).
| Name | (W/Hz) | (W/Hz) | (W) | (W/Hz) | |||||
|---|---|---|---|---|---|---|---|---|---|
| 3C33 | 0.060 | 99.4 | 0.2 | 145.5 | 3.4 | ||||
| 3C35 | 0.067 | 0.9 | 0.2 | 18.7 | 6.4 | ||||
| 3C98 | 0.030 | 45.5 | 0.6 | 36.4 | 3.5 | ||||
| DA240 | 0.036 | 3.9 | 0.4 | 32.1 | 4.6 | ||||
| 3C192 | 0.060 | 6.3 | 0.4 | 15.1 | 6.7 | ||||
| 4C73.08 | 0.058 | 44.6 | 0.4 | 23.2 | 2.3 | ||||
| 3C236 | 0.101 | 17.3 | 0.3 | 64.6 | 5.5 | ||||
| 3C277.3 | 0.085 | 9.0 | 0.3 | 18.8 | 3.3 | ||||
| 3C285 | 0.079 | 46.2 | 0.4 | 200.6 | 2.7 | ||||
| 3C293 | 0.045 | 31.1 | 0.3 | 303.0 | 6.7 | ||||
| 3C305 | 0.042 | 44.0 | 0.1 | 311.5 | 2.3 | ||||
| 3C321 | 0.096 | 264.0 | 0.1 | 897.1 | 5.7 | ||||
| 3C326 | 0.090 | 0.7 | 0.1 | 9.0 | - | ||||
| 3C382 | 0.058 | 98.8 | 0.2 | 56.3 | 4.3 | ||||
| 3C388 | 0.092 | 2.6 | 0.2 | 11.1 | - | ||||
| 3C390.3 | 0.056 | 217.1 | 0.2 | 162.9 | 3.1 | ||||
| 3C403a | 0.059 | 193.0 | 0.2 | 348.4 | 3.7 | ||||
| 3C445a | 0.057 | 232.1 | 0.3 | 186.4 | 5.2 | ||||
| 3C452 | 0.081 | 55.6 | 0.1 | 55.7 | 4.7 |
Note. — Columns 3,4,5,6,7 and 8 present the 24 and 70m fluxes, errors and luminosities for the 3CRR sample calculated from fluxes. Column 9 presents the [OIII] luminosities calculated from fluxes taken from Buttiglione et al. (2009), except for the cases of 3C321, DA240 and 4C73.08 which were taken from Saunders et al. (1989), and 3C445 taken from an average of data presented in Osterbrock et al. (1976), Tadhunter (1986), Morris & Ward (1988) and Buttiglione et al. (2009). Column 10 presents the 5 GHz radio luminosities taken from Laing et al. (1983). Luminosities were again calculated using and along with spectral indices derived from the F(70)/F(24) flux ratios for the MFIR data, and the high frequency radio spectral index for the radio data.
This paper presents results for a complete sub-sample of 19 3CRR radio galaxies selected from the sample of Laing et al. (1983) (see Table 1). We have limited these data for completeness to objects with FRII radio morphologies and redshifts 0.1. This leads to a sample with a high level of completeness in both Spitzer/MIPS detections and [OIII] emission line flux measurements. In the following discussion we will refer to this sample as the 3CRR sample. Note that, although two objects in the sample (3C277.3, 3C293) have uncertain radio morphological classifications, and cannot be confidently characterized as either FRI or FRII types, they are included here for completeness.
All of the 3CRR sample objects have been previously observed with Spitzer/MIPS. These data were downloaded as raw MIPS images from the Spitzer Reserve Observation Catalogue (ROC) and reduced in an identical wayto the 2Jy sample discussed in detail in D08. The MFIR flux and data and associated errors are presented in Table 2 were extracted using aperture photometry, again using identical methods to those used for the 2Jy sample described in D08. The [OIII] fluxes were obtained from published deep optical spectra at both high and low resolution taken using Dolores on the TNG (Buttiglione et al., 2009), except DA240, 4C73.08, 3C321 and 3C445 a (see note in Table 2). We detect 100% of the 3CRR sample at 24m and 89% at 70m.
For comparison we also discuss here the 2Jy sample from our previous study. This sample consists of 46 powerful radio galaxies and steep-spectrum quasars () selected from the 2Jy sample of Wall & Peacock (1985) with redshifts 0.05 0.7. A full discussion of the selection and MFIR data reduction for this sample is published in D08 along with tables of MFIR fluxes and luminosities (D09). Note that two objects overlap between the 3CRR and 2Jy samples (3C403, 3C445).
In addition, published deep optical spectra have allowed us to identify the objects in the two samples with evidence for young stellar populations at optical wavelengths. The references for the stellar population analysis are given in Table 1.
3 The Origin of the mid- to far-IR emission
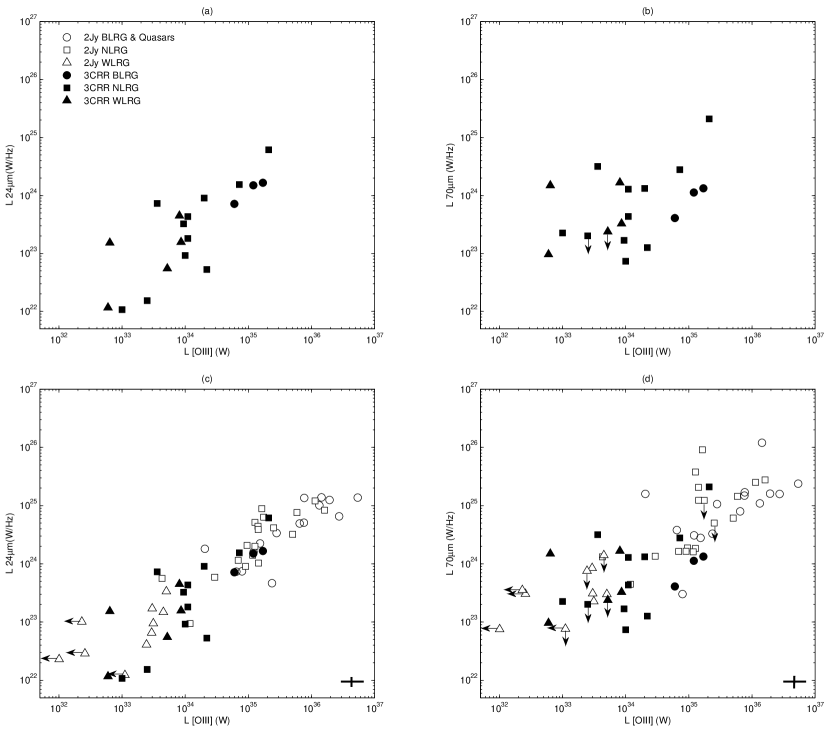
We first consider the 3CRR sample alone. In Figures 1 (a) and (b) we plot the and against for the 19 objects in the 3CRR sample. A visual inspection of Figure 1 (a) identifies a correlation between vs. . This correlation is statistically confirmed in Section 4 and is consistent with the results found previously for the 2Jy sample (D09). Such a correlation supports the hypothesis that the warm, 24m-emitting dust is heated by direct AGN illumination, assuming that the [OIII] luminosity is a good indicator of intrinsic radiative AGN power. Secondly, a visual inspection of Figure 1 (b), plotting vs. , reveals less correlation in the 3CRR data compared to the result at , also consistent with the results for the 2Jy sample (D09).
We compare these results with the 2Jy sample in Figures 1 (c) and (d) which show and plotted against for the 3CRR and 2Jy samples plotted together.
Firstly, Figure 1 (c) ( vs. ) reveals a strong correlation for the combined sample, with good continuity between the 3CRR and 2Jy samples at the low luminosity end of the correlation. Secondly, plotting vs. for the combined sample also reveals a strong correlation, that is not apparent when plotting the 3CRR sample alone. Again these correlations are confirmed, statistically, in Section 4.
However, there is notable additional scatter in the vs. correlation compared to that involving . The crosses in the bottom right corners of Figures 1 (c) and (d) show the maximum error for the points, demonstrating that the scatter is real and not purely a consequence of observational uncertainties (discussed further in section 5). In this context, the apparent lack of a correlation between and for the 3CRR sample alone is plausibly explained in terms of a combination of the high intrinsic scatter of the vs. correlation and the small redshift and [OIII] luminosity range of the 3CRR sample.
4 Correlation statistics
The high rate of Spitzer detections at MFIR wavelengths for the two samples allows us to conduct statistical tests on the significance of the correlations, discussed in the previous section and presented in Figure 1, using the Spearman rank correlation coefficient. However, although the overall detection rate is high for the observations of the two samples it is important to consider the effect of the 7 remaining upper limits in 70m luminosity and 4 upper limits in the [OIII] emission line luminosity.
In order to remove the effect on the statistical tests of the 4 upper limits in [OIII], the 2Jy sample is limited to 0.06 and one object with an upper limit in [OIII] (PKS1839-48) was removed, leaving 38 of the original 46 2Jy objects. In addition, we applied a bootstrap method for dealing with six remaining 70m upper limits. For this we replaced the upper limits with 70m fluxes derived using the measured 24m flux of each object and a 70m/24m flux ratio chosen at random from the distribution of measured flux ratios for the detected sample objects. These 70m estimates were then converted to luminosities and included in the rank correlation test. This process was repeated 1000 times and the median of the correlation coefficients for those cycles was used for the correlation statistics involving 70m (see D09 for further details). Also, for the purposes of comparison, we investigated the correlations with upper limits using the ASURV (Isobe et al., 1986; Lavalley et al., 1992) package implemented in IRAF, including all upper limits in [OIII]. The survival analysis statistics used in ASURV have been acknowledged as a powerful tool for analyzing samples with upper or lower limits.
| Rank Correlation | (3CRR) | significance | (3CRR2Jy) | significance | (ASURV) | significance |
|---|---|---|---|---|---|---|
| (1) vs. | 0.74 | % | 0.89 | % | 0.90 | % |
| (2) vs. | 0.3 | % | 0.77 | % | 0.76 | % |
| Partial rank correlation with z | ||||||
| (3) vs. | 0.78 | % | ||||
| (4) vs. | 0.47 | % | ||||
Note. — Results of various Spearman rank correlation statistics for the 3CRR plus the combined 3CRR and 2Jy sample for the correlations presented in Figure 1. Values of are given for each test, where a value close to 1 is highly significant. Columns 2 and 3 present the statistics for the 3CRR sample alone. Columns 4 and 5 present the statistics for the combined 2Jy and 3CRR sample undertaken with a limited sample 0.06 for the 2Jy sample, but including all the 3CRR sample; in this test the remaining upper limits were handled in a bootstrap method described in Section 4. Columns 6 and 7 present statistics for all the objects in the combined sample, handling the upper limits using survival analysis statistics.
The results of the Spearman rank tests for the correlations shown in Figure 1 are presented in Table 3. As well as the percentage levels of significance, we also present the statistic, where a value of close to 1 is rated highly significant.
First, considering the 3CRR sample alone (Columns 2-3), we find that the vs. correlation is highly significant: we reject the null hypothesis that the variables are unrelated at a 99.5% level. On the other hand, the vs. correlation for the 3CRR sample alone is the least significant correlation we have examined: we only reject the null hypothesis that the variables are unrelated at a 80% level. The additional scatter in the correlation between vs. is further discussed in Sections 5.1 and 6.
Inspecting the results for the combined 3CRR and 2Jy sample presented in Columns 4 and 6 of Table 3 we find that all the tests show a correlation significance of better than 99.9%, and the ASURV results reinforce those obtained using the bootstrap technique outlined above. These combined sample statistical tests strongly support the relation between the thermal MFIR emission and the [OIII] emission in radio galaxies for a broad range of redshift and radio powers. Because we believe that the [OIII] emission is a good indicator of AGN power, the combined 3CRR and 2Jy sample statistical results provide some of the strongest empirical evidence to date that the dominant heating mechanism for the MFIR continuum emission dust is AGN illumination.
Moreover, the second part of Table 3 (rows 3 and 4) shows the results of a Spearman partial rank correlation test. This tests the hypothesis that the correlations are not intrinsic but arise because and are independently correlated with redshift. However in both cases the null hypothesis that the variables are unrelated is still rejected at the 99.5% level of significance.
5 Origin of the Far-Infrared Emission
We now consider the cause of the additional scatter in the correlations in the far-IR 70m luminosities. In particular, it is important to consider whether starbursts heat the cool dust that radiates at far-infrared wavelengths, since morphological evidence suggests that at least some powerful radio galaxies are triggered in major gas rich galaxy mergers (e.g. Heckman et al., 1986). Such mergers are predicted to be associated with powerful starbursts (e.g. di Matteo et al., 2005). Moreover, understanding the connection between starbursts and AGN is important for the interpretation of sub-millimeter observations in the context of the star formation history of radio-loud AGN at high redshift (Archibald et al., 2001).
5.1 Evidence for starburst heating in the far-IR continuum
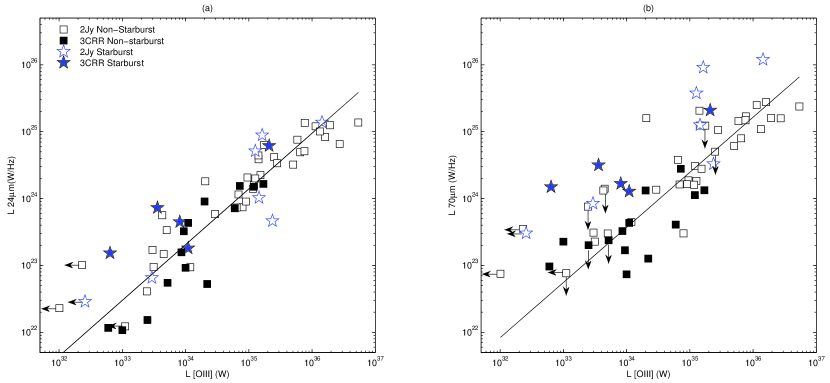
By using results from our own spectral synthesis modeling work, as well as the literature, we have identified objects in both the samples that show clear evidence for recent star formation activity at optical wavelengths111In the following discussion we will label these objects as optical starbursts. However, we emphasize that while some of these objects do contain genuine, current, starburst activity, others are in fact in a post-starburst phase. See Tadhunter et al. (2005); Holt et al. (2007); Wills et al. (2008) for further discussion. (see Table 1 for 3CRR and D09 for the 2Jy sample). Therefore, in Figure 2 we plot the and data against for the combined 3CRR and 2Jy sample, in this case highlighting the 12 objects in the two samples that have been identified as having optical starbursts. It is evident from a visual inspection of Figure 2 that much of the additional scatter in the vs. correlation compared to the vs. correlation is a consequence of enhanced far-IR emission in the optical starburst objects. This confirms the result for the 2Jy sample presented in T07 and D09, using an increased sample of starburst radio galaxies (a total of 12 optical starburst objects compared with the 7 in the 2Jy sample alone).
In order to evaluate the degree of enhancement in the far-IR emission above the main correlation, we have fitted regression lines on both plots (a) and (b) in Figure 2. The lines shown are the bisectors for objects without optical starburst of a linear least squares fits of on and on (See Figure 2 for details). On the 70m plot in Figure 2 (b) it can be seen that 11 out of 12 of the optical starburst objects lie more than 0.3 dex (i.e. a factor of 2) above the regression line.
We have also used a one dimensional Kolmogorov-Smirnoff (K-S) two sample test to compare the cumulative distributions of the vertical displacements from the fitted regression line in the vs. plot (Figure 2). The test calculates the probability that the starburst and non-starburst objects are drawn from the same distribution. The null hypothesis that the optical starburst and non-optical starburst are draw from the same parent population is rejected at a better than 0.01% level. This result further supports our interpretation that the far-infrared emission is boosted in the optical starburst objects.
5.2 Color differences at low redshifts
A detailed inspection of the vs. plots in Figures 1 (d) and 2 (b), identifies the six objects that lie on the bottom edge of the correlation (NLRG: 3C98, 3C192; BLRG:3C227, 3C382, 3C390.3, 3C445), the latter are displaced by 1-3 based on the distribution of the residuals from the fitted regression line. The amount by which these objects lie below the regression line is much less than that by which the starburst objects are boosted above the correlation. However, it is interesting that these objects are all at low redshift 0.09 and all (apart from 3C192) have much warmer colors than the rest of the objects in the 3CRR and 2Jy samples. Intriguingly, this group includes all four of the objects in the original papers that defined BLRG as a class (Osterbrock & Miller, 1975 and Osterbrock et al., 1976) and notably all three of the broad line objects in the 3CRR sample.
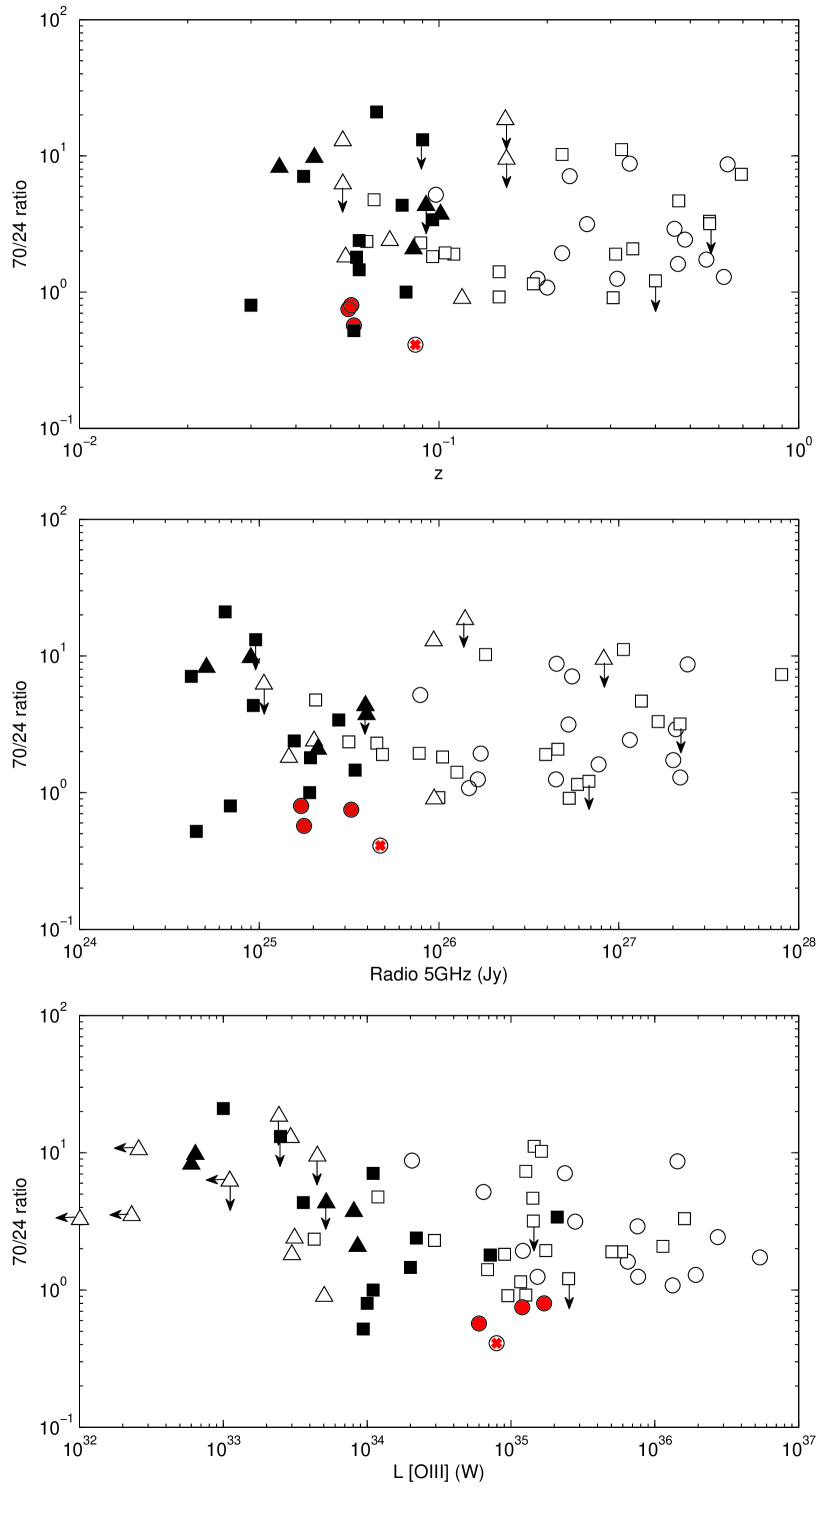
In Figure 3 we present the 70m/24m color vs. redshift, and for the 3CRR and 2Jy samples. In this figure we have marked in red the 4 BLRG that lie 12 below the correlation between and . These 4 objects also have warm colors; compared to a median of . To begin with, Figure 3 shows clearly that the 3CRR sample objects have, on average, lower redshifts and radio powers than the 2Jy sample. However, it is interesting that the 4 BLRG with warm colors all tend to higher luminosity than all but two (3C321, 3C403) of the low redshift 3CRR objects. Indeed, the fact that these objects tend to higher [OIII] emission than objects of similar redshift and radio luminosity explains their position under the correlation between and . In addition, the fact that the BLRG do not fall below the vs. correlation is explained by an enhancement in their 24m emission as well as that in their [OIII] emission. This is consistent with their warm colors (see Fig 3), and the tendency of their Spitzer IRS spectra to peak at around 24m (Dicken et al. 2010 in prep).
6 Discussion
6.1 Origin of the mid- and far-infrared emission
From the plots of [OIII] emission line vs. MFIR luminosities, as well as from thorough statistical analysis, we have shown that the origin of the MFIR emission in 3CRR radio galaxies is most likely AGN illumination of the thermal emitting dust for the majority of objects.
Considering the far-IR (cool dust) there are two main heating mechanism candidates: AGN illumination and starburst heating. However, the similar slopes of the 24 and 70m correlations (gradients of the fitted regression lines are 0.83 0.05 and 0.82 0.08 for 24m and 70m respectively222The slopes calculations do not include the identified optical starburst objects.) presented in Figure 2 indicate a common heating mechanism, for the warm and cool MFIR emitting dust components, i.e. AGN illumination. This is consistent with models that are capable of producing the broad MFIR SEDs by AGN illumination of near-nuclear clumpy tori (Nenkova et al., 2002, 2008). Alternatively, we showed in D09 that it is possible to account for the observed far-IR emission from the re-radiation of AGN illuminated narrow line clouds. Such a scenario is attractive as it does not require special or complex torus geometries for the circum-nuclear dust structures.
Many previous studies have acknowledged the benefits of a statistical approach to understanding the origin of the thermal MFIR emission from radio-loud AGN, given the impossibility of resolving the MFIR emitting dust structures in the majority of objects. Such investigations began with exploratory IRAS studies investigating the contributions of thermal and non-thermal emission (Neugebauer et al., 1986; Golombek et al., 1988; Knapp et al., 1990; Impey & Gregorini (1993)). However, it was the studies of Heckman et al. (1994) and Hes et al. (1995) that first provided evidence for a link between the MFIR emission and the AGN, finding 60m luminosities and extended radio luminosity to be correlated over 3 orders of magnitude. However, the detection rate in the far-IR of these IRAS observations was low (30%). Therefore Heckman et al. (1994) based their results on groups of objects averaged in redshift bins, and Hes et al. (1995) plotted only the objects that were detected. In further work Haas et al. (1998) suggested that the broad range of temperatures of dust emitting the MFIR emission argues in favor of AGN heating although this cannot rule out a starburst heating contribution. Subsequently, with ISO data, Haas et al. (2004) found the ratios of mid to far-infrared emission was higher for radio-loud AGN compared with ULIRGS. As AGN are likely to have hotter dust temperatures, this is consistent with, but does not prove, an AGN origin to the MFIR emission.
One of the first studies to take advantage of sensitive MFIR data from Spitzer was that by Shi et al. (2005). They found that a subset of the radio-loud AGN in their heterogeneous sample fall in the region of the MFIR color vs. [OIII]/H diagnostic diagram normally occupied by AGN (i.e. relatively warm colors and large [OIII/H, see Kewley et al. (2001)), thus providing evidence that the cool dust is heated by AGN illumination rather than by starbursts. In addition, Cleary et al. (2007) found a correlation between MFIR luminosity (corrected for non-thermal contamination) and low frequency radio luminosity, suggesting AGN heating of the dust, based on a sample of 33 intermediate-redshift 3CR radio galaxies with a relatively low detection rate at far-IR wavelengths (60%). The results we have presented are based on the combined 3CR and 2Jy complete sample of 63 objects with a 92% detection rate at 70m. Along with our previous work, these results strongly reinforce the idea that the heating of the cool, far-IR emitting dust in the majority of radio galaxies is dominated by AGN illumination.
6.2 Starburst contribution to the far-infrared emission
We have shown that the additional scatter above the main correlation between and seen in 3CRR sample is accounted for by starburst boosting of the 70m far-IR emission. This enhancement is not seen for optical starburst objects at 24m. The results from the 3CRR sample add statistical weight to our previous study with only 7 optical starburst objects in the 2Jy sample to 12 optical starburst objects in the combined 3CRR and 2Jy sample.
It is possible to estimate the rate of energetically significant starburst activity in the 2Jy and 3CRR samples by considering the main optical and infrared indicators of starbursts. The results are then: 12 (19%) of the objects in the combined sample show unambiguous spectroscopic evidence for recent star formation activity at optical wavelengths; 12 (19%) have cool MFIR colors (); 22 (35%) of the objects lie more than 0.3 dex (factor 2) about the regression line in the vs. correlation in Figure 2; and 22 objects (35%) show at least one of these indicators. Therefore an estimate of the proportion of powerful radio-loud AGN showing evidence for energetically significant recent star formation activity in the combined 2Jy plus 3CRR sample is in the range 1935%. This result is also consistent with the study of Shi et al. (2007), who find starburst tracing PAH features in only 2 of the 10 3CRR objects that overlap with the sample presented in this paper, and that of Fu & Stockton (2009) who do not find evidence for PAH features in any of the 12 objects in their FRII radio galaxies.
It is generally accepted that the dust producing the continuum emission at 24m in AGN is heated almost exclusively by AGN illumination. In order for the cool dust emitting in the far-IR to be dominated by starburst rather than AGN heating, a remarkable degree of coordination between AGN and starburst activity would be implied, given the strong correlations between , and , and the similarity between the slopes of the vs. and vs. correlations. Although such coordination cannot be entirely ruled out, we consider it less likely. It is a fact that only a minority of objects in the 2Jy and 3CRR samples show any evidence for recent star formation activity, therefore, the current phase of AGN activity seen in these objects is unlikely to be fueled by the gas flows that occur at the peaks of major gas-rich mergers.
6.3 Unified schemes
Thermal MFIR continuum emission can be used to test the orientation-based unified schemes for powerful radio sources (e.g. Barthel, 1989), under the assumption the MFIR emission is isotropic. For orientation-based unification to hold, correlations between MFIR emission and other isotropic wavelength emission such as low frequency radio or the [OIII], should reveal no differences between the relative positions of the different optical classes of objects. This tests the hypothesis that all the objects contain the same central engine, however, the optical classes arise because the optical emission is not emitted isotopically and can be obscured. In Figure 1 we have labelled the objects by their optical class as broad-line radio galaxies and quasars (BLRG/Q), narrow-line radio galaxies (NLRG) and weak line radio galaxies (WLRG)333see Tadhunter et al. (1998) for definition and D09 for further detailed discussion.. Applying such a test to the combined 3CRR and 2Jy sample in Figure 1 (c) and (d), in general, little difference between the MFIR luminosities of BLRG/Q compared to NLRG is found. This result is in contrast to studies based on lower sensitivity IRAS data (Heckman et al., 1994, Hes et al., 1995), which suggested that BLRG/Q have enhanced MFIR emission compared with NLRG objects of similar radio power.
However, as discussed above, it is apparent that all three 3CRR BLRGs and one of the two BLRG in the 2Jy sample with 0.1444Of the 5 low redshift ( 0.1) BLRG in the combined sample, only PKS1733-56 ( 0.098) falls above the correlation. However this object has a significant starburst component, as indicated by the detection of strong PAH features in its mid-IR spectrum (Dicken et al. 2010). lie below the correlation between and . On the basis of Figure 3 it is likely that this displacement is due to their relatively strong [OIII] emission and not sub-luminous 70m emission. The fact that this group of low- BLRG falls within the main body of the points in the vs. correlation is consistent with anisotropic [OIII] emission, provided that the 24m emission is also enhanced in these objects by a similar degree to the [OIII]. Such enhancement is consistent with the warm colors of the low- BLRG, as well as the tendency of their Spitzer IRS spectra to peak at around 24m (Dicken et al. 2010 in prep).
In order to reconcile the position of the low- BLRG in the MFIR correlation plots with the orientation-based unified schemes, both the [OIII] emission and the 24m emission must be anisotropic, and subject to significant dust extinction by the torus. Such anisotropy in mid-infrared emission above 15m has been seen for Seyfert galaxies when comparing the data from type 1 to type 2 (Buchanan et al., 2006). The required degree of anisotropy for the [OIII] emission is a factor of 37. In this case, a significant proportion of the [OIII] emission must be emitted on a relatively small (pc) scale in these objects. For at least one of the low- BLRG 3C390.3 such a small scale for the NLR is supported by the evidence for significant variability in the narrow line CIV and [OIII] emission on a timescale of a few years (Clavel & Wamsteker, 1987; Zheng et al., 1995).
The fact that there is no difference between the relative positions of higher redshift (0.1) BLRG/Q and NLRG in the of [OIII] emission line vs. MFIR luminosities plots supports the assumption that the [OIII] emission is isotropic for these objects in the combined sample. However, there is some evidence for mild anisotropy in the [OIII] emission of the – generally higher redshift – BLRG/Q in the 2Jy sample as discussed in detail in D09. However, the displacement for the 2Jy BLRG/Q below the vs. correlation is not statistically significant (D09). Such a difference could reflect a change in the properties of the torus and/or the spatial distribution of the NLR gas with the luminosity of the AGN.
van Bemmel & Barthel (2001) compared ISO and IRAS photometric properties of 10 BLRG, with those of a heterogeneous sample of 5 NLRG detected by IRAS. They found that 7 of the BLRG objects have warm MFIR colors with continuum spectra peaking around 24m, and explained this in terms of the BLRG objects lacking a cool dust components in the far-infrared — an explanation supported by the apparent lack of morphological features due to dust in the BLRG relative to the NLRG in optical HST images555Note, however, that the NLRG sample of van Bemmel & Barthel (2001) is heterogeneous and, even with the spatial resolution of the HST, it is difficult to detect near-nuclear dust features in the BLRG because, unlike the NLRG, they have luminous point-like nuclei at optical wavelengths.. If correct, this explanation would be inconsistent with the simplest versions of the orientation-based unified schemes, since it would imply that BLRG represent a separate class of radio-loud AGN that lack dust or, alternatively, a later evolutionary phase in the evolution of radio-loud AGN population. Based on the results presented in this paper (in particular, Figures 1 and 3), we feel that anisotropic [OIII] and 24m emission is a more plausible explanation for the differences between the properties of the low- BLRG and NLRG.
Unfortunately, the number of low- BLRG in our sample is small. To further investigate the apparently unusual MFIR properties of such objects, it will be important in the future to study observations of a larger sample, and also examine their mid-infrared spectra in more detail.
7 Conclusions
In this paper we have investigated MFIR observations of a sample of 19 3CRR radio galaxies. The main conclusions are as follows.
-
•
From the statistical analysis of the 3CRR sample, correlating MFIR luminosities with the AGN power indicator [OIII], we conclude that the dominant heating mechanism for mid-IR emitting dust is AGN illumination. This result is consistent with our previous work based on the 2Jy sample of southern radio galaxies. Moreover, based on our analysis of the combined 2Jy and 3CRR sample, we conclude that the dominant heating mechanism for the cooler, far-IR emitting dust is also likely to be AGN illumination in the majority of radio-loud AGN.
-
•
Following the indications of previous work we have investigated whether additional scatter in the [OIII] vs. 70m luminosity correlation for 3CRR objects is a consequence of starburst heating which boosts the far-IR emission in some objects. We find that this is indeed the case for the 12 optically identified starburst objects in the combined 2Jy and 3CRR sample. We conclude that starburst heating of the far-IR emitting dust is important in only 1735% of objects.
-
•
Although we find no statistically significant differences between the properties of the BLRG/Q and NLRG for the joint 2Jy and 3CRR sample, or the 2Jy sample alone, we note that all the classical BLRG in our 3CRR sample at 0.1 show evidence for enhanced [OIII] emission and warmer MFIR colors compared with the majority of NLRG at similar redshifts. This suggests that torus-induced anisotropy in [OIII] and 24m emission may be more significant in powerful radio galaxies at low redshifts than in their higher redshift counterparts. However, larger samples, along with a more detailed comparisons between the mid-IR spectra of BLRG and NLRG, are required to put this result on a firmer footing.
References
- Archibald et al. (2001) Archibald, E. N., Dunlop, J. S., Hughes, D. H., Rawlings, S., Eales, S. A., & Ivison, R. J. 2001, MNRAS, 323, 417
- Aretxaga et al. (2001) Aretxaga, I., Terlevich, E., Terlevich, R. J., Cotter, G., & Díaz, Á. I. 2001, MNRAS, 325, 636
- Barthel (1989) Barthel, P. D. 1989, ApJ, 336, 606
- Buchanan et al. (2006) Buchanan, C. L., Gallimore, J. F., O’Dea, C. P., Baum, S. A., Axon, D. J., Robinson, A., Elitzur, M., & Elvis, M. 2006, AJ, 132, 401
- Buttiglione et al. (2009) Buttiglione, S., Capetti, A., Celotti, A., Axon, D. J., Chiaberge, M., Macchetto, F. D., & Sparks, W. B. 2009, A&A, 495, 1033
- Clark (1996) Clark, N. 1996, PhD thesis, University of Sheffield
- Clavel & Wamsteker (1987) Clavel, J., & Wamsteker, W. 1987, ApJ, 320, L9
- Cleary et al. (2007) Cleary, K., Lawrence, C. R., Marshall, J. A., Hao, L., & Meier, D. 2007, ApJ, 660, 117
- di Matteo et al. (2005) di Matteo, P., Capuzzo Dolcetta, R., & Miocchi, P. 2005, Celestial Mechanics and Dynamical Astronomy, 91, 59
- Fu & Stockton (2009) Fu, H., & Stockton, A. 2009, ApJ, 696, 1693
- Golombek et al. (1988) Golombek, D., Miley, G. K., & Neugebauer, G. 1988, AJ, 95, 26
- Haas et al. (1998) Haas, M., Chini, R., Meisenheimer, K., Stickel, M., Lemke, D., Klaas, U., & Kreysa, E. 1998, ApJ, 503, L109+
- Haas et al. (2004) Haas, M., Müller, S. A. H., Bertoldi, F., Chini, R., Egner, S., Freudling, W., Klaas, U., Krause, O., Lemke, D., Meisenheimer, K., Siebenmorgen, R., & van Bemmel, I. 2004, A&A, 424, 531
- Heckman et al. (1992) Heckman, T. M., Chambers, K. C., & Postman, M. 1992, ApJ, 391, 39
- Heckman et al. (1994) Heckman, T. M., O’Dea, C. P., Baum, S. A., & Laurikainen, E. 1994, ApJ, 428, 65
- Heckman et al. (1986) Heckman, T. M., Smith, E. P., Baum, S. A., van Breugel, W. J. M., Miley, G. K., Illingworth, G. D., Bothun, G. D., & Balick, B. 1986, ApJ, 311, 526
- Hes et al. (1995) Hes, R., Barthel, P. D., & Hoekstra, H. 1995, A&A, 303, 8
- Holt et al. (2007) Holt, J., Tadhunter, C. N., González Delgado, R. M., Inskip, K. J., Rodriguez, J., Emonts, B. H. C., Morganti, R., & Wills, K. A. 2007, MNRAS, 381, 611
- Impey & Gregorini (1993) Impey, C., & Gregorini, L. 1993, AJ, 105, 853
- Isobe et al. (1986) Isobe, T., Feigelson, E. D., & Nelson, P. I. 1986, ApJ, 306, 490
- Kewley et al. (2001) Kewley, L. J., Heisler, C. A., Dopita, M. A., & Lumsden, S. 2001, ApJS, 132, 37
- Knapp et al. (1990) Knapp, G. R., Bies, W. E., & van Gorkom, J. H. 1990, AJ, 99, 476
- Laing et al. (1983) Laing, R. A., Riley, J. M., & Longair, M. S. 1983, MNRAS, 204, 151
- Lavalley et al. (1992) Lavalley, M., Isobe, T., & Feigelson, E. 1992, in Astronomical Society of the Pacific Conference Series, Vol. 25, Astronomical Data Analysis Software and Systems I, ed. D. M. Worrall, C. Biemesderfer, & J. Barnes, 245–+
- Morris & Ward (1988) Morris, S. L., & Ward, M. J. 1988, MNRAS, 230, 639
- Nenkova et al. (2002) Nenkova, M., Ivezić, Ž., & Elitzur, M. 2002, ApJ, 570, L9
- Nenkova et al. (2008) Nenkova, M., Sirocky, M. M., Nikutta, R., Ivezić, Ž., & Elitzur, M. 2008, ApJ, 685, 160
- Neugebauer et al. (1986) Neugebauer, G., Miley, G. K., Soifer, B. T., & Clegg, P. E. 1986, ApJ, 308, 815
- O’Dea et al. (2001) O’Dea, C. P., Koekemoer, A. M., Baum, S. A., Sparks, W. B., Martel, A. R., Allen, M. G., Macchetto, F. D., & Miley, G. K. 2001, AJ, 121, 1915
- Osterbrock et al. (1976) Osterbrock, D. E., Koski, A. T., & Phillips, M. M. 1976, ApJ, 206, 898
- Osterbrock & Miller (1975) Osterbrock, D. E., & Miller, J. S. 1975, ApJ, 197, 535
- Pier & Krolik (1992) Pier, E. A., & Krolik, J. H. 1992, ApJ, 401, 99
- Rawlings & Saunders (1991) Rawlings, S., & Saunders, R. 1991, Nature, 349, 138
- Robinson (2001) Robinson, A. 2001, PhD thesis, University of Sheffield
- Rowan-Robinson (1995) Rowan-Robinson, M. 1995, MNRAS, 272, 737
- Saunders et al. (1989) Saunders, R., Baldwin, J. E., Rawlings, S., Warner, P. J., & Miller, L. 1989, MNRAS, 238, 777
- Schweitzer et al. (2006) Schweitzer, M., Lutz, D., Sturm, E., Contursi, A., Tacconi, L. J., Lehnert, M. D., Dasyra, K. M., Genzel, R., Veilleux, S., Rupke, D., Kim, D.-C., Baker, A. J., Netzer, H., Sternberg, A., Mazzarella, J., & Lord, S. 2006, ApJ, 649, 79
- Shi et al. (2007) Shi, Y., Ogle, P., Rieke, G. H., Antonucci, R., Hines, D. C., Smith, P. S., Low, F. J., Bouwman, J., & Willmer, C. 2007, ApJ, 669, 841
- Shi et al. (2005) Shi, Y., Rieke, G. H., Hines, D. C., Neugebauer, G., Blaylock, M., Rigby, J., Egami, E., Gordon, K. D., & Alonso-Herrero, A. 2005, ApJ, 629, 88
- Simpson (1998) Simpson, C. 1998, MNRAS, 297, L39
- Tadhunter (1986) Tadhunter, C. 1986, PhD thesis, University of Sussex
- Tadhunter et al. (2005) Tadhunter, C., Robinson, T. G., González Delgado, R. M., Wills, K., & Morganti, R. 2005, MNRAS, 356, 480
- Tadhunter et al. (1996) Tadhunter, C. N., Dickson, R. C., & Shaw, M. A. 1996, MNRAS, 281, 591
- Tadhunter et al. (1998) Tadhunter, C. N., Morganti, R., Robinson, A., Dickson, R., Villar-Martin, M., & Fosbury, R. A. E. 1998, MNRAS, 298, 1035
- van Bemmel & Barthel (2001) van Bemmel, I., & Barthel, P. 2001, A&A, 379, L21
- Wall & Peacock (1985) Wall, J. V., & Peacock, J. A. 1985, MNRAS, 216, 173
- Wills et al. (2008) Wills, K. A., Tadhunter, C., Holt, J., González Delgado, R., Inskip, K. J., Rodríguez Zaurín, J., & Morganti, R. 2008, MNRAS, 385, 136
- Wills et al. (2002) Wills, K. A., Tadhunter, C. N., Robinson, T. G., & Morganti, R. 2002, MNRAS, 333, 211
- Zheng et al. (1995) Zheng, W., Perez, E., Grandi, S. A., & Penston, M. V. 1995, AJ, 109, 2355