Heterogeneous diversity of spacers within CRISPR
Abstract
Clustered regularly interspaced short palindromic repeats (CRISPR) in bacterial and archaeal DNA have recently been shown to be a new type of anti-viral immune system in these organisms. We here study the diversity of spacers in CRISPR under selective pressure. We propose a population dynamics model that explains the biological observation that the leader-proximal end of CRISPR is more diversified and the leader-distal end of CRISPR is more conserved. This result is shown to be in agreement with recent experiments. Our results show that the CRISPR spacer structure is influenced by and provides a record of the viral challenges that bacteria face.
pacs:
91.62.Gk,87.10.-e, 87.23.Kg, 87.23.CcClustered regularly interspaced short palindromic repeats (CRISPR) in bacteria and archaea have recently been suggested to provide adaptable immunity in these organisms Barrangou et al. (2007); Brouns et al. (2008); Deveau et al. (2008). A typical CRISPR system is composed of CRISPR-associated (Cas) genes and a CRISPR-cassette Jansen et al. (2002); Bolotin et al. (2005); Pourcel et al. (2005). A CRISPR-cassette is formed by nearly identical repeats of 24–47 bp long nucleotides separated by similar sized, unique spacers. Repeats are nearly but not completely palindromic, which leads to relatively stable RNA secondary structures transcribed from the repeats. The CRISPR are commonly followed by a conserved AT-rich sequence known as the leader. The leader appears to promote transcription towards the repeats, generating the RNAs that constitute the molecular basis of the CRISPR interference action. Recent studies have proposed that CRISPR and Cas genes function as an anti-viral defense. A considerable fraction of spacer sequences are found to be similar to known phage sequences, that is sequences of viruses which infect bacteria, indicating that the spacer sequences may derive from phages Bolotin et al. (2005). Moreover, when bacteria that possess the CRISPR-Cas system are exposed to phage, the surviving individuals appear to have new virus-derived sequences at the leader-proximal end of CRISPR loci Barrangou et al. (2007); Deveau et al. (2008). Further, the acquisition or loss of CRISPR elements or of Cas protein genes has been directly correlated with phage and plasmid resistance or sensitivity, respectively Barrangou et al. (2007); Deveau et al. (2008); Brouns et al. (2008). The CRISPR system has begun to attract a large amount of attention due to its immune function and its potential role in restricting horizontal gene transfer Sorek et al. (2008); Marraffini and Sontheimer (2008). Because the CRISPR system directly targets nucleotide sequence, it can prevent horizontal gene transfer by phage transduction, transformation, or conjugation Marraffini and Sontheimer (2008). The CRISPR system also functions as an immune system to select against phage Horvath and Barrangou (2010), and it is this function upon which we focus in this Letter.
Recent experiments have demonstrated that the probability with which different individuals share the same spacer at the same position varies with location in the CRISPR system in populations of bacteria and archaea Tyson and Banfield (2008); Andersson and Banfield (2008). However, the mechanism by which the phage-bacteria interaction shapes the spacer structure is poorly understood. In this paper, we propose a model that describes why the newly added spacers are more diversified and the old spacers are more conserved due to selective pressure on the CRISPR system. This model expresses an underlying mechanism that shapes the spacer structure. Solution of this model shows that diversity of CRISPR spacers decreases with distance from the leader sequence.
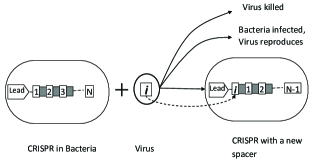
We describe the CRISPR-phage dynamics schematically in Fig. 1. When bacteria are exposed to phage viruses, there are three possible scenarios: bacteria are infected, viruses are defended, or bacteria acquire new spacers. In Fig. 1, the bacteria incorporate a piece of the phage DNA represented by the letter ‘i’ into its own genome as a new spacer. New spacers are always added to the leader-proximal end Horvath and Barrangou (2010). To avoid infinite growth of CRISPR, an old spacer is dropped when CRISPR is longer than a certain length Tyson and Banfield (2008). The CRISPR system provides an immune response. After insertion of exogenous DNA from phages or plasmids, the CRISPR spacers are transcribed and processed to CRISPR RNA units. The CRISPR RNA units serve as templates to recognize foreign nucleotide sequence. If any of the CRISPR RNA units match the phage-derived sequences, the phage genetic material is degraded by bacteria. If none of CRISPR RNA units matches the phage-derived sequences, the bacteria are likely to be infected by the phage, and the phages will reproduce. When bacteria divide, the CRISPR are copied to the daughter cells Karginov and Hannon (2010).
We use a population dynamics model to describe the bacteria-virus community. We assume only one CRISPR locus for each bacteria individual. We first consider a simple case in which there are no more than two spacers for each CRISPR locus. By the first spacer, we mean the spacer that is nearest to the leader sequence. The second spacer is the spacer that is the next nearest to the leader sequence. We consider the following system of ordinary differential equations:
| (1) | |||
| (2) |
There are two variables in the above equations: is the population of virus strain , and is the population of bacteria with CRISPR with spacers and . The first spacer recognizes virus strain and the second spacer recognizes virus strain . In the absence of phage infection, the bacterial growth is exponential at rate . The term represents the bacteria with spacers of type and infected by viruses strains other than or . Bacteria can be infected or killed when they are exposed to viruses that bacteria do not recognize by CRISPR. The exposure rate of bacteria to virus is . The term represents the process of the converting other types of bacteria into bacteria of type . When bacteria of type incorporate virus of strain into their own genome and add a new spacer, bacteria type are converted to type . The probability of adding a new spacer when a bacteria is exposed to a virus is . In the absence of resistance from CRISPR, viral growth is exponential at rate . The term represents the degradation of viruses by bacteria. If any spacers of bacteria of type match viruses of strain , the bacteria degrade the viruses. The Kronecker delta function is 1 if spacer type matches virus strain ; otherwise, it is 0. This model is modified from the classic immune response model with antigenic variation Nowak and May (2000). In this model, we take only the essential factors into consideration. We do not distinguish the lysis and lysogeny cycle. Horizontal gene transfer is not considered. Furthermore, because viruses usually have more than one type of host to infect, viral growth is not limited by the abundance of one specific type of target bacteria Nowak and May (2000); Andersson and Banfield (2008).
Solution of the model shows that the diversity of the old spacer decreases upon challenge by viruses. We solve the differential equations by a standard numerical Runge-Kutta method. The initial value for the differential equations are naive bacteria whose CRISPR provide no resistance to viruses because their spacers are empty. The population of bacteria initially drops rapidly. Some bacteria acquire spacers from viruses and therefore develop resistance. By this means, the population of bacteria is steadily recovered. We measure the diversity of spacers by the Shannon entropy:
| (3) | |||
| (4) | |||
| (5) |
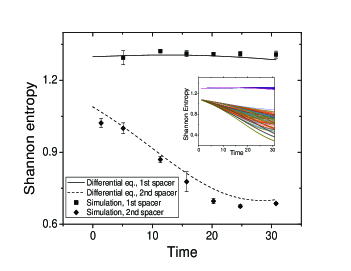
Here, and are the diversity for the first and second spacers. Because new spacers are always added to the leader-proximal end, the first spacer is “younger” than the second spacer. If there is no selective pressure on CRISPR, or CRISPR do not provide resistance against viruses, the diversity of spacers along CRISPR should be homogeneous, , because adding and deleting spacers is completely random. With the selective pressure on CRISPR to evolve resistance to phage, we observe a decline of diversity of the second spacer, as shown in Fig. 2. At the beginning, both positions have high diversity of spacers. With the continuous challenge of viruses and selective pressure for the effective resistance against viruses, the diversity of spacers at the second position decreases with time. When steady state is reached after some time, we observe that the diversity of spacers at the second position is lower than that at the first spacer.
Our observation is true for a broad choice of parameters. The parameter space was explored by using the statistical technique of Latin hypercube sampling (LHS). LHS selects combinations of parameter values from parameter value range and probability distribution function. In the insert of Fig. 2, we observe that diversity of the old spacer is decreasing and the diversity of the young spacer is nearly constant over time for all samplings.
Selection for bacteria that contain the most effective spacers decreases the diversity of the old spacer. The bacteria randomly take virus genomes from the environment and incorporate a corresponding spacer. Therefore, the diversity of the first spacer approaches the diversity of viruses in the environment. If the spacers match the dominant virus strain, bacteria containing these spacers are more likely to survive, and therefore spacers that match dominant viruses accumulate in the CRISPR. Bacteria that contain unused spacer elements that provide little protective potency are more likely to be infected by phage. The spacers corresponding to the dominant virus strain are enhanced and accumulate at the second spacer position. In other words, if neither the first nor second spacer matches the dominant viral strain, the bacteria is likely to be eliminated. If only the first spacer matches the dominant strain, after the next spacer incorporation, the matching spacer becomes the second spacer. For these two reasons, the diversity of the second spacer is lower than that of the first. The diversity of the second spacer is a function of the viral population diversity and the fitness pressure of the viruses upon the bacteria.
We seek to identify finite size effects by a stochastic simulation. We use the Lebowitz-Gillespie algorithm to sample the Markov process with the rates as described in Eqs. (1–2). for the bacteria and virus populations. Each bacteria and each virus is individually tracked. Viruses are represented as bit-strings. Each bit has two alleles, designated as a “1” or “0.” In the simulation, the length of virus strings are ; therefore genotypes are available for viruses. For bacteria, we the consider CRISPR locus only. Each spacer is bits long Karginov and Hannon (2010), the same size as viruses. The simulation starts with a population of viruses of different genotypes and bacteria without spacers in CRISPR locus. Viruses infect bacteria with a contact rate . If any spacer of a bacterium matches the infecting virus, the virus is killed. Otherwise, the bacterium is infected and dies. Bacteria and viruses reproduce at rate and respectively. Bacteria add a new spacer with a rate from contacting virus. We show in Fig. 2 the simulation results falling along the infinite-population, mean-field results from solving the differential equations (1–2).
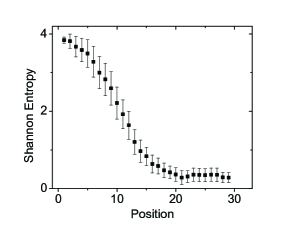
We further extend our individual-based simulation to allow the CRISPR to have more spacers, random loss of spacers, and mutation. Most CRISPR contain fewer than 50 repeat-spacer units. For example, the average number of spacers of Streptococcus thermophilus is 23 per CRISPR locus in one study Horvath et al. (2007). In our extended simulation, when the array of spacers of bacteria is longer than 30, a spacer is randomly deleted with probability proportional to its distance to the leader sequence. When viruses replicate, the mutation rate per sequence is . We perform mutation by randomly flipping one bit of the virus’s bit-string from “1” to “0” or from “0” to “1.” This extended simulation starts with a population of 150 virus genotypes and bacteria without spacers. The simulation runs until it reaches steady state. We run the simulation 100 times and average the results. After the simulation reaches steady state, we calculate the diversity of spacers for each position by Shannon entropy. In Fig. 3, we observe that the “young” spacers which are leader-proximal are highly diversified and that the “old” spacers which are leader-distal are more conserved.
These results support the following scenario: Infection by a novel viral genotype results in the lysis or weakening of most individuals, except those that are able to capture and incorporate a corresponding spacer into their CRISPR locus. Resistant individuals rapidly gain a selective advantage, leading to the fixation of the resistant spacer. Increasing polymorphism toward the leader-proximal end provides support that the CRISPR are an actively evolving and functioning phage defense mechanism.
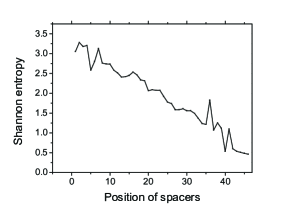
This model is in agreement with recent experiment results. Horvath et al. Horvath et al. (2007) sequenced the CRISPR regions of 124 S. thermophilus strains and analyzed 3626 spacers, 926 of which are unique. We aligned the spacers of CRISPR loci 1 for 124 strains. The Shannon entropy was calculated for each aligned position, see Fig. 4. Spacers at leader-proximal positions are more diverse and spacers at leader-distal positions are highly conserved across strains. For example, at the most leader-distal position, 34 of 124 strains share the identical spacer.
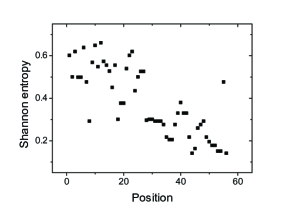
Recent metagenomic studies of environmental microbial samples provide a population-wide view of the dynamics between phage and CRISPR of the hosts Tyson and Banfield (2008); Andersson and Banfield (2008); Heidelberg et al. (2009). In one study, sequence data were assembled from biofilm community samples Tyson and Banfield (2008); Andersson and Banfield (2008). The CRISPR loci of the predominant Leptospirillum species display extensive polymorphism. We calculate the Shannon entropy for each position of CRISPR, see Fig. 5. The bacteria community shared spacer sequences at the leader-distal end of their CRISPR loci, while the leader-proximal end of the loci contained spacers that were mostly unique to each individuals. The decrease of diversity of spacers from leader-proximal end to leader-distal end supports a model in which highly plastic CRISPR loci continuously respond to challenge from a rapidly evolving pool of phage.
In summary, the CRISPR system provides adaptable immunity to bacteria and archaea. Bacteria continuously incorporate nucleotide material from phage genomes into CRISPR to gain resistance against phage infection. Viruses continuously perform nucleotide mutation and recombination to avoid being recognized. The coevolution interaction between viruses and the bacteria CRISPR system has shaped the spacer structure of the CRISPR locus. Recent experiments show a decline of diversity of spacers towards the leader-distal end, which our model suggests is a result of selection for the anti-phage protection conferred by the spacers and implies that the CRISPR is an active anti-viral system. That is, an underlying mechanism to shape the spacer structure is the selection of bacteria CRISPR systems that best match with viruses in the environment. CRISPR spacer structure is influenced by and provides a record of the viral challenges that bacteria face.
References
- Barrangou et al. (2007) R. Barrangou et al., Science 315, 1709 (2007).
- Brouns et al. (2008) S. J. J. Brouns et al., Science 321, 960 (2008).
- Deveau et al. (2008) H. Deveau et al., J. Bacteriol. 190, 1390 (2008).
- Jansen et al. (2002) R. Jansen, J. Embden, W. Gaastra, and L. Schouls, Mol. Microbiol. 43, 1565 (2002).
- Bolotin et al. (2005) A. Bolotin, B. Quinquis, A. Sorokin, and S. Ehrlich, Microbiology 151, 2551 (2005).
- Pourcel et al. (2005) C. Pourcel, G. Salvignol, and G. Vergnaud, Microbiology 151, 653 (2005).
- Marraffini and Sontheimer (2008) L. A. Marraffini and E. J. Sontheimer, Science 322, 1843 (2008).
- Sorek et al. (2008) R. Sorek, V. Kunin, and P. Hugenholtz, Nat. Rev. Microbiol. 6, 181 (2008).
- Horvath and Barrangou (2010) P. Horvath and R. Barrangou, Science 327, 167 (2010).
- Tyson and Banfield (2008) G. W. Tyson and J. F. Banfield, Environmental Microbiology 10, 200 (2008).
- Andersson and Banfield (2008) A. F. Andersson and J. F. Banfield, Science 320, 1047 (2008).
- Karginov and Hannon (2010) F. Karginov and G. Hannon, Molecular Cell 37, 7 (2010).
- Nowak and May (2000) M. Nowak and R. May, Virus Dynamics: The Mathematical Foundations of Immunology and Virology (Oxford Univ. Press, 2000).
- Horvath et al. (2007) P. Horvath et al., J. Bacteriol. pp. JB.01415–07 (2007).
- Heidelberg et al. (2009) J. F. Heidelberg, W. C. Nelson, T. Schoenfeld, and D. Bhaya, PLoS ONE 4, e4169 (2009).