K. Sakai
Niigata University, Niigata
T. Kawasaki
Niigata University, Niigata
H. Aihara
Department of Physics, University of Tokyo, Tokyo
K. Arinstein
Budker Institute of Nuclear Physics, Novosibirsk
Novosibirsk State University, Novosibirsk
T. Aushev
École Polytechnique Fédérale de Lausanne (EPFL), Lausanne
Institute for Theoretical and Experimental Physics, Moscow
A. M. Bakich
School of Physics, University of Sydney, NSW 2006
V. Balagura
Institute for Theoretical and Experimental Physics, Moscow
E. Barberio
University of Melbourne, School of Physics, Victoria 3010
K. Belous
Institute of High Energy Physics, Protvino
V. Bhardwaj
Panjab University, Chandigarh
B. Bhuyan
Indian Institute of Technology Guwahati, Guwahati
M. Bischofberger
Nara Women’s University, Nara
A. Bondar
Budker Institute of Nuclear Physics, Novosibirsk
Novosibirsk State University, Novosibirsk
A. Bozek
H. Niewodniczanski Institute of Nuclear Physics, Krakow
M. Bračko
University of Maribor, Maribor
J. Stefan Institute, Ljubljana
T. E. Browder
University of Hawaii, Honolulu, Hawaii 96822
M.-C. Chang
Department of Physics, Fu Jen Catholic University, Taipei
Y. Chao
Department of Physics, National Taiwan University, Taipei
A. Chen
National Central University, Chung-li
K.-F. Chen
Department of Physics, National Taiwan University, Taipei
P. Chen
Department of Physics, National Taiwan University, Taipei
B. G. Cheon
Hanyang University, Seoul
C.-C. Chiang
Department of Physics, National Taiwan University, Taipei
K. Cho
Korea Institute of Science and Technology Information, Daejeon
Y. Choi
Sungkyunkwan University, Suwon
J. Dalseno
Max-Planck-Institut für Physik, München
Excellence Cluster Universe, Technische Universität München, Garching
Z. Doležal
Faculty of Mathematics and Physics, Charles University, Prague
Z. Drásal
Faculty of Mathematics and Physics, Charles University, Prague
W. Dungel
Institute of High Energy Physics, Vienna
S. Eidelman
Budker Institute of Nuclear Physics, Novosibirsk
Novosibirsk State University, Novosibirsk
M. Feindt
Institut für Experimentelle Kernphysik, Karlsruher Institut für Technologie, Karlsruhe
B. Golob
Faculty of Mathematics and Physics, University of Ljubljana, Ljubljana
J. Stefan Institute, Ljubljana
H. Ha
Korea University, Seoul
J. Haba
High Energy Accelerator Research Organization (KEK), Tsukuba
K. Hayasaka
Nagoya University, Nagoya
H. Hayashii
Nara Women’s University, Nara
Y. Horii
Tohoku University, Sendai
Y. Hoshi
Tohoku Gakuin University, Tagajo
W.-S. Hou
Department of Physics, National Taiwan University, Taipei
H. J. Hyun
Kyungpook National University, Taegu
K. Inami
Nagoya University, Nagoya
R. Itoh
High Energy Accelerator Research Organization (KEK), Tsukuba
M. Iwabuchi
Yonsei University, Seoul
Y. Iwasaki
High Energy Accelerator Research Organization (KEK), Tsukuba
J. H. Kang
Yonsei University, Seoul
H. Kawai
Chiba University, Chiba
H. Kichimi
High Energy Accelerator Research Organization (KEK), Tsukuba
C. Kiesling
Max-Planck-Institut für Physik, München
H. J. Kim
Kyungpook National University, Taegu
J. H. Kim
Korea Institute of Science and Technology Information, Daejeon
Y. J. Kim
The Graduate University for Advanced Studies, Hayama
B. R. Ko
Korea University, Seoul
S. Korpar
University of Maribor, Maribor
J. Stefan Institute, Ljubljana
P. Križan
Faculty of Mathematics and Physics, University of Ljubljana, Ljubljana
J. Stefan Institute, Ljubljana
P. Krokovny
High Energy Accelerator Research Organization (KEK), Tsukuba
T. Kuhr
Institut für Experimentelle Kernphysik, Karlsruher Institut für Technologie, Karlsruhe
T. Kumita
Tokyo Metropolitan University, Tokyo
A. Kuzmin
Budker Institute of Nuclear Physics, Novosibirsk
Novosibirsk State University, Novosibirsk
Y.-J. Kwon
Yonsei University, Seoul
S.-H. Kyeong
Yonsei University, Seoul
J. S. Lange
Justus-Liebig-Universität Gießen, Gießen
M. J. Lee
Seoul National University, Seoul
J. Li
University of Hawaii, Honolulu, Hawaii 96822
A. Limosani
University of Melbourne, School of Physics, Victoria 3010
C. Liu
University of Science and Technology of China, Hefei
D. Liventsev
Institute for Theoretical and Experimental Physics, Moscow
R. Louvot
École Polytechnique Fédérale de Lausanne (EPFL), Lausanne
A. Matyja
H. Niewodniczanski Institute of Nuclear Physics, Krakow
S. McOnie
School of Physics, University of Sydney, NSW 2006
K. Miyabayashi
Nara Women’s University, Nara
H. Miyata
Niigata University, Niigata
Y. Miyazaki
Nagoya University, Nagoya
G. B. Mohanty
Tata Institute of Fundamental Research, Mumbai
D. Mohapatra
IPNAS, Virginia Polytechnic Institute and State University, Blacksburg, Virginia 24061
E. Nakano
Osaka City University, Osaka
M. Nakao
High Energy Accelerator Research Organization (KEK), Tsukuba
Z. Natkaniec
H. Niewodniczanski Institute of Nuclear Physics, Krakow
S. Neubauer
Institut für Experimentelle Kernphysik, Karlsruher Institut für Technologie, Karlsruhe
S. Nishida
High Energy Accelerator Research Organization (KEK), Tsukuba
O. Nitoh
Tokyo University of Agriculture and Technology, Tokyo
S. Ogawa
Toho University, Funabashi
T. Ohshima
Nagoya University, Nagoya
S. Okuno
Kanagawa University, Yokohama
S. L. Olsen
Seoul National University, Seoul
University of Hawaii, Honolulu, Hawaii 96822
G. Pakhlova
Institute for Theoretical and Experimental Physics, Moscow
H. Palka
H. Niewodniczanski Institute of Nuclear Physics, Krakow
C. W. Park
Sungkyunkwan University, Suwon
H. Park
Kyungpook National University, Taegu
H. K. Park
Kyungpook National University, Taegu
R. Pestotnik
J. Stefan Institute, Ljubljana
M. Petrič
J. Stefan Institute, Ljubljana
L. E. Piilonen
IPNAS, Virginia Polytechnic Institute and State University, Blacksburg, Virginia 24061
M. Prim
Institut für Experimentelle Kernphysik, Karlsruher Institut für Technologie, Karlsruhe
M. Röhrken
Institut für Experimentelle Kernphysik, Karlsruher Institut für Technologie, Karlsruhe
S. Ryu
Seoul National University, Seoul
H. Sahoo
University of Hawaii, Honolulu, Hawaii 96822
Y. Sakai
High Energy Accelerator Research Organization (KEK), Tsukuba
O. Schneider
École Polytechnique Fédérale de Lausanne (EPFL), Lausanne
A. J. Schwartz
University of Cincinnati, Cincinnati, Ohio 45221
K. Senyo
Nagoya University, Nagoya
O. Seon
Nagoya University, Nagoya
M. E. Sevior
University of Melbourne, School of Physics, Victoria 3010
M. Shapkin
Institute of High Energy Physics, Protvino
C. P. Shen
University of Hawaii, Honolulu, Hawaii 96822
J.-G. Shiu
Department of Physics, National Taiwan University, Taipei
B. Shwartz
Budker Institute of Nuclear Physics, Novosibirsk
Novosibirsk State University, Novosibirsk
F. Simon
Max-Planck-Institut für Physik, München
Excellence Cluster Universe, Technische Universität München, Garching
P. Smerkol
J. Stefan Institute, Ljubljana
A. Sokolov
Institute of High Energy Physics, Protvino
E. Solovieva
Institute for Theoretical and Experimental Physics, Moscow
S. Stanič
University of Nova Gorica, Nova Gorica
M. Starič
J. Stefan Institute, Ljubljana
K. Sumisawa
High Energy Accelerator Research Organization (KEK), Tsukuba
T. Sumiyoshi
Tokyo Metropolitan University, Tokyo
G. N. Taylor
University of Melbourne, School of Physics, Victoria 3010
Y. Teramoto
Osaka City University, Osaka
K. Trabelsi
High Energy Accelerator Research Organization (KEK), Tsukuba
T. Tsuboyama
High Energy Accelerator Research Organization (KEK), Tsukuba
S. Uehara
High Energy Accelerator Research Organization (KEK), Tsukuba
T. Uglov
Institute for Theoretical and Experimental Physics, Moscow
Y. Unno
Hanyang University, Seoul
S. Uno
High Energy Accelerator Research Organization (KEK), Tsukuba
G. Varner
University of Hawaii, Honolulu, Hawaii 96822
K. E. Varvell
School of Physics, University of Sydney, NSW 2006
K. Vervink
École Polytechnique Fédérale de Lausanne (EPFL), Lausanne
C. H. Wang
National United University, Miao Li
M.-Z. Wang
Department of Physics, National Taiwan University, Taipei
P. Wang
Institute of High Energy Physics, Chinese Academy of Sciences, Beijing
M. Watanabe
Niigata University, Niigata
Y. Watanabe
Kanagawa University, Yokohama
R. Wedd
University of Melbourne, School of Physics, Victoria 3010
E. Won
Korea University, Seoul
Y. Yamashita
Nippon Dental University, Niigata
C. C. Zhang
Institute of High Energy Physics, Chinese Academy of Sciences, Beijing
Z. P. Zhang
University of Science and Technology of China, Hefei
P. Zhou
Wayne State University, Detroit, Michigan 48202
T. Zivko
J. Stefan Institute, Ljubljana
A. Zupanc
Institut für Experimentelle Kernphysik, Karlsruher Institut für Technologie, Karlsruhe
O. Zyukova
Budker Institute of Nuclear Physics, Novosibirsk
Novosibirsk State University, Novosibirsk
Abstract
We present the result of a search for
charge asymmetry in decays
using 772 106
pairs collected at the
resonance by the Belle detector at the KEKB asymmetric-energy collider.
The -violating charge asymmetry is measured to be .
pacs:
11.30.Er, 13.25.Hw
††preprint: Belle Preprint 2010-18KEK Preprint 2010-29
Violation of symmetry in the Standard Model (SM) has been well established.
Interest has now shifted to the search for new sources of violation due to physics beyond the SM,
since the violation content of the SM does not explain
the matter-antimatter asymmetry of the Universe CP .
In the SM, -violating
phenomena in the quark sector are described by the Kobayashi-Maskawa theory KM ,
in which a single irreducible complex phase gives rise to all -violating asymmetries.
The decay is mediated by a color-suppressed
transition, where the dominant tree-level
amplitude and the penguin amplitude have a small relative complex phase,
arg KM in the SM CC .
The charge asymmetry in the decay is defined as
where denotes the branching fraction.
Direct violation would appear as a nonzero value
and is predicted to be quite small, 0.3% REF1 , in the SM.
Some new physics models predict enhanced values of this asymmetry REF1 .
For example, a model with an extra gauge boson REF2 and
another model with an extra coupling to the charged Higgs boson REF3
predict asymmetries of (1%) and (10%), respectively.
The decay mode has low backgrounds and
a large branching fraction, when compared to that of other charmonium decay modes.
These properties enable a precise measurement,
which provides an important test of various new physics models
and constrains their parameter spaces.
The current world average for
is (0.9 0.8)% PDG which is dominated by the D0 result, (0.75 0.61 0.30)% D0 , while the most precise result from an collider experiment
is the BABAR result of (3.0 1.4 1.9)% BABAR .
In this paper, we report a measurement of
using a 711 fb-1 data set that contains 772 pairs.
The decay is reconstructed in the
( or ) channels. For a precise measurement of the charge
asymmetry in this decay, the asymmetry of charged kaon detection
efficiencies must be carefully studied and corrected for.
The asymmetry in detection efficiency arises due to
the asymmetric geometry of the detector, different interaction rates of kaons in the detector
material, and differences in kaon identification efficiencies for and .
KEKB is an asymmetric electron-positron storage ring that collides 8.0 GeV electrons with 3.5 GeV positrons at the resonance
(center-of-mass [c.m.] energy GeV).
The resonance is boosted by KEKB .
The Belle detector is a large-solid-angle magnetic
spectrometer that consists of a silicon vertex detector (SVD),
a 50-layer central drift chamber (CDC), an array of
aerogel threshold Cherenkov counters (ACC),
a barrel-like arrangement of time-of-flight
scintillation counters (TOF), and an electromagnetic calorimeter (ECL)
comprised
CsI (Tl) crystals located inside a superconducting
solenoid coil that provides a 1.5 T
magnetic field. An iron flux-return located outside of
the coil is instrumented to detect mesons and to identify
muons (KLM). The detector is described in detail elsewhere BELLE-DETECTOR ; svd2 .
Hadronic events are initially
selected by requiring at least three reconstructed charged tracks,
a total reconstructed ECL energy in the c.m. in the range
0.1 0.8,
at least one large-angle cluster in the ECL,
a total visible energy – calculated from
all charged tracks and isolated neutral showers – greater than
0.2,
an absolute value of the component of the c.m. momentum less than
0.5,
and a reconstructed primary vertex that is consistent with the known location of the interaction point.
To suppress two-jet non- background relative to events, we require
, where is the ratio of the second to zeroth Fox-Wolfram
moments FW .
To remove charged particle tracks that are poorly measured or do not come from the interaction region,
we require cm for all tracks, where is the absolute value of the coordinate along
the beam direction at the point on the track closest to the origin.
The meson is reconstructed from one tightly and one loosely
identified lepton.
For muon tracks, the tight identification criterion is based on track penetration depth and hit scatter in the KLM system,
while the loose identification criterion requires only that the
tracks have an energy deposit in the ECL that
is consistent with that of a minimum ionizing particle.
Electron tracks are tightly identified by a requirement on a combination
of from the CDC, ( is the energy deposit in the ECL and
the is momentum measured by the SVD and the CDC), and shower shape in the ECL.
For loose identification, either or is required to be consistent with the electron hypothesis.
We correct for final-state radiation or bremsstrahlung in
the inner parts of the detector by including in the invariant mass calculation
the four-momentum of every photon detected within 0.05 rad of the original electron or positron direction.
Since small residual radiative tails still remain,
we use asymmetric invariant mass requirements,
MeV/ MeV/ and
MeV/ MeV/, for the and pairs, respectively.
The combined information from the CDC , TOF, and ACC is used to form
a likelihood ratio,
, where is the likelihood of
the kaon (pion) hypothesis.
We require for kaon candidates,
which is approximately 80% efficient for kaons, while giving a
misidentification probability of below 10% for pions.
Charged mesons are reconstructed by combining a
candidate with a charged kaon candidate.
The energy difference, , and the beam-energy constrained mass,
, are used to separate signal from background
[ and are the candidate energy and momentum, calculated in the c.m. system, after performing a
mass- and vertex-constrained fit to the leptons from the decay].
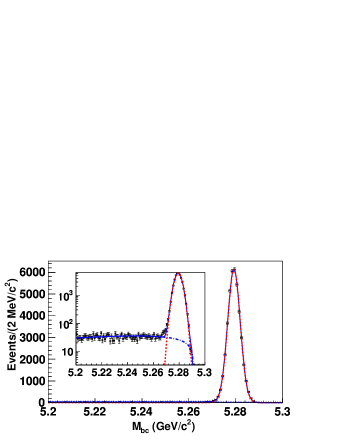
In order to determine the signal yield and charge asymmetry, we fit
distributions after requiring 40 MeV.
Each distribution for 5.2 GeV/ GeV/ is
fitted with the sum of a Gaussian for the signal and
an ARGUS function ARGUS for background.
We simultaneously fit the and distributions with common shape
parameters for the signal and background, except for the mean of
the signal Gaussians. In the fit we assume that there is no asymmetry in the background; the effect of
a possible asymmetry is included in the systematic error evaluation.
We neglect a small contribution from correlated background,
which peaks at the signal position in the distribution.
The effect of this ”peaking background” is included in the systematic error as described below.
Shape parameters and normalizations are allowed to vary in the fit.
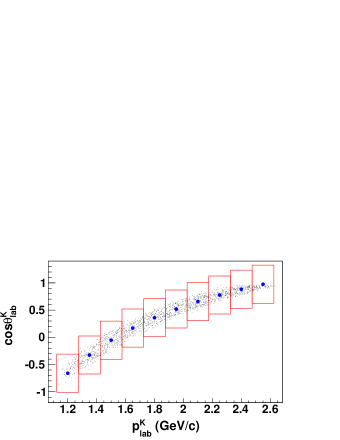
To correct for the kaon detection asymmetry, which depends on the
momentum and polar angle
of kaons in the laboratory system, we perform fits in ten bins of
().
The binning is shown in Fig. 1.
The bins are labeled 1 to 10 with
increasing . We observe
a total signal yield of 41,315 205 events.
The distribution for all bins combined is shown in Fig. 2.
The measured raw asymmetry () in each bin is given in
Table 1.
Figure 1: (color online).
Illustration of the () binning.
is divided into ten bins each with a width of
0.15 GeV/.
The bin width is
0.7, and fully contains the signal.
The bins are centered at the kinematically determined
values for the two-body decay (blue circles).
The small black dots in the figure are events generated by a Monte Carlo simulation.
Figure 2: (color online).
distribution of candidates
summed over all bins and for both
charge states (inset plot is on a semilog scale).
The blue solid, blue dot-dashed, and red dashed curves are
the total fit, the background and the signal components, respectively.
We measure the kaon detection asymmetry, , in data using
()
and decay modes BRKO .
Here, we denote .
The measured asymmetries of the above modes can be written as
assuming the asymmetries are small.
Here denotes the forward-backward asymmetry due to the interference in
and is the pion detection asymmetry.
We can extract by subtracting the
value from the with the assumption
.
This assumption is reasonable
because the effect of the fragmentation on the forward-backward asymmetry is expected to be small.
Possible deviations from this assumption are checked in data and included as a small contribution to the systematic error.
The subtraction is performed in bins of pion momentum, ,
and polar angle in the laboratory system, ,
and the charmed meson’s polar angle in the c.m. system,
(since is
correlated with and
depends on it).
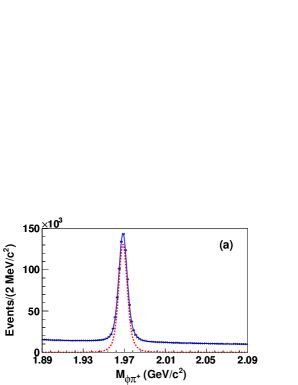
We reconstruct and decays
with charged tracks that originate from the vicinity of the interaction point.
We require for kaons and for pions.
The meson candidates are selected with the requirement
1.00 GeV/ 1.04 GeV/.
To remove and mesons produced in meson decays, we require the charmed meson momentum
in the c.m. system be greater than 2.5 GeV/.
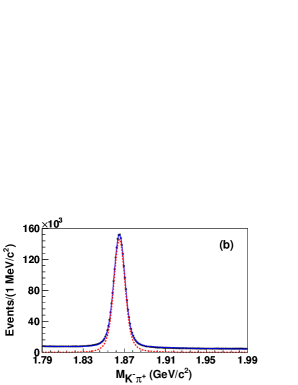
The invariant mass distributions of and
candidates after these requirements are shown in Figs. 3.
We first obtain the map in three-dimensional (3D)
bins of (, ,
).
In each bin, is obtained by fitting
the reconstructed candidate mass distributions
(1.89 GeV/ GeV/). The fits
are performed in a manner similar to those performed for .
signals are parameterized as a sum of two Gaussian
functions and a bifurcated Gaussian, which represents
the tail of the distribution
(for high-statistics bins only). The bin-dependent fractions of Gaussians
are fixed to those obtained from Monte Carlo simulations.
The background is parametrized as a first-order polynomial and
its asymmetry is allowed to vary in the fits.
Figure 4 shows the map in
bins of (, ,
). The 3D binning ()
is selected to have sufficient granularity with large enough statistics
in each bin.
The values are extracted using
decays as follows: fits are performed to the
candidate invariant mass distribution
in 1.79 GeV/ 1.99 GeV/
with a parameterization similar to that used for the .
Here and are corrected
according to the values in bins of
(, , ).
The obtained values of and are already corrected for
and and their asymmetry gives .
The values of the kaon asymmetry are determined for different
() bins defined in
Fig. 1.
These results are shown in Fig. 5 and the obtained kaon
asymmetry values are quoted in the last column of Table 1.
Finally, the measured values are corrected by
in each bin.
The results are shown
in Fig. 6 and summarized in Table 1.
We obtain ,
which is a weighted average of corrected asymmetries, and in which the error includes only the statistical error of the determination.
The weights in the averaging procedure are also based only on the statistical error of the .
Statistical and systematic uncertainties of are included in the systematic error as described below.
Figure 3:
(color online). (a) and (b) invariant mass distribution
summed over all bins including
the charge-conjugate final states.
The blue curve shows the results of the fit described in text, and the red dashed
curve shows the signal.
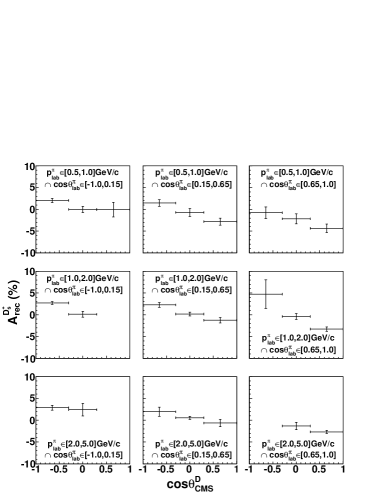
Figure 4:
map in bins of
(, ,
).
The errors shown here are the statistical errors in
the signal yield.
The empty bins do not contain enough candidates to obtain and hence we assign the value of 0.0%.
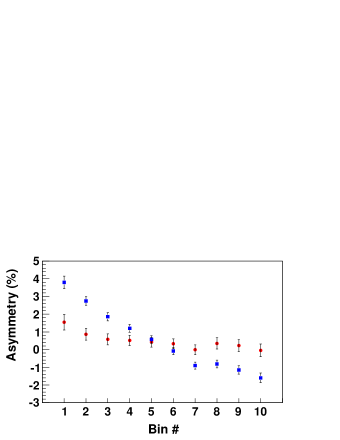
Figure 5:
(color online).
(blue squares) and corrected (red circles), which corresponds to in () bins.
The errors in the corrected values of include the statistical errors of the .
Table 1:
Summary of asymmetries (in units of %).
is the corrected charge asymmetry.
The final values are weighted averages with the statistical errors
from . The first error in
is the statistical error of the signal yield.
The second error comes from the statistical errors in
and has correlation among bins.
Bin
1
2
3
4
5
6
7
8
9
10
Total
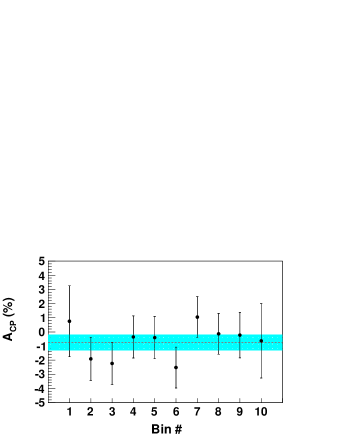
Figure 6:
(color online). distribution in
different bins.
Errors are obtained from and uncertainties summed in quadrature.
The red dashed line shows the weighted average of and its
uncertainty is shown as the light-blue band.
The values obtained in the ten () regions are consistent with each other.
Systematic errors arise from three sources: the systematic uncertainty in
measurement, the uncertainty of the due to
and due to
.
The systematic errors are summarized in Table 2.
The systematic uncertainties due to the choice of binning, fit range, and mass
windows are estimated from variations of the fit results,
obtained by refitting the data using different choices.
The dominant systematic error comes from the uncertainty
in ,
in which the statistical error in
signal yields contributes
0.17%. The choice of 3D binning in (,
, ) contributes 0.08%.
The kaon detection asymmetry in cancels if the
momentum distributions of and are identical in
decay. We find a small difference between them that
arises from asymmetry in the helicity angle distribution due to the
interference between the and -wave component in
decay. We estimate the effect on our
measurement to be 0.05% from the difference of momentum distributions
in data.
The effect of empty bins in the map is estimated
by setting values of empty bins to 2% and
results in a negligibly small contribution of 0.001%.
The uncertainty in mainly comes from the
statistical errors in the (0.07%)
and () binning (0.04%).
A possible asymmetry in the final state
arises from the interference between decays with and without
mixing.
The uncertainty is estimated from the 95% confidence level upper limit
on the -violating asymmetry,
ACP-D0-13 , using the world
average of mixing and violation
parameters ACP-D0-14 and is found to be 0.01%.
is much smaller than
because there is no mixing between and .
We estimate the effect (0.01%) due to the possible difference between
and ; we compare
in and decays.
In addition to binning, the following sources are considered for the uncertainty in
.
Based on the Monte Carlo simulation, we estimate that the peaking background
contributes 0.12% of the signal. The dominant contribution comes from
with where the tracks are
misidentified as , and from .
We estimate the systematic error (0.01%) using
BELLE-D0PIP and
BABAR .
The systematic error due to possible asymmetry in non-peaking background
(0.022%) is estimated by repeating fits allowing the background asymmetry
to vary.
The measurement and correction for kaon detection asymmetry is verified
by repeating the whole procedure with different requirements on
kaon identification.
The corrected values are stable
within the statistical uncertainty and estimated systematic error.
Adding all systematic errors above in quadrature, the total systematic
error is estimated to be 0.22%.
Table 2:
Summary of systematic uncertainties.
Source
Peaking background
0.01
ARGUS background
0.02
bin width
0.01
binning
0.02
statistics
0.17
bin width
0.01
mass window
0.02
(,
,
) binning
0.08
Empty bins
0.01
asymmetry
0.05
statistics
0.07
bin width
0.01
mass window
0.01
binning
0.04
possible
0.01
assumption
0.01
Total
0.22
In conclusion, using 772 meson pairs,
we have measured the -violating charge asymmetry to be ()%,
where the first uncertainty is statistical and second is systematic.
No significant evidence of violation
is observed. Our measurement is consistent with
the world average (0.9 0.8)% PDG .
This result significantly improves the precision from
previous measurements at
collider experiments CLEO ; BABAR and supersedes our earlier result LAST-BELLE .
The Belle result is slightly more precise than the D0 measurement D0 .
The two most precise measurements to date differ by less than two standard deviations.
We thank the KEKB group for excellent operation of the
accelerator, the KEK cryogenics group for efficient solenoid
operations, and the KEK computer group and
the NII for valuable computing and SINET3 network support.
We acknowledge support from MEXT, JSPS and Nagoya’s TLPRC (Japan);
ARC and DIISR (Australia); NSFC (China); MSMT (Czechia);
DST (India); MEST, NRF, NSDC of KISTI, and WCU (Korea); MNiSW (Poland);
MES and RFAAE (Russia); ARRS (Slovenia); SNSF (Switzerland);
NSC and MOE (Taiwan); and DOE (USA).
References
(1)
A.D. Sakharov, Pis’ma Zh. Eksp. Teor. Fiz. 5, 32 (1967) [JETP Lett. 5, 24 (1967)].
(2)
M. Kobayashi and T. Maskawa, Prog. Theor. Phys. 49, 652 (1973).
(3)
Charge-conjugate states are implied throughout this paper unless stated otherwise.
(4)
W.-S. Hou, M. Nagashima, and A. Soddu, arXiv:hep-ph/0605080.
(5)
V. Barger, C.-W. Chiang, P. Langacker, and H.-S. Lee, Phys. Lett. B 598, 218 (2004).
(6)
G.-H. Wu and A. Soni, Phys. Rev. D 62, 056005 (2000).
(7)
K. Nakamura et al. (Particle Data Group), J. Phys. G 37, 075021 (2010).
(8)
V.M. Abazov et al. (DØ Collaboration), Phys. Rev. Lett. 100, 211802 (2008).
(9)
B. Aubert et al. (BABAR Collaboration), Phys. Rev. Lett. 94, 141801 (2005).
(10)
S. Kurokawa and E. Kikutani, Nucl. Instr. and. Meth.
A 499, 1 (2003), and other papers included in this volume.
(11)
A. Abashian et al. (Belle Collaboration), Nucl. Instr. and Meth. A 479, 117 (2002).
(12)
Z. Natkaniec et al. (Belle SVD2 Group), Nucl. Instr. and Meth. A 560, 1 (2006).
(13)
G.C. Fox and S. Wolfram, Phys. Rev. Lett. 41, 1581 (1978).
(14)
H. Albrecht et al. (ARGUS Collaboration), Phys. Lett. B 241, 278 (1990).
(15)
B.R. Ko et al. (Belle Collaboration), Phys. Rev. Lett. 104, 181602 (2010).
(16)
A.A. Petrov, Phys. Rev. D 69, 111901(R) (2004).
(17)
E. Barberio et al. (Heavy Flavor Averaging Group), arXiv:0808.1297v3 and online update at http://www.slac.standord.edu/xorg/hfag/.
(18)
K. Abe et al. (Belle Collaboration), Phys. Rev. D 73, 051106(R) (2006).
(19)
G. Bonvicini et al. (CLEO Collaboration), Phys. Rev. Lett. 84, 5940 (2000).
(20)
K. Abe et al. (Belle Collaboration), Phys. Rev. D 67, 032003 (2003).