What Drives the Expansion of Giant HII Regions?: A Study of Stellar Feedback in 30 Doradus
Abstract
Observations show that star formation is an inefficient and slow process. This result can be attributed to the injection of energy and momentum by stars that prevents free-fall collapse of molecular clouds. The mechanism of this stellar feedback is debated theoretically: possible sources of pressure include the classical warm HII gas, the hot gas generated by shock-heating from stellar winds and supernovae, direct radiation of stars, and the dust-processed radiation field trapped inside the HII shell. In this paper, we measure observationally the pressures associated with each component listed above across the giant HII region 30 Doradus in the Large Magellanic Cloud. We exploit high-resolution, multi-wavelengh images (radio, infrared, optical, and X-ray) to map these pressures as a function of position. We find that radiation pressure dominates within 75 pc of the central star cluster, R136, while the HII gas pressure dominates at larger radii. By contrast, the dust-processed radiation pressure and hot gas pressure are generally weak and not dynamically important, although the hot gas pressure may have played a more significant role at early times. Based on the low X-ray gas pressures, we demonstrate that the hot gas is only partially confined and must be leaking out the HII shell. Additionally, we consider the implications of a dominant radiation pressure on the early dynamics of 30 Doradus.
Subject headings:
galaxies: star clusters — HII regions — ISM: individual (30 Doradus) — stars: formation1. Introduction
Molecular clouds contain the coolest and densest gas in the Universe, and thus they are the sites where stars form. The physical properties of these clouds set the initial conditions for protostellar collapse and may define the stellar initial mass function (IMF) [Motte et al. 1998; Testi & Sargent 1998; Onishi et al. 2002]. The massive stars formed there eventually end in supernova explosions, injecting mechanical energy and chemically enriching the interstellar medium (ISM). Therefore, molecular clouds shape the entire stellar life cycle, and an understanding of their properties and dynamics is key to probe galactic evolution.
Observational evidence shows that star formation is an inefficient and slow process. Only 5–10% of available molecular cloud mass is converted into stars over the cloud lifetime111Cloud lifetime is debated contentiously in the literature. Observational estimates range from a single free-fall time (Elmegreen, 2000; Hartmann et al., 2001; Ballesteros-Paredes & Hartmann, 2007) to several free-fall times (Tan et al., 2006). However, there is a consensus that only a few percent of gas is converted in either timescale. (Williams & McKee, 1997) and only 2% of the gas is converted to stars in one free-fall time across several orders of magnitude in density (Zuckerman & Evans, 1974; Krumholz & Tan, 2007). This inefficiency can be attributed to the internal processes of HII regions that disrupt their host molecular clouds (e.g., Matzner 2002; Krumholz et al. 2006), but the mode of this stellar feedback remains uncertain.
Broadly, there are several possible sources of internal energy and momentum that may drive the dynamics of HII regions: the direct radiation from stars (e.g., Jijina & Adams 1996; Krumholz & Matzner 2009), the dust-processed infrared radiation trapped inside an HII shell (Thompson et al., 2005; Murray et al., 2010b; Andrews & Thompson, 2011), the warm gas ionized by massive stars (e.g., Whitworth 1979; Dale et al. 2005), the hot gas shock heated by stellar winds and supernovae (e.g., Yorke et al. 1989; Harper-Clark & Murray 2009), and protostellar outflows/jets (e.g., Quillen et al. 2005; Cunningham et al. 2006; Li & Nakamura 2006; Nakamura & Li 2008; Wang et al. 2010). Each of these mechanisms has been considered individually in the literature, but no observational analyses have ever compared the relative contribution of all these components within HII regions.
In this paper, we investigate the role of the stellar feedback mechanisms listed above in the giant HII region 30 Doradus in the nearby Large Magellanic Cloud (LMC). Several properties of the LMC make it a favorable target: the LMC’s proximity (50 kpc) ensures individual point sources can be resolved while maintaining the capability of mapping the diffuse emission at sub-pc scales. Additionally, the LMC has a face-on orientation and a low column density (a few 1021 cm-2) that limits line-of-sight confusion. Given these advantages, the LMC (and thus 30 Doradus) has been surveyed at many wavelengths at high spatial resolution, and we can exploit these data to compare observationally all the feedback mechanisms and how they vary with position across 30 Doradus.
The text is structured as follows: 1.1 gives relevant background on the source, 30 Doradus, and describes why this source is a good “test case” for our analyses. In 2, we present the multiwavelength data utilized in our work to assess the dynamical role of all the possible stellar feedback mechanisms. 3 outlines how we utilize these images to calculate the pressures associated with each feedback component across 30 Doradus. 4 gives the results from our analyses, and 5 discusses the implications of our findings, including evidence of X-ray gas leakage from the HII region (5.1) and the role of radiation pressure in HII region dynamics (5.3). Additionally, we articulate the different ways one can define radiation pressure, and how these definitions can lead to divergent results in 5.2. Finally, we summarize and conclude our analysis in 6.
1.1. Background on 30 Doradus
30 Doradus is the most massive and largest HII region in the Local Group. The primary star cluster powering 30 Doradus is NGC 2070, with 2400 OB stars (Parker, 1993), an ionizing photon luminosity photons s-1 (Walborn, 1991), and a bolometric luminosity of 7.8 (Malumuth & Heap, 1994). The IMF of NGC 2070 has masses up to 120 M☉ (Massey & Hunter, 1998), and the stellar population may be the result of several epochs of star formation (Walborn & Blades, 1997). At the core of NGC 2070 is R136, the densest concentration of very massive stars known, with a central density of 5.5 pc-3 (Hunter et al., 1995); R136 hosts at least 39 O3-type stars and at least 10 WR stars in its core (2.5 pc in diameter; Massey & Hunter 1998).
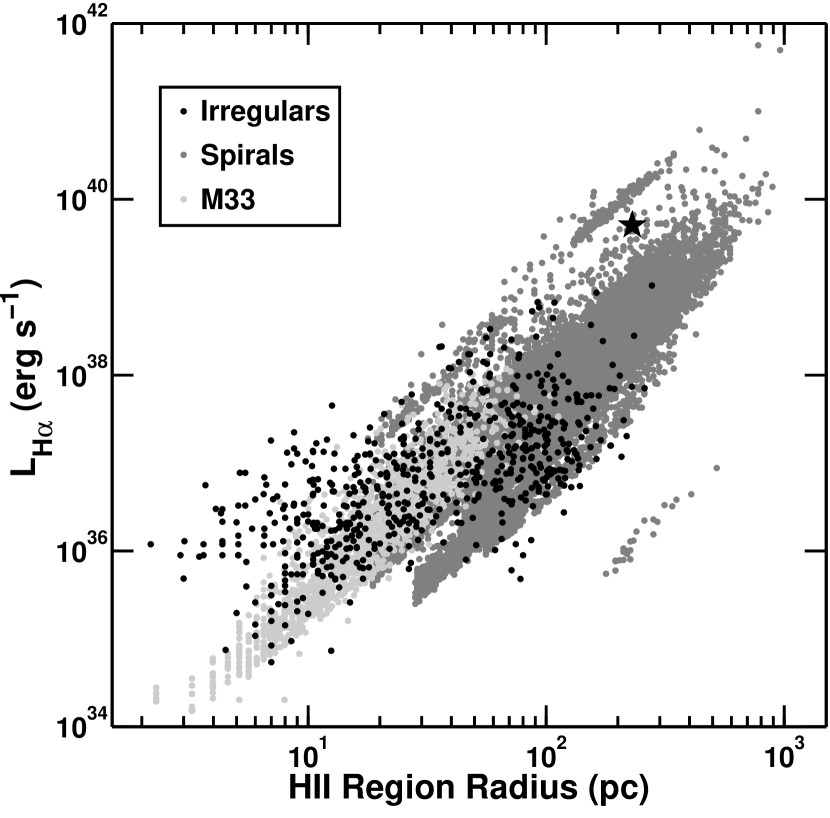
To provide context for how 30 Doradus compares to other local HII regions, Figure 1 plots H luminosity versus HII region radius for 22,000 HII regions in 70 nearby (distances 30 Mpc) galaxies (see references in figure caption). Morphologically, this galaxy sample is comprised of 13 irregulars/dwarf irregulars and 57 spirals. The black star near the top right denotes 30 Doradus. It is the brighest in H of the 613 HII regions in the irregulars by nearly an order of magnitude. Relative to the HII regions in spirals (including M33), 30 Doradus has a greater H luminosity than 99% of that sample.
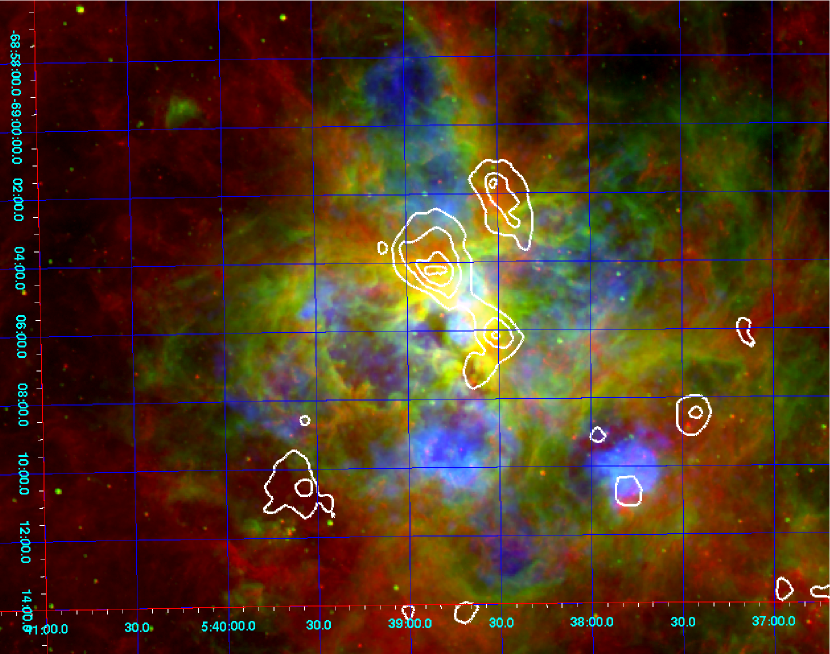
The nebula that surrounds the central star cluster has a complex morphology across the electromagnetic spectrum. Figure 2 shows a three-color image of 30 Doradus, with the Spitzer Space Telescope 8-m IRAC band in red, H in green, and soft X-rays (0.5–2.0 keV) in blue (details of these data are given in 2). Large and small-scale structures are evident, from thin ionized gas and dust filaments of arcsecond widths to cavities a few arcminutes across filled with hot X-ray gas. The warm ionized gas has several shell-like structures, and many of these are expanding with high velocities (100–300 km s-1; Chu & Kennicutt 1994), suggesting that past supernova explosions have occurred in the region. In addition to a large ionized gas mass (; Kennicutt 1984), the 30 Doradus nebula also has of CO (Johansson et al., 1998). The CO(1–0) maps of 30 Doradus have revealed 33 molecular cloud complexes in the HII region, and in particular, two elongated clouds of CO mass that form a “ridge” West and North of R136 (see the CO contours in Figure 2). Estimates of the radius of the nebula range from 110 pc (Brandl 2005; using a revised value of = 50 kpc) to 185 pc (Kennicutt, 1984). The nearly factor of two uncertainty in arises from the complex shape that precludes accurate determination of the radius. In this paper, we will assume = 150 pc.
The properties of 30 Doradus described above demonstrate why this HII region is an ideal candidate for assessing the feedback mechanisms of massive stars. The shear number and energetic output of the OB stars facilitates detailed study of the effects of radiation, winds, supernovae, ionization fronts, etc. Additionally, the proximity of 30 Doradus enables a resolved view of the processes and dynamics associated with starburst activity that was common in the early Universe (e.g., Meurer et al. 1997; Shapley et al. 2003). Indeed, the relatively instantaneous formation of the concentrated massive stars in R136 make 30 Doradus a “mini-starburst” (Leitherer, 1997).
2. Data
We analyzed images of 30 Doradus at several wavelengths. A brief description of these data is given below.
2.1. Optical
We compiled optical photometric data on 30 Doradus from three separate observational programs. For the central 35′′ 35′′around R136 (with right ascension 05 and declination 69∘06′02.7′′), we utilize the photometric results of Malumuth & Heap (1994) from Hubble Space Telescope Planetary Camera observations. These authors identified over 800 stars within this area and obtained a bolometric luminosity for their sources.
At larger distances from R136 out to a few arcminutes, we employ the UBV photometric data of Parker (1993). The optical images of 30 Doradus from Parker (1993) were obtained at the 0.9-m telescope at Cerro Tololo Inter-American Observatory (CTIO), with a field of view of 2.6′ 4.1′ and 0.49′′pixel-1. We followed the analyses of Parker & Garmany (1993) to convert their measured apparent UBV magnitudes to absolute bolometric magnitudes.
For the area outside the field of Parker (1993), we use the UBV data of Selman & Melnick (2005). These observations were taken with the Wide Field Imager on the MPG/ESO 2.2-m telescope at La Silla, out to half a degree away from R136 with 0.238′′pixel-1. Thus, the three datasets combined provide full coverage of 30 Doradus in the U, B, and V bands.
To illustrate the HII region structure, we show the H emission of 30 Doradus in Figure 2. This narrow-band image (at 6563Å, with 30Å full-width half max) was taken with the University of Michigan/CTIO 61-cm Curtis Schmidt Telescope at CTIO as part of the Magellanic Cloud Emission Line Survey (MCELS: Smith & MCELS Team 1998). The total integration time was 600 s, and the reduced image has a resolution of 2′′pixel-1.
2.2. Infrared
Infrared images of 30 Doradus were obtained through the Spitzer Space Telescope Legacy project Surveying the Agents of Galaxy Evolution (SAGE: Meixner et al. 2006) of the LMC. The survey covered an area of 7 7 degrees of the LMC with the Infrared Array Camera (IRAC; Fazio et al. 2004) and the Multiband Imaging Photometer (MIPS; Rieke et al. 2004). Images were taken in all bands of IRAC (3.6, 4.5, 5.8, and 7.9 m) and of MIPS (24, 70, and 160 m) at two epochs in 2005. For our analyses, we used the combined mosaics of both epochs with 1.2′′pixel-1 in the 3.6 and 7.9 m IRAC images and 2.49′′pixel-1 and 4.8′′pixels-1 in the MIPS 24 m and 70 m, respectively.
2.3. Radio
30 Doradus was observed with the Australian Telescope Compact Array (ATCA) as part of a 4.8-GHz and 8.64-GHz survey of the LMC (Dickel et al., 2005). This program used two array configurations that provided 19 antenna spacings, and these ATCA observations were combined with the Parkes 64-m telescope data of Haynes et al. (1991) to account for extended structure missed by the interferometric observations. For our analyses, we utilized the resulting ATCAParkes 8.64 GHz (3.5-cm) image of 30 Doradus, which had a Gaussian beam of FWHM 22′′ and an average rms noise level of 0.5 mJy beam-1. We note that higher-resolution ATCA observations of 30 Doradus have been taken by Lazendic et al. (2003), but we have opted to use the ATCAParkes image of Dickel et al. (2005) as the latter is more sensitive to the low surface-brightness outskirts of 30 Doradus.
2.4. X-ray
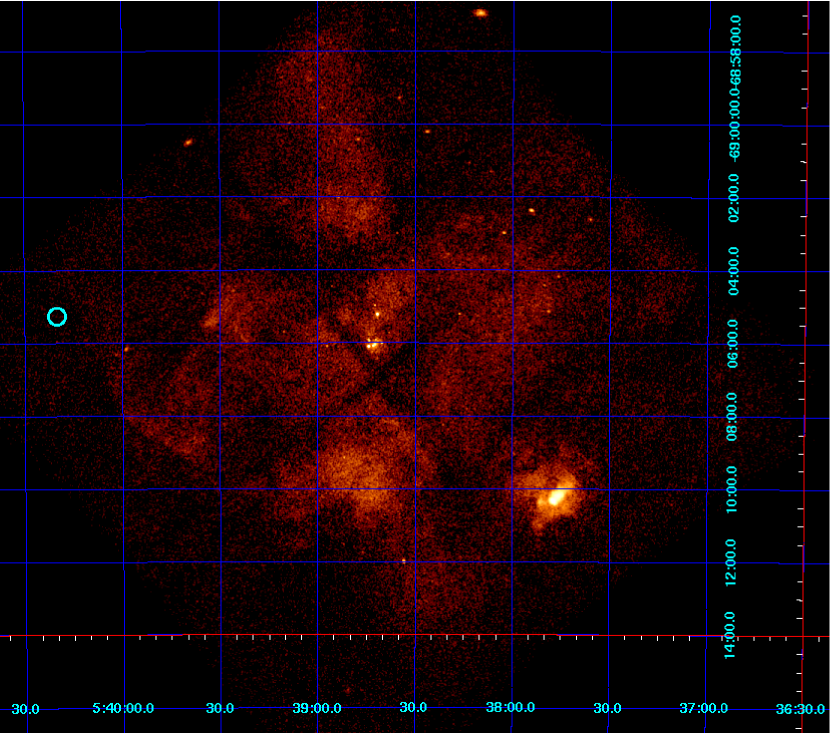
30 Doradus was observed using the Chandra Advanced CCD Imaging Spectrometer (ACIS) in 2006 January for 94 ks total (ObsIDs 5906 [13 ks], 7263 [43 ks], 7264 [38 ks]; PI: L. Townsley) in the Timed-Exposure VFaint Mode. The spatial resolution of the Chandra ACIS images is 0.492′′ pixel-1. Data reduction and analysis was performed using the Chandra Interactive Analysis of Observations (ciao) Version 4.1. We followed the ciao data preparation thread to reprocess the Level 2 X-ray data and merge the three observations together. Figure 3 shows the resulting soft X-ray band (0.5–2.0 keV) image following these analyses. Seventy-four point sources were identified in the reprocessed images using the ciao command wavdetect (a source detection algorithm using wavelet analysis; Freeman et al. 2002); we excluded the identified point sources in our spectral analyses.
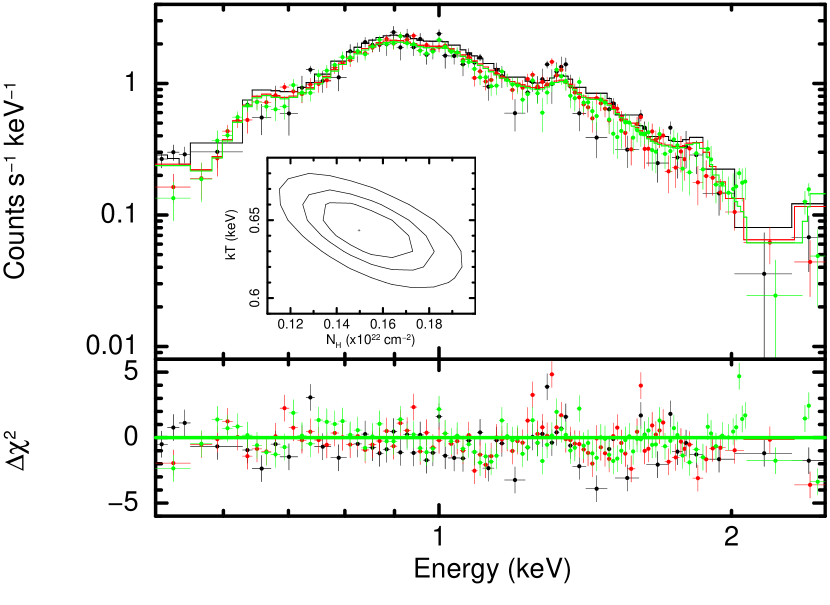
To produce a global X-ray spectrum of 30 Doradus, we extracted Chandra spectra using the ciao command specextract. Background spectra were also produced from a circular region of radius 15′′ that is 2′ East of 30 Doradus, and these were subtracted from the source spectra. Additionally, we removed the counts of the 74 point sources identified above. The resulting spectra were modeled simultaneously as an absorbed, variable-abundance plasma in collisional ionization equilibrium (XSPEC model components phabs and vmekal) in XSPEC Version 12.4.0. Figure 4 gives the spectra with the best-fit model (with with degrees of freedom [d.o.f.]) overplotted. We found a best-fit absorbing column density of cm-2 and an X-ray gas temperature of keV. The absorption-corrected soft-band (0.5–2.0 keV) luminosity of the diffuse emission is erg s-1.
Previous Chandra X-ray analysis of 30 Doradus was reported by Townsley et al. (2006a, b) for a different set of observations (ObsIDs 22 and 62520) totalling 24 ks. By fitting the X-ray spectra of many diffuse regions across 30 Doradus, they found best-fit absorbing columns of cm-2, temperatures of 0.3–0.9 keV, and absorption-corrected luminosities (0.5–2.0 keV) of log 34.2–37.0 erg s-1. Thus, our values are fairly consistent with those of Townsley et al.
3. Methodology
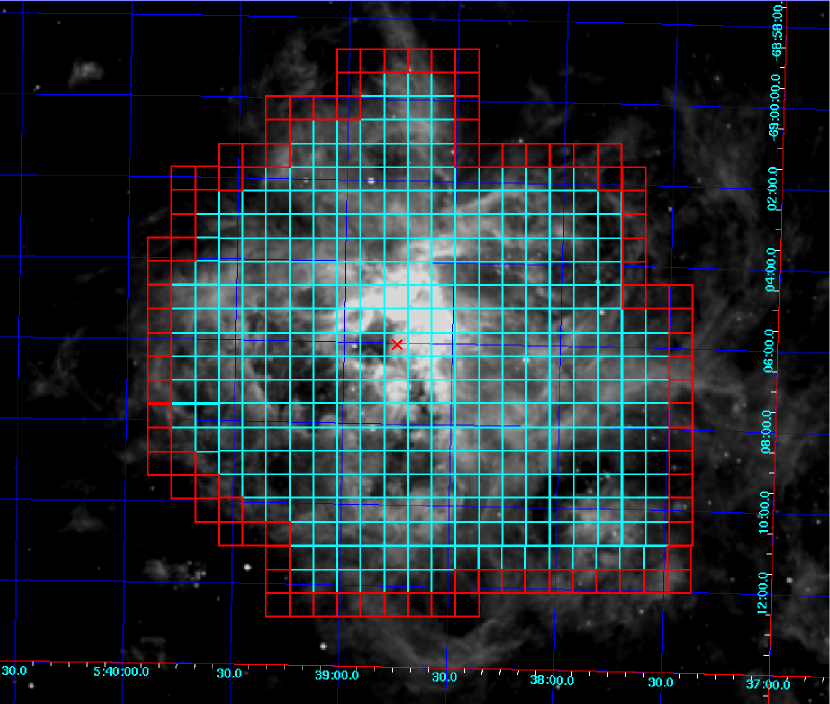
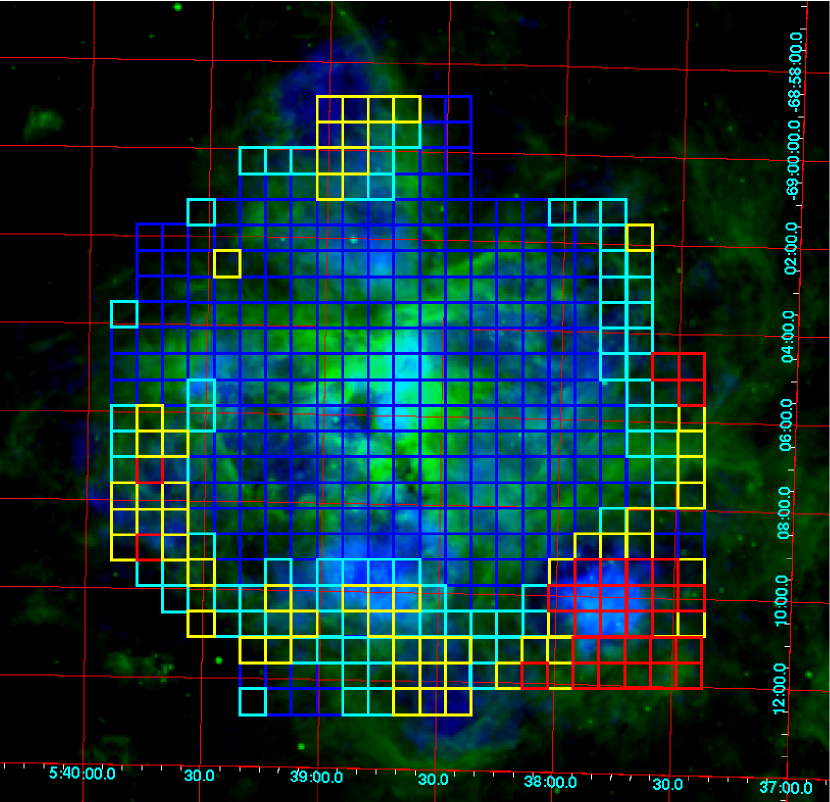
To assess how feedback varies spatially across 30 Doradus, we separate the source into 441 regions (see Figure 5). The area of the individual regions was selected to ensure sufficient signal-to-noise across the analyzed wavebands; we chose the width of the regions (35′′ 8 pc on a side, at a distance 50 kpc to the LMC) to match the HST PC image of R136 (Malumuth & Heap, 1994), so that we could use their value and not have to resolve the individual point sources in the crowded R136 cluster. The number and position of our 441 regions was determined by the field-of-view and orientation of the 3-cm radio and Chandra X-ray data. Figure 5 shows the H- image with all the resulting regions overplotted.
To ascertain the dynamical importance of the feedback processes, we compute the pressures for each region using the methods and relations described below. Since protostellar outflows are only important dynamically in low-mass star clusters (Matzner, 2007), we do not expect them to play a big role in 30 Doradus, and we will not consider them in the rest of the text.
3.1. Direct Radiation Pressure
The light output by stars produces a direct radiation pressure that is associated with the photons’ energy and momentum. The resulting radiation pressure at some position within the HII region is related to the bolometric luminosity of each star and the distance the light traveled to reach that point:
| (1) |
where the summation is over all the stars in the field. In 5.2, we describe an alternative definition of radiation pressure and compare the results from each case.
The above relation assumes that the stellar radiation are not attenuated by dust. In 3.2, we calculate separately the radiation pressure associated with the light absorbed by dust using Spitzer IR photometry. Given that our results show that generally (see 4), the assumption that the emitted is unattenuated seems reasonable.
In order to obtain the bolometric luminosities of the massive stars in 30 Doradus, we utilize the UBV photometric data described in 2.1. To simplify the calculation, we assume the bolometric luminosity of R136 obtained by Malumuth & Heap (1994) originates from the point in the middle of the central region marked with the red X in Fig. 5. For the stars located outside R136 within a few arcminutes, the Parker (1993) catalog only includes the apparent UBV magnitudes and colors. Therefore, we follow the procedure outlined by Parker & Garmany (1993) to obtain absolute bolometric magnitudes of the 1264 stars in the Parker (1993) catalog that are not in the Selman & Melnick (2005) sample. For the 7697 stars in the Selman & Melnick (2005) catalog that lie outside the field of the Parker (1993) data, we use their published values for the stars’ absolute bolometric magnitudes.
Thus, in total, we calculate the bolometric luminosities of the R136 cluster and 8961 other stars in 30 Doradus. For each of the 441 regions, we sum these 8962 terms in Equation 1, where corresponds to the projected distance from the 8962 stars’ positions to the region center. In this manner, we compute the radiation presure ’felt’ by the 441 regions from all of the starlight in 30 Doradus.
Since the stars are viewed in projection, the actual distance to a star from the R136 center is observed as a projected distance . Therefore, we calculate the direct radiation pressure for two scenarios: one case assuming the stars lie in the same plane () and another case where we attempt to “deproject” the stars positions (). Appendix A outlines the procedure we utilize to obtain the deprojected bolometric luminosity of the stars as a function of and compares with . We find that is 10–60% less than at radii 20 pc from 30 Doradus, and the fractional difference between and at larger radii is much less (0.1–3.0%). As these differences do not affect the conclusions of this paper, we will only consider for the rest of our analyses.
3.2. Dust-Processed Radiation Pressure
The stars’ radiation will be processed by the nearby dust in the region, and an associated pressure is exerted by the resulting infrared radiation field, . This pressure component could become dynamically important if the expanding HII shell is optically thick to the IR light, effectively trapping the radiation inside the HII shell (Krumholz & Matzner, 2009). The pressure of the dust-processed radiation field can be determined by the energy density of the radiation field absorbed by the dust, (i.e., we assume steady state),
| (2) |
To find in each of our 441 regions, we measure their flux densities in the IRAC and MIPS images and compare them to the predictions of the dust models of Draine & Li 2007 (DL07 hereafter). The DL07 models show how the IR emission spectral-energy distribution varies depending on the dust content and the intensity of radiation heating the dust. DL07 assume a mixture of carbonaceous grains and amorphous silicate grains that have a size distribution that reproduces the wavelength-dependent extinction in the local Milky Way (see Weingartner & Draine 2001). One component of this dust mixture is polycyclic aromatic hydrocarbons (PAHs), small-sized carbonaceous grains that produce strong emission features at 3–19 m observed in many galaxies.
Since the infrared emission from dust is relatively insensitive to the spectrum of the incident photons with 13.6 eV, DL07 adopts the spectrum of the local-neighborhood ISM. Then, is given by
| (3) |
where is a dimensionless scale factor and is the energy density of the eV photons in the local ISM, 8.65 10-13 erg cm-3 (Mathis et al., 1983). We assume that each region is exposed to a single radiation field because the starlight heating the dust comes largely from NGC 2070. In DL07 parameters, this case corresponds to and =0, where is the fraction of the dust mass exposed to the radiation.
For our analyses, we measure the average flux densities at 8, 24, and 70 m wavelengths for the 441 regions. We do not consider the 160 m band because its flux density relative to the 70 m is much higher than is consistent with the DL07 models. We suspect that the 160 m flux is from cold dust that is not associated with 30 Doradus but is in the sight line to the HII region.
To ensure we are measuring the 8 and 24 m flux densities only from dust and not starlight, we remove the starlight contribution at these wavelengths based on the 3.6m flux density (which is almost entirely from starlight):
| (4) | |||||
| (5) |
where the left-hand sides are the non-stellar flux at the respective wavelengths. The coefficients 0.232 and 0.032 are given in Helou et al. (2004).
To account for the different spatial resolutions of the IR images, we convolved the 3.6, 8, and 24 m images with kernels to match the point-spread function of the 70 m image. For this analysis, we employed the convolution kernels and method described in 2.3 of Gordon et al. (2008).
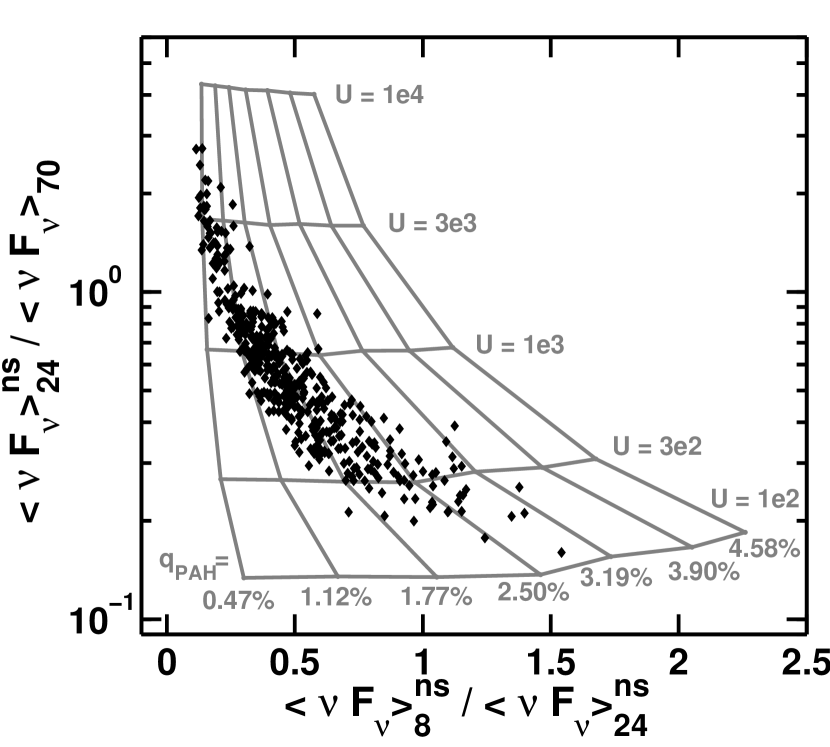
Figure 6 shows the resulting average IR flux ratios, versus , of our regions. Overplotted are the DL07 model predictions for given values of , the fraction of dust mass in PAHs, and . Errors in our flux ratios are 2.8% from a 2% uncertainty in the Spitzer photometry.
We interpolate the - grid using Delaunay triangulation, a technique appropriate for a non-uniform grid, to find the and values for our regions. Figure 7 plots the interpolated values of versus . Since the points with the smallest values lie to the left of the - grid in Figure 6, we are only able to set upper limits of 0.47% for them (marked with arrows in Fig. 7). Thus, these regions produce the “wall” of points at 0.47% in the versus plot.
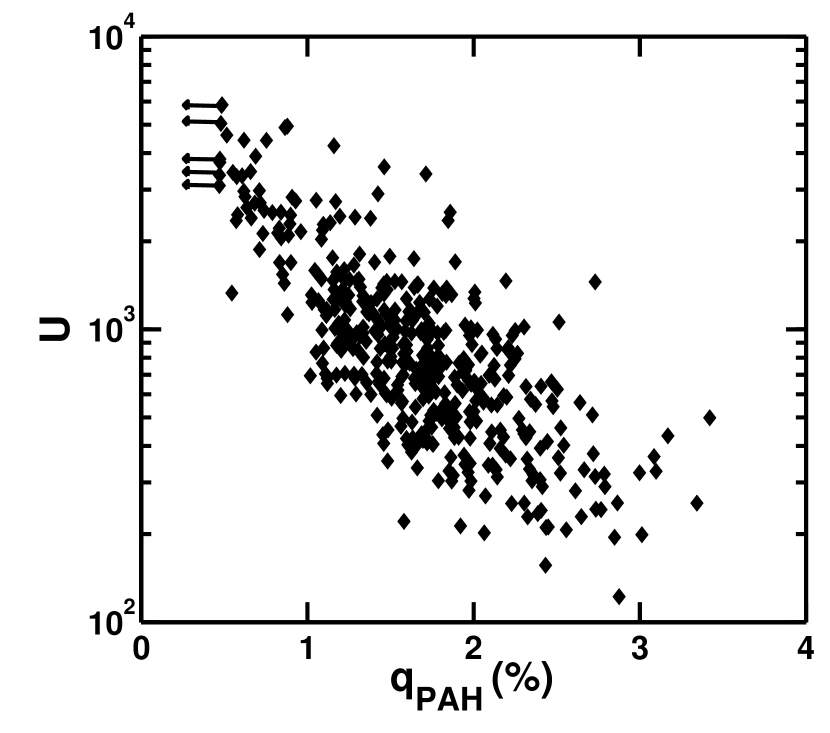
We find that the PAH fraction spans roughly an order of magnitude, with values up to 3.76%. (and thus ) also varies significantly across 30 Doradus, with 91–7640, corresponding to erg cm-3. These ranges vary radially, with the largest and smallest close to R136. One possible explanation for the radial dependence is that PAHs are destroyed more where the radiation field heating the dust is strong (e.g., Guhathakurta & Draine 1989). This result is consistent with the analyses of Peeters et al. (2004), who showed that the ratio of PAH to far-IR (dust continuum) emission in Galactic HII regions is inversely correlated with the intensity of the UV field absorbed by the dust.
We utilize the interpolated values and Equation 3 to obtain the energy density , and thus the pressure, of the dust-processed radiation field in the 441 regions.
3.3. Warm Ionized Gas Pressure
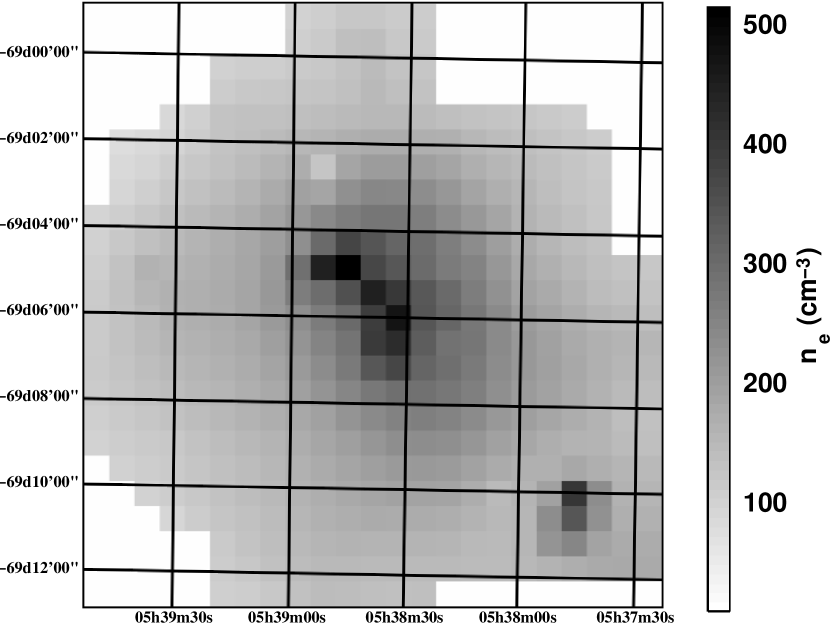
Next, we consider the pressure associated with both the warm HII gas and the hot X-ray gas. The warm ionized gas pressure is given by the ideal gas law, , where , , and are the electron, hydrogen, and helium number densities, respectively, and is temperature of the HII gas, which we assume to be the same for electrons and ions. If helium is singly ionized, then . The temperature of the HII gas in 30 Doradus is fairly homogeneous, with K, based on the measurement of [O iii] across 135 positions in the nebula (Krabbe & Copetti, 2002); here, we adopt = 104 K. Since is so uniform, the warm gas pressure is determined by the electron number density . We estimate from the average flux density of the free-free radio emission in each region (Eq. 5.14b, Rybicki & Lightman 1979):
| (6) |
where we have set the Gaunt factor . In the above relation, is the distance to 30 Doradus (assumed to be = 50 kpc) and is the integrated volume of our regions. For , we assume a radius of the HII region =150 pc, and we calculate the volume by multiplying the area of our region squares by the path length through the sphere at the region’s position. We measure of our regions in the 3.5-cm ATCAParkes image, since bremsstrahlung dominates at that wavelength. Figure 8 shows the resulting map of from these analyses. We find that the central few arcminute area of 30 Doradus has elevated electron densities, with values cm-3; the location of these large electron densities corresponds to the two molecular clouds that form the “ridge” in the center of the nebula (Johansson et al., 1998). The area outside the central enhancement has relatively uniform electron density, with 100–200 cm-3. In the Southwest of 30 Doradus where the supernova remnant N157B is located, we obtain elevated 3.5-cm flux densities, possibly because of a non-thermal contribution from that source. Therefore, the actual may be lower than the values we find in that region.
Our warm gas electron densities are similar to the values obtained by Indebetouw et al. (2009) using Spitzer’s Infrared Spectrograph. These authors used the ratio [S iii] 18.7 m/[S iii] 33.4 m to map across the central 2′ of 30 Doradus. They also find enhancements in along the “ridge”.
3.4. Hot Gas Pressure
The hot X-ray gas arises from shock heating by stellar winds and supernovae, and the associated hot gas pressure is given by the relation , where and are the electron number density and temperature of the X-ray gas, respectively. The factor of 1.9 arises from the assumption that He is fully ionized and that the He mass fraction is 0.3. As in our warm ionized gas calculation, we assume the electrons and ions have reached equipartition, so a single temperature describes both. Since the hot gas can exist over a range of , we measure both and by modeling the bremsstrahlung spectrum at X-ray wavelengths.
From the three Chandra observations, we extracted Chandra X-ray spectra from each region using the ciao command specextract. Background spectra were also produced from a circular region of radius 15′′ that is 2′ East of 30 Doradus (the cyan circle in Figure 3), and these were subtracted from the source spectra. Resulting spectra were fit using XSPEC Version 12.4.0. Data were grouped such that a minimum of five counts were in each energy bin, and spectra from the three ACIS observations of a given region were fit simultaneously to improve statistics (i.e., they were fit jointly, with more weight given to the data from the longer integrations). Around the edges of the HII region, the X-ray signal is weaker, so we combined adjacent regions to achieve sufficient counts for an accurate fit.
Spectra were modeled as an absorbed hot diffuse gas in collisional ionization equilibrium using the XSPEC components phabs and mekal (Mewe et al., 1985, 1986; Liedahl et al., 1995). In this fit, we assumed a metallicity , the value measured in HII regions in the LMC (Kurt & Dufour, 1998). For regions in the southwest of 30 Doradus with strong emission from the supernova remnant N157B, we added a powerlaw component to account for the non-thermal emission from the SNR. We obtained good fits statistically, with reduced chi-squared values of 0.80–1.30 with 60–300 d.o.f. If a region’s fit had reduced chi squared values outside this range or less than 60 d.o.f. we combined its spectra with those of adjacent regions to increase signal. The latter criterion was selected since we found generally that the shape of the bremsstrahlung continuum was not discernable with less than 60 d.o.f.
From our fits, we can estimate the electron number density of each region based on the emission measure of our models. Emission measure is defined as . Thus,
| (7) |
where is the integrated volume of our region (the same as used in Eq. 6). Since we are interested in the contribution of the X-ray pressure to the global dynamics, we have divided the emission measure by the integrated volume of a region in calculating , rather than the volume occupied by the hot gas. In the former case, the density goes as the filling factor ; in the latter scenario, . If the filling factor of the hot gas is small, the thermal pressure of the bubbles may be high internally; however, the hot gas would be insignificant dynamically because it occupies a negligible volume and thus exerts little pressure on the material that bounds the HII region. Therefore, for our purposes of assessing the dynamical role of the hot gas, it is appropriate to use the integrated volue in calculating .

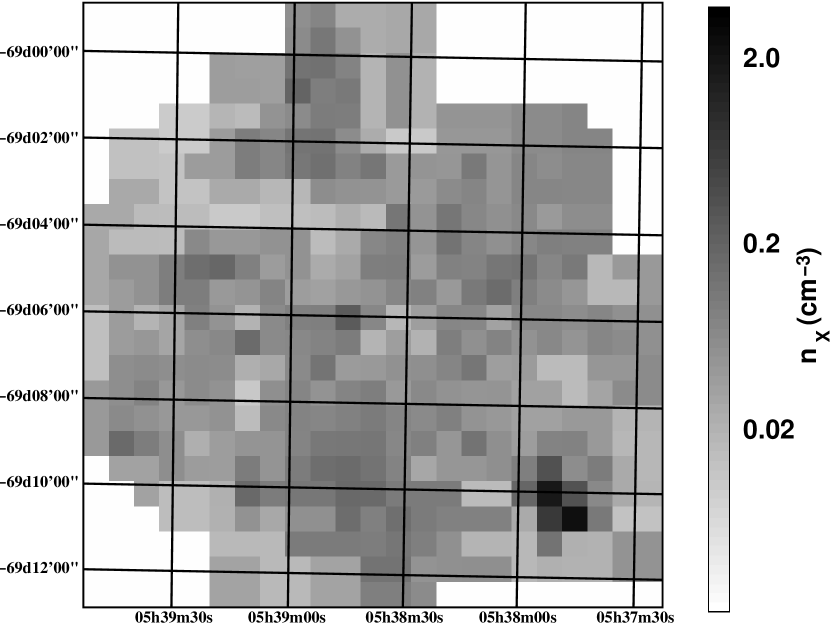
Figure 9 shows a map of the best-fit temperatures from the spectral modeling analyses. The X-ray gas temperatures are elevated in several areas, including in the Southwest (the bottom right of Fig. 9), where the SNR N157B is located, and at the center near R136. Figure 10 gives the map of the hot gas electron density across 30 Doradus from our fits. We find a mean cm-3. The hot gas electron density is much less than that of the warm gas since many fewer electrons are heated to X-ray emitting temperatures ( K) than to the moderate temperatures K of the warm gas.
4. Results
Following the multiwavelength analyses and methodology of 3, we calculate the pressures associated with the direct stellar radiation pressure , the dust-processed radiation pressure , the warm ionized gas pressure , and the hot X-ray gas pressure . Figure 11 plots the results as a function of distance from the center of R136; data of similar radii (defined as radii within 10% fractionally of each other) are binned to simplify the plot and to make trends more readily apparent. By comparing the radial trends of the different components, we find that dominates at distances 75 pc from R136, while dominates at larger radii from R136. Additionally, and do not appear to contribute significantly, although they are on the order of at distances 100 pc from R136.
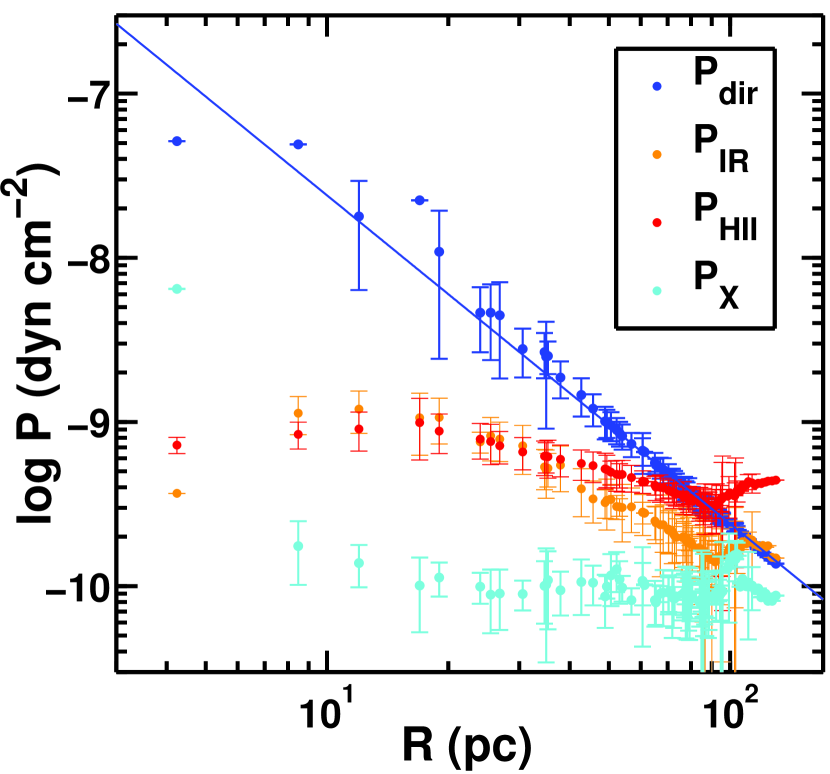
As demonstrated by Figure 11, we find that . The lack of pressure balance between these two components is consistent with our finding (see 5.1) that the X-ray gas does not remain adiabatic and trapped inside the shell. Instead, the hot gas is either leaking out or is mixing with cool gas and suffering rapid radiative losses as a result. In either case, the hot gas is likely to be flowing at a bulk speed comparable to its sound speed, and thus it will not have time to reach pressure equilibrium with the cooler gas that surrounds it before escaping the HII region. Alternatively, it may be that pressure balance is established between the warm ionized gas and the ram pressure of the hot gas, whereas we have only measured the thermal pressure. This picture is consistent with the anti-coincidence of the warm and hot gas noted by previous X-ray work (e.g., Wang 1999; Townsley et al. 2006a).
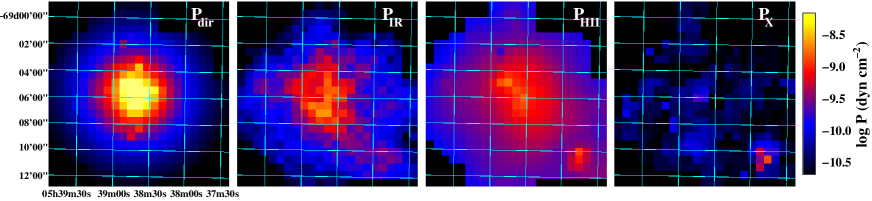
In Figure 12, we give the maps of the four pressures across 30 Doradus for our 441 regions. has a smooth profile due to its dependence, while is fairly uniform across 30 Doradus (as expected for a classical HII region). Compared to those components, and have more variation throughout the source. Additionally, all the maps have significant enhancements in the central regions near R136; in the cases of and , the elevated pressures correspond to the molecular “ridge” in 30 Doradus (as seen in the CO contours in Figure 2). Additionally, all except have greater pressures in the regions near the SNR N157B (the bottom right of the maps).
We can utilize the obtained pressures to estimate the total energy of each component. In particular, we measure the total energy density in a given radius bin of Figure 11 and multiply by the volume of its shell (where we have set the shell thickness to the difference of the upper and lower bound radius of that bin). We convert pressures to energy densities using the relations: , , , and . Using this approach, we find the following total energies for each component: erg, erg, erg, and erg. Therefore, the direct and dust-processed radiation fields and the warm ionized gas contribute similarly to the energetics of the region, and every component is 2 orders of magnitude above the typical kinetic energy of a single SN explosion.
5. Discussion
5.1. Leakage of the Hot Gas
As mentioned previously, the X-ray emission in 30 Doradus arises from the shock-heating of gas to temperatures of K by stellar winds and supernovae (SNe). These feedback processes eventually carve out large cavities, called bubbles and superbubbles, filled with diffuse X-ray emission. In Fig. 11, we demonstrated that the pressure associated with the hot gas is comparatively low relative to the other pressure components. Here, we explore the implications of this result in regard to the trapping/leakage of the hot gas. For this discussion, we will consider stellar winds only and ignore the contribution by SNe; this assumption is reasonable given that the mechanical energy of one SN is on the order of the amount injected by winds over a single massive star’s lifetime (Castor et al., 1975). This assumption is valid at the 0.5 of the LMC: simulations of a star cluster in Starburst99 (Leitherer et al., 1999) showed that the total wind luminosity decreased by roughly a factor of two from the solar to half-solar metallicity case.
There are several competing theoretical models to account for the X-ray luminosity in bubbles and superbubbles. The models of Castor et al. (1975) and Weaver et al. (1977) assumes that the shock-heated gas is completely confined by a cool shell expanding into a uniform-density ISM. An alternative theory proposed by Chevalier & Clegg (1985) ignores the surrounding ISM and employs a steady-state, free-flowing wind. Recently, Harper-Clark & Murray (2009) introduced an intermediate model between these two, whereby the ambient ISM is non-uniform. In this case, only some of the hot gas can escape freely through the holes in the shell.
The fraction of hot gas confined by the shell directly determines the hot gas pressure on the shell as well as the X-ray luminosity within the bubble. If the shell is very porous, the shock-heated gas will escape easily, the wind energy will be lost from the bubble, and the associated pressure and luminosity will be low. By comparison, a more uniform shell will trap the hot gas, retain the wind energy within the bubble, and the corresponding X-ray pressure and luminosity will be much greater. As such, in the latter case, the shocked winds could have a significant role in the dynamics of the HII region. We note that the warm gas is not able to leak similarly because its sound speed is less than the velocities of the shells (20–200 km s-1: Chu & Kennicutt 1994).
To assess whether the hot gas is trapped inside the shell and is dynamically important, we measure the ratio of the hot gas pressure to the direct radiation pressure, , and compare it to what would be if all the wind energy was confined. We can calculate the trapped-wind value using the wind-luminosity relation (Kudritzki et al., 1999; Repolust et al., 2004), which indicates that the momentum flux carried by winds from a star cluster is about half that carried by the radiation field if the cluster samples the entire IMF. Written quantitatively, , where is the mass flux from the winds that launched at a velocity . The mechanical energy loss of the winds is then given by
| (8) |
and the mechanical energy of the winds is simply , where is the time since the winds were launched. Putting these relations together, the trapped X-ray gas pressure is
| (9) |
where is the volume of the HII region.
Given that , then is
| (10) |
where we have set , the velocity of the expanding shell. Finally, we put in terms of and , so that Eq. 10 reduces to
| (11) |
We use the above equation to obtain an order-of-magnitude estimate of if all the wind energy is confined by the shell. We assume a wind velocity km s-1 (the escape velocity from a O6 V star; a reasonable order-of-magnitude estimate, since O3 stellar winds are faster and WR winds would be slower than this value). If we set 25 km s-1 (the expansion velocity over 30 Doradus given by optical spectroscopy; Chu & Kennicutt 1994), then 20.
We can compare this to our observed values for the regions closest to the shell (the ones along the rim of our 441 squares in Fig. 5); Figure 13 shows the histogram of our observed values. We find a mean and median of 0.30 and 0.27, respectively, for our outermost regions. Over 30 Doradus, the highest values of are near the supernova remnant N157B in the southwest corner of 30 Doradus (see Figure 14), where hot gas is being generated and has not had time to vent. Other locations where is elevated are regions with strong X-ray emission and weak H emission. Morphologically, these areas could be where the hot gas is blowing out the 30 Doradus shell.
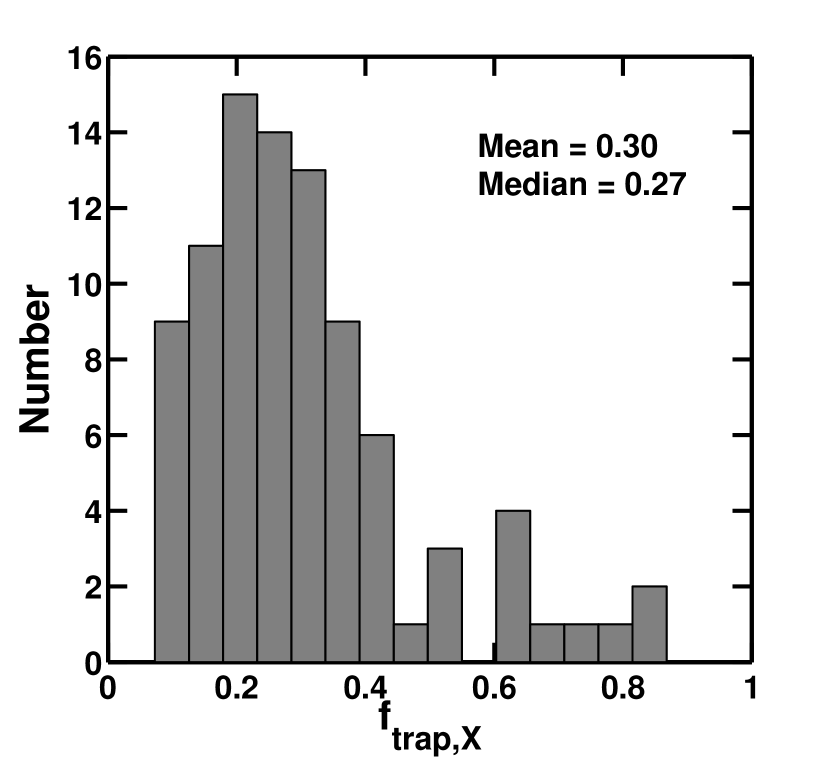
The observed values are 1–2 orders of magnitude below what they would be if the wind was fully confined. As a consequence, we find that of our regions is too low to be completely trapped in the HII region (the Castor et al. model), and the X-ray gas must be leaking through pores in the shell. This result is consistent with the Harper-Clark & Murray model of partial confinement of the hot gas, and the weakness of relative to suggests the hot gas does not play a significant role in the dynamics of the HII region.
We note here that our rim regions in this analysis are 70–130 pc from R136, which is less than the estimated radius of pc. Therefore, our values are lower limits, and the true at the shell may be greater by a factor of a few. Nonetheless, the conclusions would remain the same.
An alternative explanation for the weak X-ray luminosity is that the hot gas mixes with the cool gas, and the hot gas temperature is lowered enough so that the gas can cool efficiently. In that case, the energy is still lost from the system, via radiative cooling instead of the escape of the X-ray emitting material. Far ultraviolet spectroscopy is necessary to determine the level of mixing between the gas components.
5.2. On the Definition of Radiation Pressure
In this paper, we have defined the radiation pressure as related to the energy and momentum flux of the light radiated by the stars in 30 Doradus. Alternatively, radiation pressure could be characterized as the force per unit area exerted by the radiation on matter. The two cases produce divergent results regarding the radial dependence of . In particular, the former case has large close to the star cluster and a decline in with distance from the center. By contrast, the latter predicts small in the HII-region interior, and becomes significant near the neutral shell where the radiation will be absorbed (see Appendix B).
Each definition of radiation pressure reveals distinct information about an HII region. When considering the global dynamics of expansion of an HII region, it is necessary to characterize as the energy density of the radiation field, since that definition reflects the total energy and momentum budget available to drive motion. Alternatively, measurement of the force exerted by radiation on matter facilitates a local estimate of the internal density distribution of an HII region. As we are interested principally on the dynamical role of radiation pressure, we have adopted the former definition of in this paper.
5.3. HII Region Dynamics
In 4, we found that the direct radiation pressure dominates over the ionized gas pressure at radii 75 pc, implying that the radiation has played a role in the dynamics in 30 Doradus. Significant radiation pressure alters the properties of an HII region (e.g., the density profile: Draine 2010) and causes the expansion to proceed differently than in a classical HII region with ionized gas-driven expansion. In particular, Krumholz & Matzner (2009) demonstrated that radiation-driven expansion imparts more momentum to the shell, accelerating the expansion at early times relative to that of gas-driven expansion. Indeed, an additional force must have dominated at early times in 30 Doradus since the shell velocity 25 km s-1 (Chu & Kennicutt, 1994) is too fast to have been gas-driven alone because the HII gas sound speed is 10 km s-1.
To determine the characteristic radius where the HII region shell transitioned from radiation-pressure driven to gas-pressure driven, we can set these pressure terms at the shell equal and solve for . Broadly, the pressures at the shell have different dependences with the shell radius : and . Setting them equal and solving for (Equation 4 in Krumholz & Matzner 2009, the “embedded case”), we find
| (12) |
where is the case-B recombination coefficient and eV, the photon energy necessary to ionize hydrogen. The dimensionless quantity accounts for dust absorption of ionizing photons and for free electrons from elements besides hydrogen; if He is singly ionized and 27% of photons are absorbed by dust (typical for a gas-pressure dominated HII region; McKee & Williams 1997). The represents the factor by which radiation pressure is enhanced by trapping energy in the shell through several mechanisms; the trapped hot gas calculated in 5.1 is one component that can contribute to (as discussed in 5.1). Here, we adopt , as in Krumholz & Matzner (2009). Lastly, is the ratio of bolometric power to the ionizing power in a cluster; we set using the and the relations of Murray & Rahman (2010).
Putting all these terms together, we find 33 pc. Physically, this result means that early in the expansion before it reached a radius of 33 pc, 30 Dor’s dynamics could have been radiation-pressure dominated, and it has since become gas-pressure dominated. Alternatively, it is possible that the hot gas pressure dominated at early times and has become weaker as the HII region expands.
The radiation-driven or hot gas driven expansion at early times in 30 Doradus would have facilitated the expulsion of gas from the central star cluster. In particular, since the warm gas sound speed (10 km s-1) is less than the escape velocity of R136 (20 km s-1, given a mass in a radius = 1 pc; Hunter et al. 1995), an alternative mechanism is necessary to remove the gas and regulate star formation (e.g., Krumholz & Matzner 2009; Fall et al. 2010). We conclude that the radiation pressure or hot gas pressure likely played this role in 30 Doradus, decreasing the available mass to make new stars and slowing star formation in the region.
6. Summary
In this paper, we have utilized multi-wavelength (radio, infrared, optical/UV, and X-ray) imaging to assess the role of several stellar feedback mechanisms in the giant HII region 30 Doradus in the LMC. In particular, we have measured observationally the pressures associated with possible sources of energy and momentum to drive the dynamics of the region: the direct radiation from stars, the dust-processed infrared radiation field, the warm ionized gas from massive stars, and the hot gas shock-heated by stellar winds and supernovae. We have exploited the high-resolution images of 30 Doradus to map these pressure components in 441 square regions, with dimensions of 35′′ 35′′. We have found that the direct radiation pressure from stars dominates at distances less than 75 pc from the central star cluster, whereas the warm ionized gas pressure dominates at larger radii. By contrast, the hot gas pressure and the dust-processed radiation pressure do not contribute significantly, indicating these components are not dynamically important. However, we cannot rule out that the hot gas pressure dominated at early times and has become weaker with the HII region expansion.
We have discussed two implications of our results: the partial confinement of the hot gas and the dynamical role of radiation pressure in 30 Doradus. First, the weakness of the X-ray gas pressure relative to the direct radiation pressure suggests the hot gas is only partially confined and is leaking out of the pores in the HII shell. Secondly, the significant radiation pressure near the star cluster indicates that radiation pressure may have driven the expansion of the HII shell at early times. This result suggests observationally that radiation pressure may be dynamically important in massive star clusters, reinforcing that radiation pressure is a viable mechanism to remove gas from HII regions and to regulate star formation. Indeed, if NGC 2070 was more massive, the radiation pressure could even expel gas at high enough velocities to launch a galactic wind (Murray et al., 2010a).
The work presented here is a first step to measure observationally the relative role of stellar feedback mechanisms in star-forming regions. Although we have applied our techniques to one source, 30 Doradus, our methods to extract dynamical information from multi-wavelength images can be applied to other sources as well. Consequently, we plan to perform these analyses on all the HII regions in the LMC with available data to develop a broad observational understanding of these stellar feedback mechanisms and their role in regulating star formation.
Appendix A Deprojecting the Stars in 30 Dor
Since the stars are viewed in projection, the actual distance to a star from the R136 center is observed as a projected distance (see Figure 15). Therefore, we calculate the direct radiation pressure for two scenarios: one case assuming the stars lie in the same plane (i.e., ; ) and another case where we attempt to “deproject” the stars positions (i.e., , where is the line-of-sight distance to the star from the sphere’s midplane; ). The direct observable is the projected surface brightness (in units of erg cm-2 s-1) in an annulus, and it is a function of . The luminosity density (in units of erg cm-3 s-1) is then related to by
| (A1) |
If we put this integral in terms of , we obtain the relation
| (A2) |
where .

Equation A2 is a Volterra equation of the first kind, and we solve for explicitly for annuli beginning at some radius and taking uniform steps of size inward to . In this case, we selected a radius pc 825.5′′to ensure the entire nebular volume was included. Additionally, we chose a step size of ′′and went inward to ′′(so = 808 steps), the radius of the HST PC image.
Figure 16 (top panel) plots the resulting (and for comparison) versus the distance from R136. The bottom panel gives the fractional difference for all the points in the top panel. The fractional difference between and is small (0.1%–3.0%) for regions 20 pc from R136, and becomes larger (10%–60% for radii 20 pc. Despite these greater fractional differences at smaller radii, would still dominate over the other pressure components in Fig. 11 at distances 75 pc from R136. Additionally, the small fractional differences at distances 20 pc confirms that our values of near the shell are accurate.
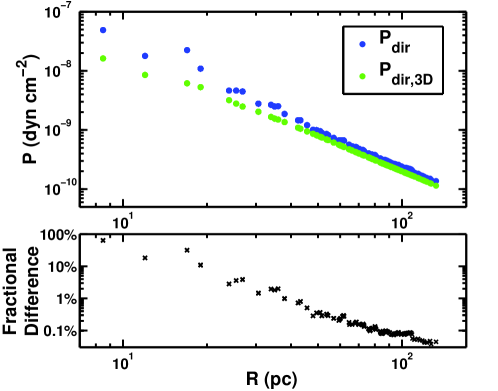
We note in the above calculation, we necessarily assumed that the luminosity in a shell is spherically symmetric. The surface brightness in 30 Doradus is not actually symmetric though (since stars and star clusters are distributed non-uniformly around the nebula), so our estimated values are an approximation of the true, deprojected radiation pressure. Nonetheless, the small differences between and indicate that uncertainty in the star position along the line of sight does not qualitatively affect our results.
Appendix B On the Definition of Radiation Pressure
An alternate definition of radiation pressure than the one used in this paper is to characterize as the force per unit area exerted by the radiation on matter. This case predicts small in the HII-region interior, where the density is small, and only becomes significant near the neutral shell where the radiation is absorbed. To demonstrate this effect, we calculate , the force per unit volume on matter from radiation, as a function of radius in an idealized HII region using Version 08.00 of the photoionization code cloudy (Ferland et al., 1998). Assuming photoionization balance, we have
| (B1) |
where cm3 s-1 is the case-B recombination coefficient of hydrogen at 104 K, , , are the electron, proton, and HI number densities, is the ionizing photon luminosity (in photons s-1) passing through a shell at a given radius , and is the H ionization cross-section.
The force density is given by
| (B2) |
where is the opacity per unit mass (from dust or from neutral hydrogen ), is the local mass density, and is the total flux. Given (where ) and ,
| (B3) |
The first term represents the force of ionizing photon absorption by H atoms and the second term is the force of ionizing photons on the dust. Here, is the mean energy of the ionizing photons, assuming the force in the radiation field is from ionizing photons only. In the following calculation, we set = 15 eV, a value typical of an O star. Similarly, we assume the force on dust is from ionizing photons, and we adopt a dust cross section at 15 eV, cm2/H (Weingartner & Draine, 2001). In the above expression, we set cm-2.
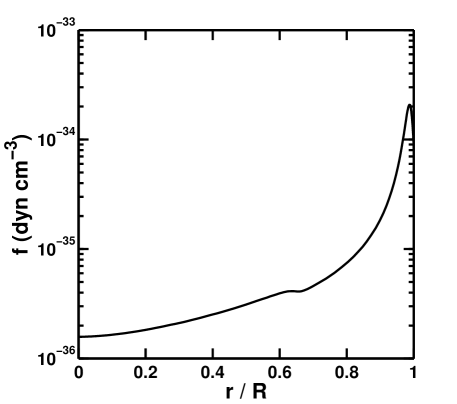
The radial dependence of comes from the density profiles, and . To estimate these parameters as a function of radius in cloudy, we utilize the OSTAR2002 stellar atmosphere model for a metallicity (Lanz & Hubeny, 2003) and stellar temperature of K. In our analysis, we set our idealized HII region to have photons s-1 and cm-3. Additionally, we include the effects of interstellar grains in the calculation.
References
- Andrews & Thompson (2011) Andrews, B. H., & Thompson, T. A. 2011, ApJ, 727, 97
- Ballesteros-Paredes & Hartmann (2007) Ballesteros-Paredes, J., & Hartmann, L. 2007, Revista Mexicana de Astronomia y Astrofisica, 43, 123
- Bradley et al. (2006) Bradley, T. R., Knapen, J. H., Beckman, J. E., & Folkes, S. L. 2006, A&A, 459, L13
- Brandl (2005) Brandl, B. R. 2005, in Astrophysics and Space Science Library, Vol. 329, Starbursts: From 30 Doradus to Lyman Break Galaxies, ed. R. de Grijs & R. M. González Delgado, 49–+
- Castor et al. (1975) Castor, J., McCray, R., & Weaver, R. 1975, ApJ, 200, L107
- Chevalier & Clegg (1985) Chevalier, R. A., & Clegg, A. W. 1985, Nature, 317, 44
- Chu & Kennicutt (1994) Chu, Y., & Kennicutt, Jr., R. C. 1994, ApJ, 425, 720
- Cunningham et al. (2006) Cunningham, A. J., Frank, A., Quillen, A. C., & Blackman, E. G. 2006, ApJ, 653, 416
- Dale et al. (2005) Dale, J. E., Bonnell, I. A., Clarke, C. J., & Bate, M. R. 2005, MNRAS, 358, 291
- Dickel et al. (2005) Dickel, J. R., McIntyre, V. J., Gruendl, R. A., & Milne, D. K. 2005, AJ, 129, 790
- Draine (2010) Draine, B. T. 2010, ArXiv e-prints
- Draine & Li (2007) Draine, B. T., & Li, A. 2007, ApJ, 657, 810
- Elmegreen (2000) Elmegreen, B. G. 2000, ApJ, 530, 277
- Fall et al. (2010) Fall, S. M., Krumholz, M. R., & Matzner, C. D. 2010, ApJ, 710, L142
- Fazio et al. (2004) Fazio, G. G., et al. 2004, ApJS, 154, 10
- Ferland et al. (1998) Ferland, G. J., Korista, K. T., Verner, D. A., Ferguson, J. W., Kingdon, J. B., & Verner, E. M. 1998, PASP, 110, 761
- Freeman et al. (2002) Freeman, P. E., Kashyap, V., Rosner, R., & Lamb, D. Q. 2002, ApJS, 138, 185
- Gordon et al. (2008) Gordon, K. D., Engelbracht, C. W., Rieke, G. H., Misselt, K. A., Smith, J., & Kennicutt, Jr., R. C. 2008, ApJ, 682, 336
- Guhathakurta & Draine (1989) Guhathakurta, P., & Draine, B. T. 1989, ApJ, 345, 230
- Harper-Clark & Murray (2009) Harper-Clark, E., & Murray, N. 2009, ApJ, 693, 1696
- Hartmann et al. (2001) Hartmann, L., Ballesteros-Paredes, J., & Bergin, E. A. 2001, ApJ, 562, 852
- Haynes et al. (1991) Haynes, R. F., et al. 1991, A&A, 252, 475
- Helou et al. (2004) Helou, G., et al. 2004, ApJS, 154, 253
- Hodge et al. (1994a) Hodge, P., Kennicutt, R. C., & Strobel, N. 1994a, PASP, 106, 765
- Hodge et al. (1989a) Hodge, P., Lee, M. G., & Kennicutt, Jr., R. C. 1989a, PASP, 101, 640
- Hodge et al. (1989b) —. 1989b, PASP, 101, 32
- Hodge et al. (1994b) Hodge, P., Strobel, N. V., & Kennicutt, R. C. 1994b, PASP, 106, 309
- Hodge et al. (1999) Hodge, P. W., Balsley, J., Wyder, T. K., & Skelton, B. P. 1999, PASP, 111, 685
- Hunter et al. (1995) Hunter, D. A., Shaya, E. J., Holtzman, J. A., Light, R. M., O’Neil, Jr., E. J., & Lynds, R. 1995, ApJ, 448, 179
- Indebetouw et al. (2009) Indebetouw, R., et al. 2009, ApJ, 694, 84
- Jijina & Adams (1996) Jijina, J., & Adams, F. C. 1996, ApJ, 462, 874
- Johansson et al. (1998) Johansson, L. E. B., et al. 1998, A&A, 331, 857
- Kennicutt (1984) Kennicutt, Jr., R. C. 1984, ApJ, 287, 116
- Kennicutt & Hodge (1986) Kennicutt, Jr., R. C., & Hodge, P. W. 1986, ApJ, 306, 130
- Kennicutt et al. (2008) Kennicutt, Jr., R. C., Lee, J. C., Funes, José G., S. J., Sakai, S., & Akiyama, S. 2008, ApJS, 178, 247
- Knapen et al. (2003) Knapen, J. H., de Jong, R. S., Stedman, S., & Bramich, D. M. 2003, MNRAS, 344, 527
- Krabbe & Copetti (2002) Krabbe, A. C., & Copetti, M. V. F. 2002, A&A, 387, 295
- Krumholz & Matzner (2009) Krumholz, M. R., & Matzner, C. D. 2009, ApJ, 703, 1352
- Krumholz et al. (2006) Krumholz, M. R., Matzner, C. D., & McKee, C. F. 2006, ApJ, 653, 361
- Krumholz & Tan (2007) Krumholz, M. R., & Tan, J. C. 2007, ApJ, 654, 304
- Kudritzki et al. (1999) Kudritzki, R. P., Puls, J., Lennon, D. J., Venn, K. A., Reetz, J., Najarro, F., McCarthy, J. K., & Herrero, A. 1999, A&A, 350, 970
- Kurt & Dufour (1998) Kurt, C. M., & Dufour, R. J. 1998, in Revista Mexicana de Astronomia y Astrofisica, vol. 27, Vol. 7, Revista Mexicana de Astronomia y Astrofisica Conference Series, ed. R. J. Dufour & S. Torres-Peimbert, 202–+
- Lanz & Hubeny (2003) Lanz, T., & Hubeny, I. 2003, ApJS, 146, 417
- Lazendic et al. (2003) Lazendic, J. S., Dickel, J. R., & Jones, P. A. 2003, ApJ, 596, 287
- Leitherer (1997) Leitherer, C. 1997, in Revista Mexicana de Astronomia y Astrofisica, vol. 27, Vol. 6, Revista Mexicana de Astronomia y Astrofisica Conference Series, ed. J. Franco, R. Terlevich, & A. Serrano, 114–+
- Leitherer et al. (1999) Leitherer, C., et al. 1999, ApJS, 123, 3
- Li & Nakamura (2006) Li, Z., & Nakamura, F. 2006, ApJ, 640, L187
- Liedahl et al. (1995) Liedahl, D. A., Osterheld, A. L., & Goldstein, W. H. 1995, ApJ, 438, L115
- Malumuth & Heap (1994) Malumuth, E. M., & Heap, S. R. 1994, AJ, 107, 1054
- Massey & Hunter (1998) Massey, P., & Hunter, D. A. 1998, ApJ, 493, 180
- Mathis et al. (1983) Mathis, J. S., Mezger, P. G., & Panagia, N. 1983, A&A, 128, 212
- Matzner (2002) Matzner, C. D. 2002, ApJ, 566, 302
- Matzner (2007) —. 2007, ApJ, 659, 1394
- McKee & Williams (1997) McKee, C. F., & Williams, J. P. 1997, ApJ, 476, 144
- Meixner et al. (2006) Meixner, M., et al. 2006, AJ, 132, 2268
- Meurer et al. (1997) Meurer, G. R., Heckman, T. M., Lehnert, M. D., Leitherer, C., & Lowenthal, J. 1997, AJ, 114, 54
- Mewe et al. (1985) Mewe, R., Gronenschild, E. H. B. M., & van den Oord, G. H. J. 1985, A&AS, 62, 197
- Mewe et al. (1986) Mewe, R., Lemen, J. R., & van den Oord, G. H. J. 1986, A&AS, 65, 511
- Motte et al. (1998) Motte, F., Andre, P., & Neri, R. 1998, A&A, 336, 150
- Murray et al. (2010a) Murray, N., Ménard, B., & Thompson, T. A. 2010a, ArXiv e-prints
- Murray et al. (2010b) Murray, N., Quataert, E., & Thompson, T. A. 2010b, ApJ, 709, 191
- Murray & Rahman (2010) Murray, N., & Rahman, M. 2010, ApJ, 709, 424
- Nakamura & Li (2008) Nakamura, F., & Li, Z. 2008, ApJ, 687, 354
- Onishi et al. (2002) Onishi, T., Mizuno, A., Kawamura, A., Tachihara, K., & Fukui, Y. 2002, ApJ, 575, 950
- Parker (1993) Parker, J. W. 1993, AJ, 106, 560
- Parker & Garmany (1993) Parker, J. W., & Garmany, C. D. 1993, AJ, 106, 1471
- Peeters et al. (2004) Peeters, E., Spoon, H. W. W., & Tielens, A. G. G. M. 2004, ApJ, 613, 986
- Quillen et al. (2005) Quillen, A. C., Thorndike, S. L., Cunningham, A., Frank, A., Gutermuth, R. A., Blackman, E. G., Pipher, J. L., & Ridge, N. 2005, ApJ, 632, 941
- Repolust et al. (2004) Repolust, T., Puls, J., & Herrero, A. 2004, A&A, 415, 349
- Rieke et al. (2004) Rieke, G. H., et al. 2004, ApJS, 154, 25
- Selman & Melnick (2005) Selman, F. J., & Melnick, J. 2005, A&A, 443, 851
- Shapley et al. (2003) Shapley, A. E., Steidel, C. C., Pettini, M., & Adelberger, K. L. 2003, ApJ, 588, 65
- Smith & MCELS Team (1998) Smith, R. C., & MCELS Team. 1998, Publications Astronomical Society of Australia, 15, 163
- Strobel et al. (1990) Strobel, N. V., Hodge, P., & Kennicutt, Jr., R. C. 1990, PASP, 102, 1241
- Strobel et al. (1991) —. 1991, ApJ, 383, 148
- Tan et al. (2006) Tan, J. C., Krumholz, M. R., & McKee, C. F. 2006, ApJ, 641, L121
- Testi & Sargent (1998) Testi, L., & Sargent, A. I. 1998, ApJ, 508, L91
- Thompson et al. (2005) Thompson, T. A., Quataert, E., & Murray, N. 2005, ApJ, 630, 167
- Townsley et al. (2006a) Townsley, L. K., Broos, P. S., Feigelson, E. D., Brandl, B. R., Chu, Y., Garmire, G. P., & Pavlov, G. G. 2006a, AJ, 131, 2140
- Townsley et al. (2006b) Townsley, L. K., Broos, P. S., Feigelson, E. D., Garmire, G. P., & Getman, K. V. 2006b, AJ, 131, 2164
- Walborn (1991) Walborn, N. R. 1991, in IAU Symposium, Vol. 148, The Magellanic Clouds, ed. R. Haynes & D. Milne, 145–+
- Walborn & Blades (1997) Walborn, N. R., & Blades, J. C. 1997, ApJS, 112, 457
- Wang et al. (2010) Wang, P., Li, Z., Abel, T., & Nakamura, F. 2010, ApJ, 709, 27
- Wang (1999) Wang, Q. D. 1999, ApJ, 510, L139
- Weaver et al. (1977) Weaver, R., McCray, R., Castor, J., Shapiro, P., & Moore, R. 1977, ApJ, 218, 377
- Weingartner & Draine (2001) Weingartner, J. C., & Draine, B. T. 2001, ApJS, 134, 263
- Whitworth (1979) Whitworth, A. 1979, MNRAS, 186, 59
- Williams & McKee (1997) Williams, J. P., & McKee, C. F. 1997, ApJ, 476, 166
- Wyder et al. (1997) Wyder, T. K., Hodge, P. W., & Skelton, B. P. 1997, PASP, 109, 927
- Yorke et al. (1989) Yorke, H. W., Tenorio-Tagle, G., Bodenheimer, P., & Rozyczka, M. 1989, A&A, 216, 207
- Zuckerman & Evans (1974) Zuckerman, B., & Evans, II, N. J. 1974, ApJ, 192, L149