Planetary nebulae in the elliptical galaxy NGC 821: kinematics and distance determination††thanks: Based on data collected at the Subaru Telescope, which is operated by the National Astronomical Observatory of Japan.
Abstract
Using a slitless spectroscopy method with the 8.2 m Subaru telescope and its FOCAS Cassegrain spectrograph, we have increased the number of planetary nebula (PN) detections and PN velocity measurements in the flattened elliptical galaxy NGC 821. A comparison with the detections reported previously by the Planetary Nebula Spectrograph group indicates that we have confirmed most of their detections. The velocities measured by the two groups, using different telescopes, spectrographs and slitless techniques, are in good agreement. We have built a combined sample of 167 PNs and have confirmed the keplerian decline of the line-of-sight velocity dispersion reported previously. We also confirm misaligned rotation from the combined sample. A dark matter halo may exist around this galaxy, but it is not needed to keep the PN velocities below the local escape velocity as calculated from the visible mass. We have measured the (5007) magnitudes of 145 PNs and produced a statistically complete sample of 40 PNs in NGC 821. The resulting PN luminosity function (PNLF) was used to estimate a distance modulus of 31.4 mag, equivalent to 19 Mpc. We also estimated the PN formation rate. NGC 821 becomes the most distant galaxy with a PNLF distance determination. The PNLF distance modulus is smaller than the surface brightness fluctuation (SBF) distance modulus by 0.4 mag. Our kinematic information permits to rule out the idea that a shorter PNLF distance could be produced by the contamination of the PNLF by background galaxies with emission lines redshifted into the on-band filter transmission curve.
1 INTRODUCTION
Planetary nebulae (PNs) are easy to detect in the outskirts of galaxies less distant than 25 Mpc. Once detected, the strong emission lines in PN spectra are well suited for accurate radial velocity measurements. Thus, PNs are useful test particles to study dark matter existence and distribution in halos of elliptical galaxies (Hui et al. 1995; Méndez et al. 2001; Romanowsky et al. 2003; Teodorescu et al. 2005; De Lorenzi et al. 2008, 2009; Méndez et al. 2009; Coccato et al. 2009).
Photometry of the detected PNs permits to build their luminosity function (PNLF), which can be used to provide a distance estimate. PNLF distances play a significant role as a critical link between the Population I and Population II distance scales (Ciardullo et al. 2002; Feldmeier et al. 2007). One unsolved problem involving the PNLF is that Cepheid-calibrated PNLF distances are 0.3 mag smaller than Cepheid-calibrated surface brightness fluctuation (SBF) distances (Ciardullo et al. 2002). We would like to understand why.
PNs in the elliptical galaxy NGC 821 were first studied by Romanowsky et al. (2003), and most recently by Coccato et al. (2009). Using the Planetary Nebulae Spectrograph (PN.S) at the La Palma 4.2 m Herschel telescope, they discovered 127 PNs which they subsequently used to study the kinematics of this galaxy.
The results of the dynamical studies have not been quite conclusive about the presence of dark matter in normal (intermediate mass; not giant) elliptical galaxies. Some of the normal ellipticals show clear evidence of a dark matter halo, like NGC 5128 (Hui et al. 1995; Peng et al. 2004). In some other cases, the line-of-sight velocity dispersion (LOSVD) shows a keplerian decline as a function of distance from the center, which can indicate either the absence of a dark matter halo, or the presence of radial anisotropy in the velocity distribution. Examples are NGC 4697 (Méndez et al. 2001, 2009), NGC 3379 (De Lorenzi et al. 2009), and NGC 821. The degeneracy between mass and radial anisotropy has not been resolved to everybody’s satisfaction. Dekel et al. (2005) say that radial anisotropy is expected from their numerical simulations, while Kormendy et al. (2009), in their comprehensive study of the Virgo cluster ellipticals, say that the normal ellipticals (like the ones that have presented the Keplerian decline of LOSVD) are more isotropic than giant ellipticals (which do frequently show dark matter halos). There is general agreement that radial anisotropy, if present, can explain the Keplerian decline of the LOSVD; but we believe it is fair to say that nobody has produced decisive independent observational evidence of radial anisotropy, so that the issue remains undecided (De Lorenzi et al. 2009; Napolitano et al. 2009).
In the particular case of NGC 821 there is apparently conflicting evidence from a long-slit spectroscopic study by Forestell & Gebhardt (2008), which seems to indicate a non-decreasing LOSVD with radius, in contradiction to what the PNs suggest. Unfortunately, the Forestell & Gebhardt data do not extend beyond 100 arcsec from the center, so it is not possible to compare with the LOSVD from PNs at more than 200 arcsec from the center (Coccato et al. 2009). More recently, two additional absorption-line studies involving NGC 821 have been published. (1) Proctor et al. (2009) used data extracted from Keck DEIMOS multi-object spectroscopy, extending out to about 120 arcsec along the major axis. (2) Weijmans et al. (2009) used the integral-field spectrograph SAURON to extend a previous SAURON study by Emsellem et al. (2004). The data from Weijmans et al. also stop at 120 arcsec along the major axis, and 50 arcsec along the minor axis of NGC 821. Both groups concluded that their LOSVD is in good general agreement with Forestell & Gebhardt, leaving aside a few discrepant points, and they also found good agreement with PN kinematics within their accessible range.
Proctor et al. (2009) did not attempt to discuss the dark matter halo. Weijmans et al. (2009) built Schwarzschild dynamical models and concluded that their best-fit model requires a dark matter halo. Unfortunately, they chose to ignore the PN data points, for consistency, they said, because the PN measurements are not based on integrated stellar light. So their Figure 14 stops at 120 arcsec from the center of NGC 821, and we cannot see how well their best-fit model is able to fit the substantially lower PN LOSVD at 200 arcsec. As a consequence, we are left with the impression that the kinematic information provided by PNs is still irreplaceable, but on the other hand it is still being rejected sometimes as unreliable.
Our original motivation was to make a deeper PN survey in NGC 821, and use the expected increase in the number of PN detections to improve the statistics and reach a clearer conclusion about the dark matter content in this particular case. After two observing runs with the 8.2 m Subaru telescope and its Cassegrain imaging spectrograph FOCAS, we were able to increase the number of detected PN candidates, but not as much as we hoped, because of bad weather and poor seeing in the second run. We concluded that a sophisticated modeling effort would again fail to give a decisive contribution. Instead, we focused on providing some useful information.
Our goals in this paper are: (1) to compare our detections, PN positions and radial velocities with those measured by the PN.S group with a different telescope, spectrograph and technique; which might contribute to an easier acceptance of the PN kinematic results. (2) to use our photometry to build for the first time the PNLF of NGC 821, estimate its PNLF distance, and compare it with the SBF distance. Since recently many SBF distances in the Virgo and Fornax clusters were redetermined using the Hubble Space Telescope Advanced Camera for Surveys (Blakeslee et al. 2009), we think it is timely to revisit the PNLF–SBF distance comparison.
Section 2 describes our observations, reductions and radial velocity calibrations. In Section 3 we compare our results with those obtained by the PN.S group. Sections 4, 5 and 6 present the kinematic results from 167 PNs and their interpretation. In Section 7 we describe the PN photometry. In Section 8 we build the PNLF, make a PNLF distance determination and estimate the PN formation rate. Section 9 deals with the persistent discrepancy between PNLF and SBF distances. In Section 10 we give a summary of our conclusions.
2 OBSERVATIONS, REDUCTIONS, AND RADIAL VELOCITY CALIBRATIONS
2.1 Observations
The observations were made by one of us (RHM) with the Faint Object Camera and Spectrograph (FOCAS; Kashikawa et al. 2002) attached to the Cassegrain focus of the 8.2 m Subaru telescope, Mauna Kea, Hawaii, on three nights, 2004 November 7, 8 and 9. The nights were dark, of photometric quality, and with average seeing of 0′′.7, 1′′, and 0′′.5 on the first, second and third night, respectively.
The field of view of FOCAS is 6.5 arcmin and is covered by two CCDs of 2k 4k (pixel size 15 m) with an unexposed gap of 5′′ between them. For simplicity, we will call the 2 CCDs Chip 1 and Chip 2. The image scale is 0.104 arcsec pixel-1. The purpose of this project was to discover the PNs using the classical on-band, off-band filter technique (see Section 2.2); then measure the brightness and the radial velocities of the discovered sources. The radial velocities were measured using a slitless method (see Section 2.2) involving images taken through both the on-band filter and an echelle grism. The on-band filter has a central wavelength of 5025 Å, a FWHM of 60 Å, a peak transmission of 0.68 and an equivalent width of 40 Å. In total, 15 off-band images (exposure time 140 s), 16 on-band images (exposure time 1400 s) and 16 grism + on-band images (exposure time 2100s) were taken. For the photometric calibration, on-band images of the spectrophotometric standard LTT 9491 (Oke 1990) were taken. For the wavelength calibration, after each grism exposure, an engineering mask was inserted in the light path, and on-band and grism + on-band images were obtained illuminating the mask with the comparison lamp. In addition, on-band and grism+on-band images of the engineering mask were taken illuminating the mask with the Galactic PN NGC 7293 (PNG 036.1-57.1), for radial velocity quality control. Examples of the calibration images are shown in Figure 2 of Méndez et al. (2009). Table 1 shows the log of the most important images used in this work.
2.2 PN detection and slitless spectroscopy with Subaru and FOCAS
The traditional on-band, off-band filter technique was used for the detection of the PNs in NGC 821. The on-band image is taken through a narrow-band filter passing the redshifted [O III] 5007 nebular emission line, while the off-band image is taken through a broader filter passing no nebular emissions. The PNs are visible as point sources in the on-band image, but are absent in the off-band image. A third image, taken through the on-band filter and a grism, confirms the PN candidates. By inserting the grism in the light path, the images of all continuum sources are transformed into segments of width determined by the on-band filter transmission curve. All the emission-line point sources such as the PNs remain as point sources. The grism also introduces a shift relative to the undispersed on-band image which is a function of the wavelength of the nebular emission line and of position on the CCD. By calibrating this shift, we are able to measure the radial velocities for all emission-line objects in the field. In the case of Subaru and FOCAS the dispersing element was an echelle grism with 175 grooves/mm which operates in the 4th order and gives a dispersion of 0.5 Å/pixel, with an efficiency of 60% (see Subaru FOCAS website). Typical images with seeing around 0.5 arc second have a Point Spread Function size of 5 pixels, which translates into a radial velocity resolution of 140 km s-1, i.e. the PN’s internal velocity field is not resolved. Assuming position errors of 0.4 pixel, the expected uncertainty in radial velocity is 12 km s-1.
2.3 Data reduction
Standard IRAF111IRAF is distributed by the National Optical Astronomical Observatories, operated by the Association of Universities for Research in Astronomy, Inc., under contract to the National Science Foundation tasks were used for the basic CCD reductions (bias subtraction, flat-field correction using twilight flats). In order to eliminate the cosmic rays and to detect faint PN candidates, we needed to combine the scientific images of NGC 821: First, for each field, Chip 1 and Chip 2, we chose as reference images one pair of undispersed and dispersed on-band individual images of the best possible quality. All the other available images, including the off-band ones, were registered on the corresponding reference image. Any possible displacements due to guiding problems or deformations in the spectrograph were thus reduced to a minimum. The registration was done with the IRAF tasks “geomap” and “gregister” and about 30 stars for each field were used. In the end, we obtained residuals smaller than 0.2 pixel.
The registration of the dispersed images was more difficult. Since we could not detect enough PNs on the individual images, we had to instead use the spectral segments produced by normal stars for the registration. To minimize the temperature shifts in the position of the spectral segments, we divided the grism images into groups having approximately the same temperature (which was obtained for each grism image from the corresponding FITS header). This time, the registration proceeded in two steps: First, the images in each group were registered. Then, the resulting registered images of each group were registered on the image with the best quality. We calculated the centroid of each segment using the FORTRAN 90 program “centroid” written by David Tholen. About 10 stars were used for both fields and residuals around 0.3 pixel were obtained. An error of 0.4 pixel in the distance between undispersed and dispersed images would produce an error of 12 km s-1 in radial velocity. Having obtained a satisfactory registration, we produced the combined on-band, off-band and dispersed images for Chip 1 and Chip 2 fields using the IRAF task “imcombine”.
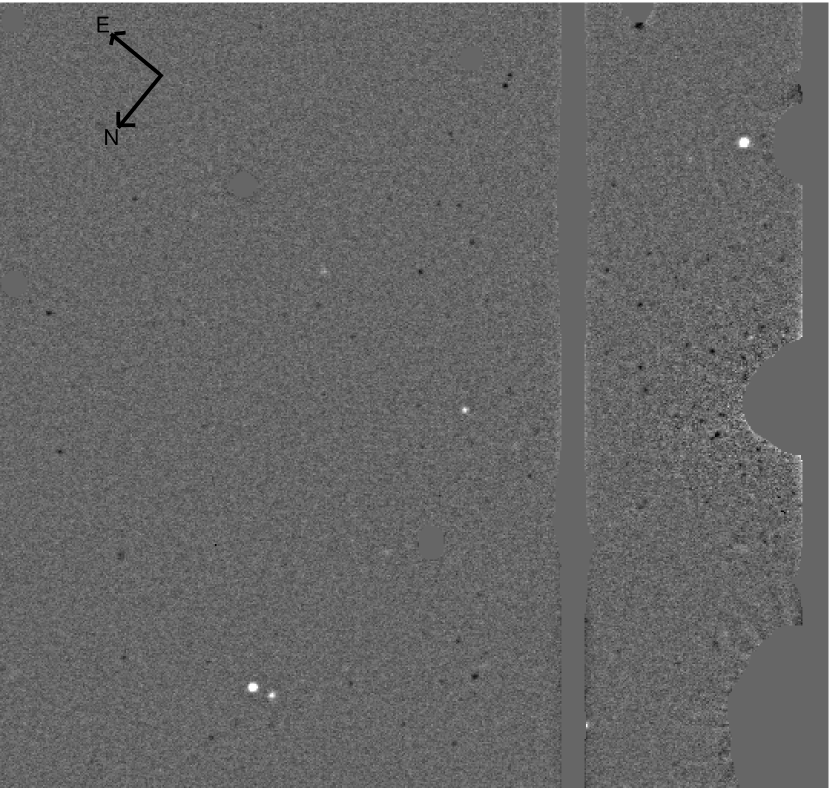
For easier PN detection and photometry in the central parts of NGC 821, where the background varies strongly across the field, we produced difference images between undispersed on-band and off-band combined frames. In ideal conditions this image subtraction should produce a flat noise frame with the emission-line sources as the only visible features. A critical requirement to achieve the desired result is perfect matching of the point-spread functions (PSFs) of the two frames to be subtracted. For this purpose, we applied a method for “optimal image subtraction” developed by Alard & Lupton (1998), and implemented in Munich by Gössl & Riffeser (2002) as part of their image reduction pipeline. Figure 1 shows part of the resulting difference image from Chip 2.
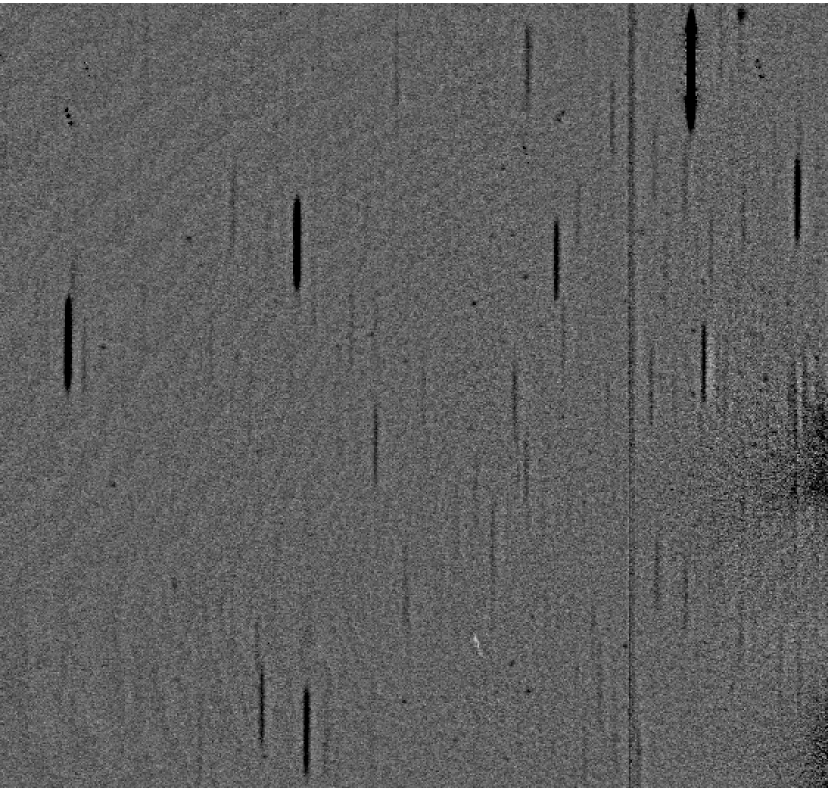
This procedure cannot be used for the combined dispersed images because there is no off-band counterpart. Therefore, to flatten the background and reduce the contamination by stellar spectra, we applied the IRAF task “fmedian” to the combined Chip 1 and Chip 2 dispersed images. The resulting median images were then subtracted from the unmedianed ones. Figure 2 shows the result for the same field shown in Figure 1.
2.4 Astrometry
We identified the PN candidates by blinking the on-band versus the off-band difference images and confirmed them by blinking on-band versus dispersed. In addition, the object had to be a point source and to be undetectable in the off-band image. In this way it is possible to minimize the contamination of the PN sample by unrelated background sources, like galaxies with emission lines redshifted into the on-band filter transmission curve. We will further discuss background contamination in Sections 5 and 8. The pixel coordinates of all the candidates in the undispersed and dispersed images were measured with the IRAF task “phot” with the centering algorithm “centroid”.
We performed an astrometric calibration of the images using the USNO-B1 astrometric star catalog (Monet et al. 2003). We found 11 astrometric stars on Chip 1 and 13 astrometric stars on Chip 2. We used a software written by David Tholen which is able to perform up to a quartic fit of the stars in a field. This software is usually used to produce very accurate astrometry needed for determining the positions of asteroids. Because of the relatively small size of the field in a chip, a simple linear fit was sufficient. The astrometric rms of the fit is composed by three components: (1) the contribution of the centroiding error, which our software is capable to keep under a few tenths of a pixel (a few hundredths of an arcsecond) even for objects with a S/N near 5; (2) the contribution of the random error of the stars, which, for a single star is of the order of 0′′.2, but which is going with the square root of the number of stars used (in our case the total contribution is of the order of few hundredths of an arcsecond); (3) the systematic error of the catalog, which is estimated to be around 0′′.2. We estimate an rms of about 0′′.3 for the astrometry of our catalog of PNs.
2.5 Radial velocity calibrations
In order to determine the shift produced by the insertion of the grism as a function of wavelength and position on the CCD, we used an engineering mask that produces an array of point sources when it is illuminated with the internal FOCAS lamps or any extended astronomical source. The full mask is made up of almost 1000 calibration points, separated by almost 100 pixels. We also used exposures of NGC 7293, a local PN with a large angular size that allowed us to obtain calibration measurements all across the FOCAS field. An example of these calibration images is shown in Figure 2 of Méndez et al. (2009). The procedure for wavelength measurement is explained in Section 3 of that paper, to which we refer the interested reader.
To test for the presence of any systematic errors in the radial velocities, we use the images of NGC 7293 as follows. We can measure radial velocities in two ways: (a) classical, using each mask hole as a slit, and (b) slitless, using the displacement as a measure of wavelength and therefore velocity. The comparison between slitless versus classical measurement is shown in Figure 3 for both Chip 1 and Chip 2. Since we are measuring the velocity of different gas elements in NGC 7293, we expect to get a range of velocities across the field. There is good agreement between classical and slitless measurements. The average heliocentric velocity of NGC 7293 from all the grid points is about 30 km s-1, in good agreement with recent measurements of the systemic velocity (27 km s-1; Meaburn et al. 2005). For a more detailed discussion, please see Méndez et al. (2009). We conservatively estimate the calibration errors in FOCAS slitless radial velocities to be of the order of 10 km s-1.
If we add quadratically the uncertainties in velocity given by the calibration errors ( 10 km s-1, the position errors ( 10 km s-1, Section 2.2), and the errors from image registration ( 10 km s-1, Section 2.3), we get an overall error of about 17 km s-1. Assuming that the spectrograph deformations and guiding errors have a marginal contribution, we estimate the total uncertainty in the velocities measured with Subaru to be at most 20 km s-1.
3 THE FOCAS SAMPLE AND COMPARISON WITH THE PN.S SAMPLE
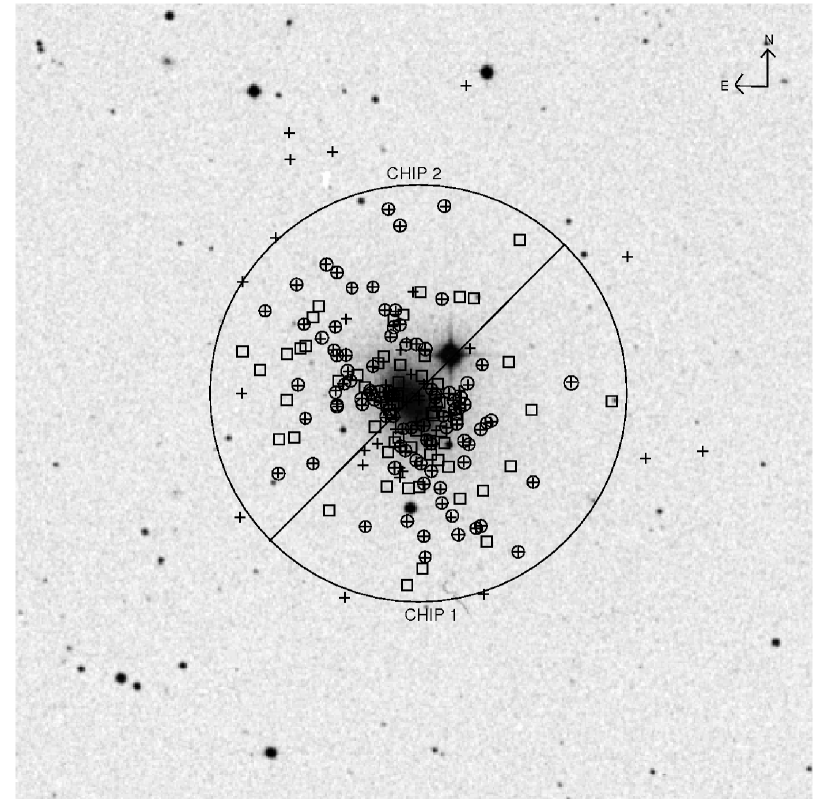
We have found 155 PN candidates in NGC 821 with Subaru and FOCAS. The list of detected objects is given in Table 2. We identified 85 PNs in common with the PN.S sample, and those are indicated in Table 2. We could not confirm a detection for 19 PN.S objects within the FOCAS field we observed. There are 23 PN.S objects reported outside of the FOCAS field or in places we could not see (the 5′′ gap between Chips 1 and 2, and some bad columns, mostly in Chip 1). Thus we have been able to increase the total number of PN candidates from 127 reported by the PN.S group to 178. Figure 4 shows the distribution of the PN candidates across NGC 821. In Figure 5 we present the comparison of equatorial coordinates measured by both groups, and in Figure 6 we compare the velocities. In Figure 5 we observe an offset of almost 2′′ in between the PN.S sample and the FOCAS sample, while the differences in give reasonably good agreement within 1′′.
The offset and higher residuals in between the PN.S and the FOCAS sample are most probably caused by uncertainty in the zero point of the PN.S astrometry. In the PN.S counterdispersed imaging method there is no undispersed image, and the position of a reference star is determined by calculating the centroid of the stellar spectrum segments in the counterdispersed images. Since the stars are dispersed in the E-W direction, it becomes more difficult to measure the Right Ascension. For example, the centroid calculation may be sensitive to the presence of absorption features near one edge of the filter transmission curve, and this will depend on the spectral types of the stars used (L. Coccato 2009, private communication).
In Figure 5 we have indicated 8 cases (identified with the FOCAS numbers in Table 2) where we have detections lying close to reported PN.S detections. However, since and are too large, we do not consider these PN.S detections to be confirmed by our images. There is one marginal case, our object 242, which lies at the edge of the elongated cloud of confirmed sources. However, in this case our velocity is completely different, as shown in Figure 6; because of that, we do not count this as a confirmation of the PN.S detection. In fact, this PN.S object (number 92 in their list) was considered an outlier by the PN.S team, and was not included in the final sample they used for their kinematic study.
Figure 6 shows that there is good agreement between both sets of velocities. Having eliminated object 242 from the comparison, we find a standard deviation of 31 km s-1, which is expected, given the error bars reported by both groups.
4 PRELIMINARY ANALYSIS OF PN RADIAL VELOCITIES
We will refer to our heliocentric radial velocities determined with the slitless method simply as ’velocities’. We could measure the velocities for 140 of the 155 PN candidates listed in Table 2 (some objects could not be measured on the grism images because of background contamination problems, or bad columns, or because the displacement produced by the grism put the sources outside of our field). Since we found good agreement between the velocities measured with both techniques, as shown in Figure 6, we decided to use the PN.S velocities in those few cases (five) where a detection was confirmed but we could not make a velocity measurement. We also added the 23 PN.S velocities measured outside of the FOCAS field or in places we could not see.
After these additions, the total sample of PN candidates (FOCAS + PN.S) discovered in NGC 821 with measured velocities amounts to 168. Figure 7 shows the (,) coordinates of the 168 PN candidates relative to the center of NGC 821, adopted to be at 2h 08m 21.4s, . The coordinate runs in the direction of increasing along the major axis of NGC 821, defined to be at PA = 25∘ (from N through E). Figures 8 and 9 show the PN candidate velocities as a function of the -coordinate in arcsecs and the -coordinate in arcsecs, respectively. The average velocity of 1706 km s-1 is in good agreement, within the uncertainties, with the NASA/IPAC Extragalactic Database (NED) radial velocity of 1735 km s-1. We estimate the PN average velocity uncertainty to be approximately 20 km s-1, from a velocity dispersion of the order of 150 km s-1 (see Section 5), the number of PNs measured, and the possible systematic error of 10 km s-1 in our velocities from the calibration procedure using NGC 7293.
In Figures 8 and 9, we find one object with a too low velocity if interpreted as a 5007 Å emitter: it is FOCAS number 104 in Table 2. It may appear to be a marginal case, but we will see in next section, in the plot related to escape velocities, that this object has the wrong velocity for NGC 821, and it must be a background galaxy with some emission line that has been redshifted into the on-band filter transmission curve. Therefore we decided to reject object 104 and work with a sample of 167 PNs with known velocities.
5 LINE-OF-SIGHT VELOCITY DISPERSIONS AND ESCAPE VELOCITIES
As already mentioned, Romanowsky et al. (2003) and Coccato et al. (2009) found a decreasing line-of-sight velocity dispersion (LOSVD) which could imply a dearth of dark matter in this galaxy. We want to verify if our velocities confirm this result. For that purpose we subdivide our 167 PN sample into five elliptical annuli, with shapes similar to that of NGC 821, at increasing angular distances from the center of NGC 821. The numbers of PNs per annulus, from the inside out, are 48, 48, 23, 27, and 19, respectively. For all PNs within each elliptical annulus we calculate the average angular distance to the center, and the LOSVD. The result of this calculation is shown in Figure 10. It looks very similar to plots shown by Romanowsky et al. (2003) and Coccato et al. (2009), so essentially we have confirmed their results. Figure 10 also shows LOSVDs derived from long-slit absorption-line spectra of NGC 821 (Forestell & Gebhardt 2008). We also added SAURON data taken from Weijmans et al. (2009). We find marginal agreement, within error bars, between PNs and absorption-line data within 100′′ of the galaxy’s center. We have tried several different versions of Figure 10, using different sets of PN data: vertical regions instead of ellipses, or FOCAS data only, but the PNs always give more or less the same result, confirming the keplerian decline of the LOSVD as previously reported.
In Figure 10, we fit the run of the LOSVD with angular distance from the center of NGC 821 using an analytical model developed by Hernquist (1990). This model is spherical, nonrotating, isotropic, and it assumes a constant mass-to-light ratio (no dark matter). The fit is obtained by adopting a total mass of 2 and an effective radius = 39′′ (Blakeslee et al. 2001), which is equivalent to 4.16 kpc for a distance of 22 Mpc. Of course this Hernquist model is just a rough first approximation, but it has been shown, in another case of a similarly flattened elliptical galaxy (NGC 4697, Méndez et al. 2009), to give a result which is similar, within 20%, to that of the more sophisticated NMAGIC model of De Lorenzi et al. (2008).
The mass of 2 is obtained directly by fitting the LOSVD with the Hernquist model. Note that a similar (although slightly larger) mass can be obtained in another way: taking the ratio from Gebhardt et al. (2003), as tabulated by Napolitano et al. (2005), which is 8.4 in the band. If we combine this with a luminosity of 2.7 (which in turn is obtained from = -20.6 for NGC 821 and = 5.48 for the Sun), we obtain a mass of 2.3 .
We can make another test, by plotting PN radial velocities as a function of angular distance from the center of NGC 821. Suppose we compare with the local escape velocity for the Hernquist model with constant mass-to-light ratio used in Figure 10. The escape velocity is given by:
| (1) |
where is the total mass, and is a scale length equal to . In the presence of a substantial dark matter halo, we would expect some PNs to show velocities in excess of the escape velocity (which was calculated under the assumption of no dark matter), as it happened in the case of NGC 5128 (Hui et al. 1995; Peng et al. 2004).
The comparison is shown in Figure 11. Even if we reduce the galaxy’s mass by 20%, going in the same direction as with NGC 4697 (Méndez et al. 2009), we find no object exceeding or even approaching the local escape velocity. The only exception is FOCAS object 104 in Table 2, which is so distant from the galaxy’s distribution that it must be a background galaxy, as argued above. Although this kind of argument cannot prove the absence of dark matter, it does indicate that any existing dark matter halo is even less conspicuous than that of NGC 4697, the evidence for which was in itself inconclusive. Therefore, it remains quite possible that less massive ellipticals have, on average, lower dark matter fractions than the more massive ellipticals (e.g., Napolitano et al. 2005, 2009), NGC 821 being another example of this trend.
6 ROTATION
We have used our enlarged PN sample to verify a statement by Coccato et al. (2009): that the velocity field of NGC 821 as defined by the PNs shows a rotation of about 120 km s-1 with a misalignment of 56 degrees between the photometric major axis and the PN kinematic major axis. This result differs from the rotation as indicated by stellar absorption-line data (SAURON team, Emsellem et al. 2004; and Proctor et al. 2009). The two different data sets are not in conflict, however, because the rotational signal from the stars is limited to an area within 70 arcsec from the center of NGC 821 (see Figure 18 in Proctor et al. (2009), while the rotational signal from the PNs becomes significant only outside of about 70 arcsec from the center. This is of course because of the higher LOSVD close to the center, and the comparatively small number of PNs detected there. But still it is interesting to find the outer regions showing rotation in a direction that differs from that of the central region, and so it is worth checking with a larger PN sample.
The result of the test is shown in Figures 12 and 13. Instead of producing a smoothed PN two-dimensional velocity field, as in Coccato et al. (2009), we prefer to avoid any smoothing operations, and work with thick cuts in different directions, which we find easy to interpret. In Figure 12 we have adopted the same orientation as in Figure 3 of Coccato et al. (2009), with the major axis of NGC 821 in the vertical direction. So the and axes defined for our Figures 7-9 run vertically and horizontally, respectively. We selected this orientation because it helps to compare our results with those of Coccato et al. The left panel of Figure 12 shows a kinematic axis inclined 0 degrees with respect to the photometric major axis. We select all PNs within 40 arcsec of the kinematic axis, divide them into four bins, and calculate the average velocity for each bin, which is then plotted in the right panel. The result is no significant rotation in this direction.
Figure 13 shows two similar plots, corresponding to a kinematic axis inclined 56 degrees with respect to the photometric major axis. In this case the four bins produce a significant velocity gradient, as seen in the right panel. Note how the squares lie on the approaching side and the crosses lie on the receding side, exactly as in Figure 3 of Coccato et al. We have built similar figures for kinematic axes in all orientations relative to the photometric major axis, which we do not show for brevity. We conclude that the maximum rotational signal occurs for an angle of 5620 degrees, as reported by Coccato et al. So we have essentially confirmed their results.
7 PHOTOMETRY
We could obtain photometry for 145 out of the 155 sources listed in our catalog (Table 2). The [O III] 5007Å fluxes measured through the on-band filter are traditionally expressed in magnitudes (5007), using the definition introduced by Jacoby (1989),
| (2) |
For the flux calibration, we adopted the standard star LTT 9491 (Oke 1990). This star has a monochromatic flux at 5025 Å of 1.075 10-14 ergs cm-2 s-1 Å-1 (Colina & Bohlin 1994). The flux measured through the on-band filter, in units of ergs cm-2 s-1, can be calculated knowing the equivalent width of the on-band filter; using equation (2), we find (5007)=17.18 for LTT 9491.
Most PNs were measurable only on the differences of the combined images (on off). Thus, to calculate the (5007) of the PNs we had to go through several steps. First, we made aperture photometry of LTT 9491 using the IRAF task “phot”. The FWHM of LTT 9491 was between 3 and 4.5 pixels. We adopted an aperture radius of 20 pixels; the sky annulus had an inner radius of 25 pixels and a width of 5 pixels. The same parameters were used to make aperture photometry of four moderately bright stars in the reference images corresponding to both fields. These four “internal standards” were selected relatively distant from the center of NGC 821 to avoid background problems.
Having tied the spectrophotometric standard to the internal frame standards, we switched to strictly differential photometry. We made aperture photometry of the internal standards on the Chip 1 and Chip 2 on-band combined images to correct for any differences relative to the reference images. On the same on-band combined images we subsequentely made PSF-fitting DAOPHOT photometry (Stetson 1987; IRAF tasks “phot”, “psf” and “allstar”) of the internal standards and four bright PNs. From the aperture photometry and PSF-fitting photometry of the internal standards we determined the aperture correction. Finally, we made PSF-fitting photometry of all PN candidates on the difference images (onband offband), where the stars had been eliminated. The four bright PNs were used to tie this photometry to that of the standards. The internal errors in the photometry of the difference images were estimated to be below 5%. Applying a final correction related to the peak of the on-band filter transmission curve (see Jacoby et al. 1987), we obtained (5007) for the 145 PNs.
8 THE PNLF, DISTANCE, AND PN FORMATION RATE
Having measured the apparent magnitudes (5007), we needed to produce a statistically complete sample, because the detectability of a PN varies with the background brightness. For this purpose we used a procedure already described in Section 5 of Méndez et al. (2001). In summary, we eliminated all PNs fainter than (5007)=28.0, beyond which the number of PNs per bin shows a marked decrease, and we also eliminated all PNs within a zone of exclusion characterized by high background counts and more difficult detectability. This zone of exclusion was an ellipse at the center of NGC 821, with minor and major semiaxes of 30 and 55 arcsec respectively. In this way, we got a statistically complete sample of 40 PNs.
The PN luminosity function (PNLF) was built, using 0.2 mag bins, and compared with simulated PNLFs like those used by Méndez & Soffner (1997) to fit the observed PNLF of M 31. The comparison is shown in Figure 14. The absolute magnitudes (5007) that produce the best fit to the simulated PNLF were calculated using an extinction correction of 0.385 mag at 5007 Å (from data listed in NED; see Schlegel et al. 1998) and a distance modulus = 31.4, which is equivalent to 19 Mpc. The simulated PNLFs plotted in Figure 14 are binned, like the observed one, into 0.2 mag intervals and have maximum final mass of 0.63 , = 1, and sample sizes between 1200 and 3400 PNs (see Méndez & Soffner 1997; the “sample size” is the total number of PNs, detected or not, that exist in the surveyed area). We estimated an error of 0.1 mag from the goodness of the fit at different distance moduli. To obtain the total error estimate, we have to combine the possible systematic and random errors. The systematic error is the same as in Jacoby et al. (1990), i.e., 0.13 mag, including the possible error in the distance to M 31, in the modeling of the PNLF and in the foreground extinction. The random contributions are given by 0.1 mag from the fit to the PNLF, 0.05 mag from the photometric zero point, and 0.05 mag from the filter calibration. Combining all these errors quadratically, we estimate that the total error bar for the PNLF distance modulus is 0.2 mag. The PNLF distance modulus, 31.4, is smaller than the SBF distance modulus (31.9, according to Tonry et al. 2001).
We would like to show that the use of the traditional analytical PNLF with a universal cutoff at (e.g., Ciardullo et al. 2002) gives a very similar distance estimate, as demonstrated by Figure 15. The effect of sample size on the PNLF distance happens, if at all, only for a larger sample size, like that obtained for NGC 4697 by Méndez et al. (2001). In that case the PNLF distance modulus from simulated PNLFs was 30.1, which in our opinion is more reliable than the smaller 29.9 obtained from the same data by Ciardullo et al. (2002) using the analytical PNLF.
Once the sample size from Figure 14 is known, we can calculate the specific PN formation rate in units of PNs yr-1 -1,
| (3) |
where is the sample size, is the total bolometric luminosity of the sampled population, expressed in , and is the lifetime of a PN, for which 30,000 yr was adopted in the PNLF simulations. We have =11.67, = 0.93 (de Vaucouleurs et al. 1991), = 0.47 (from data listed in NED, NASA/IPAC Extragalactic Database), and a bolometric correction of 0.8 mag (Buzzoni et al. 2006) from which we obtain an extinction-corrected apparent bolometric magnitude 9.47. Using a distance modulus of 31.4 and a solar =4.72, we calculate the total luminosity of NGC 821 to be 4.6 1010 .
Now we must consider that the statistically complete PN sample was built by excluding an elliptical region at the center of the galaxy. We estimate that the excluded region of NGC 821 contributes 60% of the total luminosity, and we conclude that the luminosity effectively sampled is = 1.8 1010 . Adopting = 2200 from Figure 12, we obtain = (4 2) 10-12 PNs yr-1 -1.
We can also express the PN formation rate as . Using that definition, we find log = 6.91. An inspection of, for example, Figure 12 in Buzzoni et al. (2006) shows that the of NGC 821 is perfectly comparable, within the uncertainties, to that of other similar elliptical galaxies.
9 COMPARISON OF PNLF AND SBF DISTANCES
Ciardullo et al. (2002) have reported a systematic discrepancy between distances determined from the PNLF and distances derived from the method of surface brightness fluctuations (SBF; Tonry et al. 2001). From a comparison of distances to 28 galaxies, Ciardullo et al. reported that the PNLF distance moduli were smaller than the SBF moduli by 0.3 mag. This situation has not been explained in any satisfactory way, in particular because both methods have been calibrated using Cepheid distances.
In the meantime, a few more PNLF distances for rather distant galaxies have been added: NGC 1344 in Fornax (Teodorescu et al. 2005), and the result we have just reported on NGC 821, which is the most distant galaxy for which a PNLF distance determination has been attempted. On the other hand, the SBF distance scale of Tonry et al. (2001) has been recalibrated in such a way that those ground-based SBF distances have become smaller in modulus by 0.06 mag (Blakeslee, private communication). For example, the SBF distance modulus of NGC 821 becomes 31.8. Furthermore, many SBF distances have been redetermined, and in all likelihood improved, using images obtained with the Hubble Space Telescope (HST) Advanced Camera for Surveys (ACS) (Blakeslee et al. 2009). Therefore we have decided to make a new comparison of PNLF versus SBF distances, to put our results for NGC 821 and NGC 1344 in context.
We have used our own PNLF distances for NGC 4697, NGC 1344 and NGC 821. The PNLF distances for the other galaxies are taken from Feldmeier et al. (2007) and Ciardullo et al. (2002). Concerning SBF distances, we have taken the Virgo and Fornax data, as well as NGC 4697, from Blakeslee et al. (2009). All the others, including NGC 821, are from Tonry et al. (2001), corrected by 0.06 mag. In Figure 16 we show, for a total of 23 galaxies, the difference in distance modulus between the PNLF and SBF as a function of the SBF distance modulus. We might have expected the PNLF-SBF discrepancy to be slightly reduced, because of the SBF recalibration; but in fact it has become slightly larger, because the new ACS distances are a bit larger for several galaxies with PNLF distance. For example, the SBF distance of NGC 4697 has gone from 30.29 to 30.49, and that of NGC 1344 from 31.42 to 31.60. NGC 821 also shows a rather large discrepancy. So looking at SBF distance moduli between 31 and 32 mag, we get the impression that the PNLF-SBF discrepancy is now mag.
Is there any evidence that the discrepancy increases with distance? We would agree with Ciardullo et al. (2002) that the evidence is perhaps suggestive but not convincing, because there are a few galaxies at much shorter distances (NGC 5128, M81) with as big a negative difference. More information will be needed at distance moduli between 28 and 30. This possible dependence on distance deserves careful consideration, because a clear explanation for its existence could be contamination by background galaxies like object 104 in Table 2, discussed before. If there were many of those, the corrected PNLF would become fainter, and a fit to the simulated PNLF would require a larger PNLF distance, removing the discrepancy with the SBF distance. However, our kinematic studies of NGC 1344 and NGC 821 can be used to reject the idea. Such a numerous population of background galaxies, if interpreted as 5007 Å emitters, would be expected to show a uniform distribution in velocity across the on-band filter transmission curve, which has a width in velocity of 3600 km s-1. In fact, this is exactly what happened in the spectroscopic investigation of a group of candidate Virgo intracluster PNs by Kudritzki et al. (2000), where those candidates were shown to be background Ly emitters. In the cases of NGC 1344 and NGC 821, only one such contaminating source was found in each galaxy, which is not enough to affect our PNLF distance determinations, even if we assume that there are a few others at the “right” velocity to avoid detection. The only way to be completely sure is of course spectroscopic confirmation of the PN nature of the brightest sources, by detecting a second emission line, which would require a large amount of big telescope time. There is a motivation, however: the desire to learn about the abundances of the PNs in these distant elliptical galaxies. So perhaps the test will be made at some future time. We should add that one such test has already been made on the not so distant galaxy NGC 4697 (11 Mpc, Méndez et al. 2005). All the tested sources were confirmed as PNs.
Having rejected the background galaxy contamination theory, the best explanation for the PNLF-SBF discrepancy is still extinction effects (Ciardullo et al. 2002). Confirmation of this idea on the PNLF side will likewise require deep spectra of the brightest detected PNs. Again we can mention NGC 4697: the PN spectra of Méndez et al. (2005) show low or moderate internal extinction, of the order of 0.2 mag on average, which appears to be similar to the amount of internal extinction detected in PNs belonging to the PNLF calibrating galaxy M 31 by Ciardullo & Jacoby (1999). At the present time we find no good reason to increase the PNLF distances, and the PNLF-SBF discrepancy remains unexplained.
10 SUMMARY OF CONCLUSIONS
We have been able to increase the number of PN detections and PN velocity measurements in the elliptical galaxy NGC 821. A comparison with the detections reported by the PN.S group indicates that we have confirmed most of their detections. The velocities measured by the two groups, using different telescopes, spectrographs and slitless techniques, are in good agreement. This confirms the reliability of detections and the good quality of the radial velocities reported by both groups. We have built a combined sample of 167 PNs, and have confirmed the keplerian decline of the LOSVD reported previously. The PN kinematics agree with absorption-line data within PN uncertainties. A dark matter halo may exist around this galaxy, but it is not needed to keep the PN velocities below the local escape velocity as calculated from the visible mass.
We have also confirmed the misalignment in rotation between outer PNs and inner stars reported by Coccato et al. (2009).
We have measured the (5007) magnitudes of 145 PNs and produced a statistically complete sample of 40 PNs. The resulting PNLF was used to estimate the distance to NGC 821, which becomes the most distant galaxy with a PNLF distance determination. We have also estimated the PN formation rate. The PNLF distance modulus is smaller than the SBF distance modulus by 0.4 mag. Our kinematic information permits to rule out the idea that a shorter PNLF distance could be produced by the contamination of the PNLF by background galaxies with emission lines redshifted into the on-band filter transmission curve. The PNLF-SBF distance discrepancy remains unexplained.
This work was supported by the National Science Foundation (USA) under grants 0307489 and 0807522. In our research we made use of the NASA/IPAC Extragalactic Database (NED), which is operated by the Jet Propulsion Laboratory, California Institute of Technology, under contract with the National Aeronautics and Space Administration. It is a pleasure to acknowledge the help provided by the Subaru staff, in particular the support astronomers Youichi Ohyama, Takashi Hattori and Kentaro Aoki. Our thanks to Lodovico Coccato, John Blakeslee, and the anonymous referee, for useful comments.
References
- (1) Alard, C., & Lupton, R.H. 1998, ApJ, 503, 325
- (2) Blakeslee, J.P., et al. 2001, MNRAS, 327, 1004
- (3) Blakeslee, J.P., et al. 2009, ApJ, 694, 556
- (4) Buzzoni, A., Arnaboldi, M., & Corradi, R.L.M. 2006, MNRAS, 368, 877
- (5) Ciardullo, R., Feldmeier, J.J., Jacoby, G.H., et al. 2002, ApJ, 577, 31
- (6) Ciardullo, R., & Jacoby, G.H. 1999, ApJ, 515, 191
- (7) Coccato, L., Gerhard, O., Arnaboldi, M., et al. 2009, MNRAS, 394, 1249
- (8) Colina, L., & Bohlin, R.C. 1994, AJ, 108, 1931
- (9) De Lorenzi, F., et al. 2008, MNRAS, 385, 1729
- (10) De Lorenzi, F., et al. 2009, MNRAS, 395, 76
- (11) de Vaucouleurs, G., de Vaucouleurs, A., Corwin, H.G., Jr., Buta, R.J., Paturel, G., & Fouque, P. 1991, Third Reference Catalogue of Bright Galaxies (Berlin: Springer)
- (12) Dekel, A., et al. 2005, Nature, 437, 707
- (13) Emsellem, E., Capellari, M., Peletier, R.F., et al. 2004, MNRAS, 352, 721
- (14) Feldmeier, J.J., Jacoby, G.H., & Phillips, M.M. 2007, ApJ, 657, 76
- (15) Forestell, A.D., & Gebhardt, K. 2008, astro-ph arXiv:0803.3626
- (16) Gebhardt, K., et al. 2003, ApJ, 583, 92
- (17) Gössl, C.A., & Riffeser, A.. 2002, A&A, 381, 1095
- (18) Hernquist, L. 1990, ApJ, 356, 359
- (19) Hui, X., Ford, H.C., Freeman, K.C., & Dopita, M.A. 1995, ApJ, 449, 592
- (20) Jacoby, G.H. 1989, ApJ, 339, 39
- (21) Jacoby, G.H., Ciardullo, R., & Ford, H.C. 1990, ApJ, 356, 332
- (22) Jacoby, G.H., Quigley, R.J., & Africano, J.L. 1987, PASP, 99, 672
- (23) Kashikawa, N., Aoki, K., Asai, R., et al. 2002, PASJ, 54, 819
- (24) Kormendy, J., Fisher, D.B., Cornell, M.E., & Bender, R. 2009, ApJS, 182, 216
- (25) Kudritzki, R.P., Méndez, R.H, Feldmeier, J.J., et al. 2000, ApJ, 536, 19
- (26) Meaburn, J., Boumis, P., López, J.A., et al. 2005, MNRAS, 360, 963
- (27) Méndez, R.H., Riffeser, A., Kudritzki, R.-P., et al. 2001, ApJ, 563, 135
- (28) Méndez, R.H & Soffner, T. 1997, A&A, 321, 898
- (29) Méndez, R.H, Teodorescu, A.M., Kudritzki, R.P., & Burkert, A. 2009, ApJ, 691, 228
- (30) Méndez, R.H., Thomas, D., Saglia, R.P., et al. 2005, ApJ, 627, 767
- (31) Monet, D.J., et al. 2003, ApJ, 125, 984
- (32) Napolitano, N.R., et al. 2005, MNRAS, 357, 691
- (33) Napolitano, N.R., et al. 2009, MNRAS, 393, 329
- (34) Oke, J.B. 1990, AJ, 99, 1621
- (35) Peng, E.W., Ford, H.C., & Freeman, K.C. 2004, ApJ, 602, 685
- (36) Proctor, R.N., et al. 2009, MNRAS, 398, 91
- (37) Romanowsky, A.J., Douglas, N.G., Arnaboldi, M., et al. 2003, Science, 301, 1696
- (38) Schlegel, D.J., Finkbeiner, D.P., & Davis, M. 1998, ApJ, 500, 525
- (39) Stetson, P.B. 1987, PASP, 99, 191
- (40) Teodorescu, A.M., Méndez, R.H., Saglia, R.P., et al. 2005, ApJ, 635, 290
- (41) Tonry, J.L., Dressler, A., Blakeslee, J.P., et al. 2001, ApJ, 546, 681
- (42) Weijmans, A.M., et al. 2009, MNRAS, 398, 561
NGC 821 difference image (on-off); part of Chip 2. The black dots are the PN candidates in the field. The sky area covered is 141 134 arcsec. The FOCAS images are specularly inverted relative to the sky.
NGC 821 difference image (unmedianed - medianed). This is the same part of Chip 2 shown in Figure 1. The spectra of continuum sources appear as vertical segments, while the spectra of PNs remain as point sources.
Comparison of slitless vs slit (classical) radial velocities across NGC 7293 for both Chip 1 and Chip 2. This PN’s heliocentric systemic radial velocity is 27 km s-1, according to Meaburn et al. (2005).
Distribution of all PN candidates reported in NGC 821. The plus signs correspond to sources detected only with PN.S. The squares show sources detected only with Subaru + FOCAS. The circled plus signs show sources in common to both PN.S and FOCAS samples. We have indicated the FOCAS field of view, divided into Chip 1 and Chip 2.
Comparison of equatorial coordinates for 93 PN candidates detected with both PN.S and FOCAS. We plot the difference in Declination as a function of the difference in Right Ascension. We show 8 sources with too discrepant measurements. They are identified with their FOCAS numbers from Table 2. We do not consider these 8 PN.S sources to be confirmed in our images.
Comparison of heliocentric velocities for 81 sources. We plot FOCAS velocities as a function of PN.S velocities. The FOCAS object 242 is plotted as a filled circle. Eliminating object 242 from the comparison, we obtain a standard deviation of 31 km s-1.
Positions in arc seconds relative to the center of light of NGC 821, for the 168 PN candidates with measured velocities. The -axis runs in the direction of increasing Right Ascension, along the major axis of NGC 821. Plus signs represent PN.S detection only, open squares represent FOCAS detection only, and filled circles are the PNs in common to both samples.
Velocities of the 168 PN candidates as a function of their -coordinates in arc seconds relative to the center of light of NGC 821. The symbols are the same as in figure 7. The isolated object with the lowest velocity is FOCAS object 104 in Table 2.
Velocities of the 168 PN candidates as a function of their -coordinates in arc seconds relative to the center of light of NGC 821. The symbols are the same as in figure 7. The isolated object with the lowest velocity is FOCAS object 104 in Table 2.
Line-of-sight velocity dispersion as a function of projected angular distance to the center of NGC 821 for the FOCAS + PN.S sample of 167 PNs (filled circles). The PNs were divided into 5 elliptical annuli as explained in the text. Overplotted are Sauron data (triangles; Weijmans et al. 2009) and Forestell & Gebhardt data (open circles). The solid line represents the analytical model of Hernquist (1990), with a constant ratio, a total mass of 2 1011 , and = 39′′.
Individual PN radial velocities plotted as a function of angular distance from the center of NGC 821. The solid lines are escape velocities for Hernquist models with total masses 2.0 x 10¹¹ (outer line) and 1.7 x 10¹¹ (inner line). Note the outside position of the unrelated FOCAS object 104, which we have rejected as a PN. No other object has a velocity in excess of the local escape velocity, even if we assume the lower mass.
Rotation of the PN.S + FOCAS sample of 167 PNs along the photometric major axis. Left: distribution of PNs in the sky, showing the same orientation as in Figure 3 of Coccato et al. (2009). The dotted line represents the major axis. We select all PNs within of the dotted line, and divide them in 4 bins. Squares: . Circles: . Triangles: . Crosses: . Right: Average velocity for each of the four bins defined in the left figure. There is no significant rotation in this direction.
Rotation of the PN.S + FOCAS sample of 167 PNs along an axis inclined 56 degrees with respect to the photometric major axis. Left: distribution of PNs in the sky, showing the same orientation as in Figure 3 of Coccato et al. (2009). The dotted line represents the inclined axis. We select all PNs within of the dotted line, calculate their coordinates with respect to the new axis, and divide them in 4 bins. Squares: . Circles: . Triangles: . Crosses: . Right: Average velocity for each of the four bins defined in the left figure. The sense of rotation agrees with that reported by Coccato et al. (2009).
Observed [O III] 5007 PNLF of NGC 821 (squares), with the statistically complete sample of 40 PNs binned into 0.2 mag intervals. The apparent magnitudes m(5007) have been transformed into absolute magnitudes M(5007) by adopting an extinction correction of 0.385 mag and a distance modulus m - M = 31.4. The 4 lines are PNLF simulations (Méndez and Soffner 1997) for 4 different total PN population sizes: 1200, 1700, 2400, and 3400 PNs. We estimate the best-fit sample size to be 2200. From this sample size it is possible to estimate the PN formation rate (see text).
Observed PNLF now compared with the analytical representation of the PNLF, using a universal cutoff at 4.5. The best-fit distance modulus is again 31.4.
Difference between PNLF and SBF distance modulus plotted as a function of SBF distance modulus, for 23 galaxies. Non-elliptical galaxies are plotted as diamonds, while for ellipticals we show just the error bars. The two galaxies near =28 are NGC 5128 and M 81. The only two galaxies with a positive mod are NGC 4258 and NGC 3115. The agglomeration of galaxies between 31 and 32 is dominated by the Virgo and Fornax clusters. Our recent PNLF additions, ellipticals NGC 1344 in Fornax and NGC 821, are indicated as squares.


| FOCAS Field | Configuration | FOCAS number | exp (s) | Air massaathe air masses correspond to the middle of each exposure |
|---|---|---|---|---|
| NGC 821 | Off-band | 55693 | 140 | 1.07 |
| NGC 821 | On-band | 55695 | 1400 | 1.06 |
| NGC 821 | On+grism | 55697 | 2100 | 1.03 |
| NGC 821 | Off-band | 55705 | 140 | 1.01 |
| NGC 821 | On-band | 55707 | 1400 | 1.01 |
| NGC 821 | On+grism | 55709 | 2100 | 1.02 |
| NGC 821 | Off-band | 55719 | 140 | 1.08 |
| NGC 821 | On-band | 55721 | 1400 | 1.08 |
| NGC 821 | On+grism | 55723 | 2100 | 1.13 |
| NGC 821 | Off-band | 55729 | 140 | 1.28 |
| NGC 821 | On-band | 55731 | 1400 | 1.30 |
| NGC 821 | On+grism | 55733 | 2100 | 1.43 |
| NGC 7293 + mask | On-band | 55855 | 200 | 1.36 |
| NGC 7293 + mask | On+grism | 55857 | 300 | 1.35 |
| NGC 7293 + mask | On-band | 55869 | 200 | 1.32 |
| NGC 7293 + mask | On+grism | 55871 | 300 | 1.32 |
| LTT 9491 | On-band | 55877 | 10 | 1.28 |
| LTT 9491 | On-band | 55879 | 20 | 1.28 |
| LTT 9491 | On-band | 55881 | 10 | 1.28 |
| LTT 9491 | On-band | 55883 | 20 | 1.28 |
| NGC 821 | Off-band | 55885 | 140 | 1.54 |
| NGC 821 | On-band | 55887 | 1400 | 1.50 |
| NGC 821 | On+grism | 55889 | 2100 | 1.35 |
| NGC 821 | Off-band | 55897 | 140 | 1.17 |
| NGC 821 | On-band | 55899 | 1400 | 1.16 |
| NGC 821 | On+grism | 55901 | 2100 | 1.10 |
| NGC 821 | Off-band | 55909 | 140 | 1.03 |
| NGC 821 | On-band | 55911 | 1400 | 1.03 |
| NGC 821 | On+grism | 55913 | 2100 | 1.02 |
| NGC 821 | Off-band | 55919 | 140 | 1.02 |
| NGC 821 | On-band | 55921 | 1400 | 1.02 |
| NGC 821 | On+grism | 55923 | 2100 | 1.04 |
| NGC 821 | Off-band | 55931 | 140 | 1.11 |
| NGC 821 | On-band | 55933 | 1400 | 1.12 |
| NGC 821 | On+grism | 55935 | 2100 | 1.19 |
| NGC 821 | On-band | 55943 | 1400 | 1.38 |
| NGC 821 | On+grism | 55945 | 2100 | 1.52 |
| NGC 7293 + mask | On-band | 56035 | 200 | 1.35 |
| NGC 7293 + mask | On+grism | 56037 | 300 | 1.34 |
| NGC 7293 + mask | On-band | 56043 | 200 | 1.33 |
| NGC 7293 + mask | On+grism | 56045 | 300 | 1.33 |
| LTT 9491 | On-band | 56053 | 10 | 1.29 |
| LTT 9491 | On-band | 56055 | 20 | 1.29 |
| LTT 9491 | On-band | 56057 | 10 | 1.28 |
| LTT 9491 | On-band | 56059 | 20 | 1.28 |
| NGC 821 | Off-band | 56061 | 140 | 1.55 |
| NGC 821 | On-band | 56063 | 1400 | 1.50 |
| NGC 821 | On+grism | 56065 | 2100 | 1.35 |
| NGC 821 | Off-band | 56073 | 140 | 1.18 |
| NGC 821 | On-band | 56075 | 1400 | 1.17 |
| NGC 821 | On+grism | 56077 | 2100 | 1.10 |
| NGC 821 | Off-band | 56085 | 140 | 1.04 |
| NGC 821 | On-band | 56087 | 1400 | 1.04 |
| NGC 821 | On+grism | 56089 | 2100 | 1.02 |
| NGC 821 | Off-band | 56097 | 140 | 1.02 |
| NGC 821 | On-band | 56099 | 1400 | 1.02 |
| NGC 821 | On+grism | 56101 | 2100 | 1.04 |
| NGC 821 | Off-band | 56111 | 140 | 1.10 |
| NGC 821 | On-band | 56113 | 1400 | 1.11 |
| NGC 821 | On+grism | 56115 | 2100 | 1.17 |
| NGC 821 | Off-band | 56123 | 140 | 1.35 |
| NGC 821 | On-band | 56125 | 1400 | 1.37 |
| NGC 821 | On+grism | 56127 | 2100 | 1.52 |
| ID | ID | Helioc. RV | Notes | |||||||
|---|---|---|---|---|---|---|---|---|---|---|
| (FOCAS) | (PN.S) | (J2000) | (J2000) | (5007) | (km s-1) | |||||
| 101 | … | 2 | 8 | 7.78 | 10 | 59 | 41.53 | 28.46 | … | |
| 102 | 04 | 2 | 8 | 10.56 | 11 | 0 | 0.47 | 27.82 | 1701 | |
| 103 | 05 | 2 | 8 | 13.05 | 10 | 58 | 22.91 | 28.79 | 1888 | |
| 104 | … | 2 | 8 | 13.12 | 10 | 59 | 32.86 | 28.67 | 1171 | a |
| 201 | … | 2 | 8 | 13.92 | 11 | 2 | 19.61 | 28.43 | … | |
| 105 | 06 | 2 | 8 | 14.08 | 10 | 57 | 13.57 | 27.78 | 1817 | |
| 106 | … | 2 | 8 | 14.52 | 10 | 58 | 37.27 | 28.54 | 1432 | |
| 107 | … | 2 | 8 | 14.65 | 11 | 0 | 19.84 | 27.44 | 1726 | |
| 108 | 07 | 2 | 8 | 15.99 | 10 | 59 | 22.59 | 27.74 | 1702 | |
| 109 | … | 2 | 8 | 16.14 | 10 | 57 | 23.15 | 29.03 | … | |
| 110 | 08 | 2 | 8 | 16.24 | 10 | 59 | 20.18 | 27.49 | 1823 | |
| 111 | … | 2 | 8 | 16.34 | 10 | 58 | 13.94 | 29.03 | 1672 | |
| 112 | 11 | 2 | 8 | 16.59 | 10 | 57 | 39.20 | 28.85 | 1705 | |
| 113 | 10 | 2 | 8 | 16.64 | 11 | 0 | 17.28 | 28.07 | 1663 | |
| 114 | 12 | 2 | 8 | 16.65 | 10 | 59 | 13.96 | … | 1540 | |
| 115 | 13 | 2 | 8 | 16.88 | 10 | 57 | 37.33 | 28.42 | 1805 | |
| 202 | … | 2 | 8 | 16.95 | 11 | 1 | 22.73 | 28.92 | 1663 | |
| 116 | 15 | 2 | 8 | 17.47 | 10 | 58 | 59.02 | 27.79 | 1860 | |
| 117 | 16 | 2 | 8 | 17.56 | 10 | 59 | 59.13 | 27.57 | 1620 | |
| 118 | 19 | 2 | 8 | 17.74 | 10 | 59 | 38.54 | 28.20 | 1573 | |
| 119 | 17 | 2 | 8 | 17.75 | 10 | 59 | 2.54 | 27.85 | 1608 | |
| 120 | 18 | 2 | 8 | 17.79 | 10 | 58 | 41.56 | 28.52 | 1524 | |
| 121 | … | 2 | 8 | 17.79 | 10 | 59 | 35.02 | 28.07 | 1662 | |
| 122 | … | 2 | 8 | 17.87 | 10 | 58 | 4.84 | 29.23 | … | |
| 203 | … | 2 | 8 | 17.88 | 11 | 1 | 23.91 | 29.00 | 1817 | |
| 123 | 20 | 2 | 8 | 18.01 | 10 | 59 | 45.49 | … | 1344 | |
| 124 | … | 2 | 8 | 18.05 | 10 | 59 | 23.10 | 28.91 | 1586 | |
| 125 | 23 | 2 | 8 | 18.10 | 10 | 57 | 30.96 | 28.01 | 1800 | |
| 126 | … | 2 | 8 | 18.12 | 10 | 59 | 35.16 | 27.92 | 1676 | |
| 127 | … | 2 | 8 | 18.16 | 10 | 59 | 28.75 | 28.36 | 1569 | |
| 128 | 24 | 2 | 8 | 18.27 | 10 | 59 | 19.68 | 27.70 | 1785 | |
| 129 | 27 | 2 | 8 | 18.51 | 10 | 59 | 42.29 | 27.70 | 1585 | |
| 130 | 28 | 2 | 8 | 18.53 | 10 | 57 | 48.99 | 27.57 | 1692 | |
| 131 | … | 2 | 8 | 18.65 | 10 | 58 | 37.13 | 29.06 | … | |
| 132 | 30 | 2 | 8 | 18.80 | 10 | 59 | 49.95 | 27.37 | 1861 | |
| 133 | … | 2 | 8 | 18.90 | 10 | 59 | 0.64 | … | 1600 | |
| 204 | 33 | 2 | 8 | 18.94 | 11 | 2 | 53.52 | 27.74 | 1826 | b |
| 134 | … | 2 | 8 | 19.04 | 10 | 59 | 17.99 | … | 1444 | |
| 135 | … | 2 | 8 | 19.13 | 10 | 59 | 11.90 | 27.86 | 1642 | |
| 136 | 34 | 2 | 8 | 19.14 | 10 | 59 | 27.02 | 27.05 | 1716 | |
| 137 | 35 | 2 | 8 | 19.20 | 10 | 58 | 1.96 | 28.37 | 1675 | |
| 205 | 36 | 2 | 8 | 19.21 | 11 | 1 | 22.08 | 28.22 | 1597 | |
| 138 | … | 2 | 8 | 19.29 | 10 | 59 | 41.21 | 28.51 | 1497 | |
| 139 | 37 | 2 | 8 | 19.34 | 10 | 58 | 16.39 | 27.76 | 1883 | |
| 140 | … | 2 | 8 | 19.37 | 10 | 58 | 44.33 | 28.75 | 1545 | |
| 141 | … | 2 | 8 | 19.45 | 10 | 59 | 57.70 | 28.28 | … | |
| 142 | 39 | 2 | 8 | 19.52 | 10 | 59 | 48.95 | 28.22 | 1507 | |
| 143 | 38 | 2 | 8 | 19.52 | 10 | 59 | 45.35 | 27.98 | 1765 | |
| 144 | … | 2 | 8 | 19.69 | 10 | 59 | 26.70 | … | 1924 | |
| 145 | … | 2 | 8 | 19.75 | 10 | 59 | 29.87 | 27.56 | 1659 | |
| 146 | 42 | 2 | 8 | 19.78 | 10 | 59 | 53.23 | 27.91 | 1877 | b |
| 147 | … | 2 | 8 | 19.84 | 10 | 58 | 48.97 | 28.66 | 1736 | |
| 148 | 44 | 2 | 8 | 19.94 | 10 | 58 | 32.74 | 27.79 | 1368 | |
| 149 | 43 | 2 | 8 | 19.95 | 10 | 59 | 0.10 | 27.54 | 1542 | |
| 150 | … | 2 | 8 | 19.96 | 10 | 59 | 2.72 | 27.98 | 1783 | |
| 151 | … | 2 | 8 | 20.03 | 10 | 59 | 1.43 | … | 1597 | |
| 206 | … | 2 | 8 | 20.20 | 11 | 0 | 26.10 | 28.02 | 1875 | |
| 152 | 47 | 2 | 8 | 20.30 | 10 | 57 | 8.53 | 28.45 | 1518 | |
| 207 | 46 | 2 | 8 | 20.38 | 11 | 0 | 32.76 | 27.35 | 1345 | |
| 153 | … | 2 | 8 | 20.39 | 10 | 56 | 56.33 | 28.53 | 1529 | |
| 154 | 51 | 2 | 8 | 20.42 | 10 | 58 | 20.82 | 27.77 | 1872 | |
| 155 | 49 | 2 | 8 | 20.46 | 10 | 57 | 29.23 | 27.98 | 1651 | |
| 156 | 48 | 2 | 8 | 20.47 | 10 | 59 | 18.13 | … | 1914 | |
| 208 | … | 2 | 8 | 20.48 | 11 | 0 | 5.69 | 27.80 | … | |
| 209 | … | 2 | 8 | 20.51 | 11 | 1 | 28.34 | 27.48 | 1755 | |
| 157 | … | 2 | 8 | 20.56 | 10 | 58 | 17.47 | 28.58 | 1874 | |
| 158 | 52 | 2 | 8 | 20.61 | 10 | 58 | 40.01 | 27.36 | 1590 | |
| 159 | … | 2 | 8 | 20.89 | 10 | 59 | 13.34 | 27.84 | 1732 | |
| 160 | 57 | 2 | 8 | 20.96 | 10 | 58 | 43.28 | 27.76 | 1584 | |
| 210 | 55 | 2 | 8 | 20.98 | 11 | 0 | 37.84 | 28.77 | 1740 | |
| 161 | … | 2 | 8 | 21.19 | 10 | 58 | 55.63 | … | 1866 | |
| 162 | 58 | 2 | 8 | 21.26 | 10 | 59 | 15.36 | 27.78 | 1804 | |
| 163 | … | 2 | 8 | 21.33 | 10 | 58 | 15.64 | 28.43 | 1625 | |
| 164 | … | 2 | 8 | 21.44 | 10 | 56 | 40.74 | 28.86 | … | |
| 211 | … | 2 | 8 | 21.49 | 11 | 0 | 37.22 | 29.42 | 1968 | |
| 165 | 61 | 2 | 8 | 21.55 | 10 | 57 | 44.24 | 27.63 | 1630 | |
| 212 | 62 | 2 | 8 | 21.58 | 11 | 0 | 39.78 | 28.10 | 1657 | |
| 166 | 64 | 2 | 8 | 21.63 | 10 | 58 | 53.33 | 27.83 | 1700 | |
| 213 | … | 2 | 8 | 21.70 | 11 | 1 | 7.64 | 28.33 | 1749 | |
| 214 | … | 2 | 8 | 21.88 | 11 | 0 | 17.10 | 28.04 | 1850 | |
| 167 | 66 | 2 | 8 | 21.96 | 10 | 58 | 57.47 | 27.48 | 1795 | |
| 215 | … | 2 | 8 | 21.99 | 10 | 59 | 59.42 | 27.88 | 1699 | |
| 168 | 65 | 2 | 8 | 22.00 | 10 | 59 | 14.53 | 28.54 | 1828 | b |
| 169 | … | 2 | 8 | 22.03 | 10 | 59 | 5.17 | 28.81 | 1687 | |
| 216 | 70 | 2 | 8 | 22.03 | 11 | 0 | 56.77 | 27.65 | 1839 | |
| 217 | 69 | 2 | 8 | 22.06 | 11 | 2 | 34.47 | 27.95 | 1728 | |
| 218 | … | 2 | 8 | 22.11 | 10 | 59 | 46.72 | 27.73 | 1333 | |
| 219 | … | 2 | 8 | 22.16 | 10 | 59 | 40.56 | 28.01 | 1516 | |
| 170 | … | 2 | 8 | 22.17 | 10 | 59 | 1.54 | 28.40 | 1492 | |
| 220 | … | 2 | 8 | 22.27 | 11 | 1 | 0.98 | 28.86 | 2000 | |
| 221 | 73 | 2 | 8 | 22.29 | 11 | 1 | 10.78 | 28.34 | 1794 | |
| 222 | 74 | 2 | 8 | 22.34 | 10 | 59 | 27.02 | 27.76 | 1745 | b |
| 171 | 76 | 2 | 8 | 22.38 | 10 | 58 | 36.34 | 28.07 | 1713 | |
| 223 | … | 2 | 8 | 22.38 | 10 | 59 | 39.30 | 28.59 | 1740 | |
| 224 | 78 | 2 | 8 | 22.42 | 10 | 59 | 49.24 | 27.66 | 1593 | |
| 225 | … | 2 | 8 | 22.44 | 10 | 59 | 46.32 | 28.68 | 2002 | |
| 226 | 77 | 2 | 8 | 22.45 | 11 | 0 | 54.07 | 28.17 | 1501 | |
| 227 | … | 2 | 8 | 22.52 | 10 | 59 | 29.94 | 28.45 | … | |
| 228 | … | 2 | 8 | 22.59 | 10 | 59 | 33.11 | 28.84 | 1929 | |
| 229 | 79 | 2 | 8 | 22.61 | 11 | 0 | 45.90 | 28.52 | 1593 | |
| 230 | 81 | 2 | 8 | 22.68 | 10 | 59 | 51.18 | 28.63 | 1618 | |
| 231 | 80 | 2 | 8 | 22.68 | 11 | 2 | 50.39 | 27.72 | 1703 | b |
| 172 | … | 2 | 8 | 22.70 | 10 | 58 | 51.85 | 28.81 | 1938 | |
| 173 | … | 2 | 8 | 22.71 | 10 | 58 | 17.55 | 28.29 | 1754 | |
| 232 | … | 2 | 8 | 22.77 | 10 | 59 | 37.57 | 28.23 | 1895 | |
| 233 | 82 | 2 | 8 | 22.91 | 10 | 59 | 27.49 | 28.67 | 1435 | |
| 234 | 84 | 2 | 8 | 23.05 | 11 | 1 | 11.32 | 28.20 | 1729 | |
| 235 | … | 2 | 8 | 23.06 | 11 | 0 | 25.24 | 28.54 | 1556 | |
| 236 | 85 | 2 | 8 | 23.33 | 10 | 59 | 40.92 | … | 1840 | |
| 237 | … | 2 | 8 | 23.34 | 11 | 0 | 18.83 | 28.22 | 1896 | |
| 238 | 86 | 2 | 8 | 23.39 | 10 | 59 | 51.25 | 27.80 | 1755 | |
| 239 | … | 2 | 8 | 23.59 | 10 | 59 | 16.26 | 28.51 | 1787 | |
| 240 | 88 | 2 | 8 | 23.71 | 10 | 59 | 43.80 | 28.19 | 1707 | |
| 241 | 89 | 2 | 8 | 23.85 | 11 | 1 | 33.56 | 28.17 | 1727 | |
| 242 | … | 2 | 8 | 23.88 | 10 | 59 | 52.44 | 28.91 | 1478 | |
| 243 | 90 | 2 | 8 | 23.89 | 11 | 0 | 16.52 | 28.67 | 1615 | |
| 244 | 91 | 2 | 8 | 23.94 | 10 | 59 | 50.57 | 28.19 | 1778 | |
| 245 | … | 2 | 8 | 24.22 | 10 | 59 | 55.07 | … | 1784 | |
| 174 | 93 | 2 | 8 | 24.38 | 10 | 57 | 38.09 | 27.97 | 1806 | |
| 246 | … | 2 | 8 | 24.45 | 10 | 59 | 45.92 | 29.17 | 1757 | |
| 247 | 95 | 2 | 8 | 24.52 | 10 | 59 | 39.08 | 28.36 | 1839 | |
| 248 | … | 2 | 8 | 24.75 | 11 | 0 | 7.70 | 28.70 | 1841 | |
| 249 | 98 | 2 | 8 | 25.20 | 11 | 1 | 32.99 | 28.39 | 1698 | |
| 250 | 99 | 2 | 8 | 25.32 | 11 | 0 | 1.91 | 27.84 | 1511 | |
| 251 | 101 | 2 | 8 | 25.54 | 11 | 0 | 11.31 | 27.92 | 1611 | |
| 252 | 102 | 2 | 8 | 25.63 | 11 | 0 | 27.11 | 28.46 | 1903 | |
| 253 | 104 | 2 | 8 | 25.70 | 10 | 59 | 58.63 | 28.14 | 1830 | |
| 254 | … | 2 | 8 | 25.89 | 11 | 0 | 0.68 | 28.37 | 1739 | |
| 255 | 106 | 2 | 8 | 26.17 | 11 | 0 | 26.68 | 28.30 | 1695 | |
| 256 | 105 | 2 | 8 | 26.17 | 11 | 1 | 47.96 | 28.76 | 1611 | |
| 257 | 107 | 2 | 8 | 26.21 | 10 | 59 | 38.36 | 27.74 | 1767 | |
| 258 | 108 | 2 | 8 | 26.24 | 10 | 59 | 36.49 | 27.81 | 1635 | |
| 259 | 110 | 2 | 8 | 26.24 | 11 | 0 | 54.83 | 28.75 | 1862 | |
| 260 | 109 | 2 | 8 | 26.32 | 10 | 59 | 50.46 | 28.10 | 1691 | |
| 261 | 112 | 2 | 8 | 26.39 | 11 | 0 | 31.75 | 28.40 | 1638 | |
| 175 | … | 2 | 8 | 26.62 | 10 | 57 | 53.60 | 28.75 | … | |
| 262 | 113 | 2 | 8 | 26.92 | 11 | 1 | 55.85 | 28.59 | 1650 | |
| 263 | 114 | 2 | 8 | 27.20 | 11 | 0 | 43.92 | 28.61 | 1610 | |
| 264 | … | 2 | 8 | 27.30 | 11 | 1 | 13.91 | 27.90 | 1510 | |
| 265 | … | 2 | 8 | 27.68 | 11 | 1 | 4.08 | 28.88 | 1795 | |
| 266 | 115 | 2 | 8 | 27.83 | 10 | 58 | 40.73 | 27.86 | 1805 | |
| 267 | … | 2 | 8 | 28.21 | 11 | 0 | 36.22 | 28.64 | 1706 | |
| 268 | 116 | 2 | 8 | 28.31 | 10 | 59 | 25.15 | 27.86 | 1569 | |
| 269 | 117 | 2 | 8 | 28.44 | 11 | 0 | 57.42 | 27.64 | 1644 | |
| 270 | … | 2 | 8 | 28.56 | 11 | 0 | 33.48 | 28.18 | 1508 | |
| 271 | 118 | 2 | 8 | 28.76 | 10 | 59 | 57.95 | 28.62 | 1660 | |
| 272 | 119 | 2 | 8 | 28.86 | 11 | 1 | 36.41 | 27.90 | 1864 | |
| 273 | … | 2 | 8 | 28.90 | 10 | 59 | 5.50 | 27.34 | 1714 | |
| 274 | … | 2 | 8 | 29.42 | 10 | 59 | 42.25 | 28.32 | 1805 | |
| 275 | … | 2 | 8 | 29.44 | 11 | 0 | 27.86 | 28.77 | 1679 | |
| 276 | … | 2 | 8 | 29.97 | 10 | 59 | 3.84 | 28.85 | 1605 | |
| 277 | 122 | 2 | 8 | 30.15 | 10 | 58 | 30.72 | 27.73 | 1690 | |
| 278 | 124 | 2 | 8 | 31.04 | 11 | 1 | 10.63 | 28.02 | 1728 | |
| 279 | … | 2 | 8 | 31.22 | 11 | 0 | 11.48 | 28.95 | 1720 | |
| 280 | … | 2 | 8 | 32.41 | 11 | 0 | 30.24 | 28.50 | 1566 | |
Notes. (a) Rejected as PN: wrong velocity for NGC 821 if interpreted as 5007 Å emitter. (b) Velocity taken from the PN.S study.