Molecular Disk Properties in Early-Type Galaxies
Abstract
We study the simulated CO emission from elliptical galaxies formed in the mergers of gas-rich disk galaxies. The cold gas not consumed in the merger-driven starburst quickly resettles into a disk-like configuration. By analyzing a variety of arbitrary merger orbits that produce a range of fast to slow-rotating remnants, we find that molecular disk formation is a fairly common consequence of gas-rich galaxy mergers. Hence, if a molecular disk is observed in an early-type merger remnant, it is likely the result of a “wet merger” rather than a “dry merger”. We compare the physical properties from our simulated disks (e.g. size and mass) and find reasonably good agreement with recent observations. Finally, we discuss the detectability of these disks as an aid to future observations.
Subject headings:
Galaxies: Elliptical and Lenticular, cD—Galaxies: evolution—Galaxies: Kinematics and Dynamics—ISM: molecules1. Introduction
The “red and dead” nature of early-type galaxies such as ellipticals and lenticulars has long been part of the standard lore. The general lack of cold molecular gas conducive to the formation of stars in these galaxies (Lees et al., 1991) is typically considered the reason for their redder colours (Baldry et al., 2004). Recently, however, a number of studies have shown that some molecular gas can exist in early-types, oftentimes in a disk-like configuration (Inoue et al., 1996; Rupen, 1997; Wiklind et al., 1997; Young, 2002; Okuda et al., 2005; Das et al., 2005; Young, 2005; Young et al., 2008).
A wide variety of mechanisms have been proposed for the origin of molecular disks in early-type galaixes. These include external origins such as gas accreted from the intergalactic medium (Khochfar & Burkert, 2005) or gas remnant after a merger (Lees et al., 1991; Knapp & Rupen, 1996). Some theories have additionally speculated an internal origin, i.e. from the mass loss of evolved stars (Faber & Gallagher, 1976; Ciotti et al., 1991). Since star formation occurs in the presence of molecular gas, the properties of these disks can be used to study the weak star formation that occurs in as many as 30% of local early-type galaxies (Yi et al., 2005; Kaviraj et al., 2007). Their kinematics and dynamics can also be used to model and infer the potentials of their host galaxies (de Zeeuw & Franx, 1989; Cretton et al., 2000).
Given that ellipticals are thought to form in the merger of two galaxies where gravitational disruption is prevalent (e.g. Cox et al., 2006, and references therein), the idea that either stellar or molecular disks may exist in elliptical galaxies seems counterintuitive. There is, however, some theoretical evidence to suggest that stellar disks are born after galaxy mergers (Barnes & Hernquist, 1996; Robertson et al., 2006; Roberston & Bullock, 2008; Hopkins et al., 2009). Since stars form from molecular gas, it is conceivable that molecular disks may also form after “wet” (gas-rich) galaxy mergers (as opposed to “dry” or gas-poor mergers).
In this paper we use smoothed particle hydrodynamic (SPH) simulations of gas-rich major mergers combined with molecular CO line radiative transfer calculations in order to investigate the potential formation of molecular disks in early-type galaxies. This approach allows us to compare synthetic CO observations of our model galaxies, which span the full range between fast and slow-rotators, with data from the literature. Although major mergers are rare events in the context of LCDM (Fakhouri & Ma, 2008; Guo & White, 2008; Stewart et al., 2008), the simulations presented here can still be viewed as useful limiting cases. Our paper is organized as follows: In §2, we describe our numerical methods; In §3 and §4 we discuss the formation of molecular disks in our simulations and compare these with recent observational results, and in §5 we conclude.
2. Simulations and Models
2.1. Simulations
We model major mergers between two disk galaxies using a modified version of the publicly available N-body/SPH code gadget-2 (Springel, 2005). Detailed descriptions of the parent galaxies as well as the multiphase ISM, star formation and blackhole feedback can be found in Springel & Hernquist (2002, 2003) and Springel et al. (2005a). We refer the reader to these works for a more detailed description of the simulations. The most relevant aspects to this work will be summarized briefly below.
The parent disks in our simulations have dark matter halos initialized with Hernquist (1990) profiles. They have a concentration index of , a spin parameter of and a circular velocity of km/s. A total of 120,000 dark matter particles and 80,000 disk particles were used to model each progenitor galaxy. The disk consists of 40% gas by mass, with the remainder being collisionless star particles. The total (halo and baryonic) mass of a parent galaxy is . Softening lengths of 100 pc and 200 pc were used for baryons and dark matter respectively.
The key evolutionary steps during the major merger simulations are as follows. After the initial passage of the merging galaxies, tidal torquing drives gas into the central regions (Barnes & Hernquist, 1991, 1996), leading to a period of enhanced star formation rates. As the galaxies undergo final coalescence during the second passage, the merger-driven starburst drives the galaxy through a LIRG/ULIRG phase (Younger et al., 2009). A combination of gas consumption and AGN feedback quench the star formation, and the final merger product evolves passively into a red elliptical galaxy (Springel et al., 2005b). We analyze the results of the simulations for four identical mergers which vary only in orbit. The merger orbit angles are chosen arbitrarily, and are given in Table 1.
2.2. Radiative Transfer
In order to investigate the simulated CO properties of the remnants of our model mergers, we post-process the SPH output using the 3D non-LTE molecular line radiative transfer code, turtlebeach (Narayanan et al., 2006, 2008).
The molecular gas fraction in galaxies is determined by various different properties such as metallicity, dust content, interstellar radiation fields, density and temperature (Hollenbach et al., 1971; Pelupessy et al., 2006). However, since the spatial resolution is limited in our simulations, this cannot be calculated explicitly as the locations of individual stars and gas clouds are unknown. Hence, we assume that half of the cold neutral gas in each grid cell is atomic and the other half molecular. This is consistent with studies of nearby star-forming galaxies (e.g. Keres et al. (2003)). We also examined a sub-sample of our simulations by scaling the H2 gas fraction by the ambient interstellar pressure according to local scaling relations (Blitz & Rosolowsky, 2006). In the simulations examined here, the differences in the two methods for assigning the molecular gas mass are negligible.
The molecular abundance levels are set uniformly at Galactic values (Lee et al., 1996). The relatively high abundance of CO in the galaxy (, Lee et al. (1996)) in comparison to other tracers such as HCN, CS and , makes it the best observational tracer for molecular hydrogen. Hence, we focus on the radiative transfer of CO, particularly the readily observable CO (J=1-0) transition in this work.
turtlebeach calculates the molecular level populations, and hence the source functions by considering both radiative excitations/deexcitations as well as collisions with H2. In practice, a solution grid to the level populations is guessed and model photons are emitted isotropically via a Monte Carlo sampling. By assuming statistical equilibrium and balancing radiative and collisional excitation, de-excitation and stimulated emission, the level populations are updated until convergence is reached. The source function can be subsequently determined. The emergent intensity is then calculated by integrating the equation of radiative transfer through the model grid. For further details on the underlying algorithms, please see Narayanan et al. (2008).
3. Results
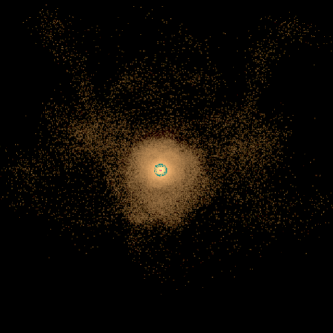
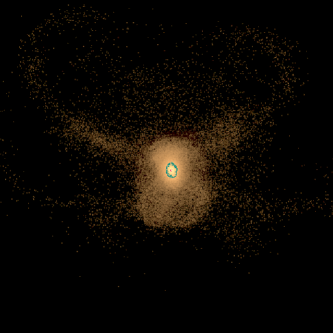
To determine when the product of the major merger has evolved into an elliptical, we examine the star formation rates (SFRs) and stellar morphologies of the simulated system. We pick snapshots well after the merger-induced starburst, when the stars have relaxed into a spheroid-type configuration to serve as our model early-type galaxies. The SFRs are typically of order 0.5 yr-1. To confirm the early-type morphology of our simulated galaxies, we have run dust radiative transfer calculations in post-processing to determine the synthetic SEDs111For this, we employ the publicly available code sunrise; a full description of the code can be found in Jonsson et al. (2010). For the variable input parameters, we chose a stellar birthcloud covering fraction of and a dust-to-metals ratio of 0.4.. We plot the simulated colours mapped onto for model d3e (hereafter our fiducial model222For reference with previous papers in the literature, this is additionally the fiducial model in Narayanan et al. (2008) and Younger et al. (2009).) at two arbitrary viewing angles in Figure 1. A study by Cox et al. (2006) using the same simulations as this work shows that the early-type galaxies formed span the full range between fast and slow-rotators. Their rotation parameters (, where is the major axis rotation speed and defines a fast-rotator) range between 0.06 to 1.03 when derived from a model including dissipation.
 |
 |
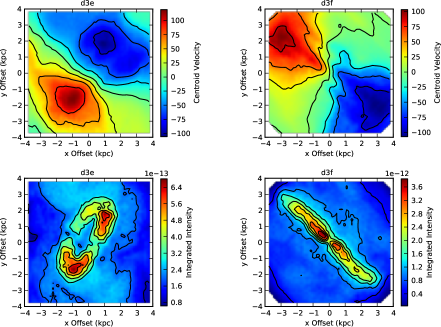
In Figure 2, we show centroid velocity maps in CO (J=1-0) for one sight-line (where the molecular disk is highly inclined) through our fiducial model and a similarly chosen sight-line through model d3f. The maps are 8 kpc on a side. The velocity-integrated intensity is shown for comparison.
We search for evidence of molecular disks in the final elliptical by examining the CO centroid velocity maps from 100 random viewing angles. Ordered rotation, as evidenced by clear blue and red centroid velocity peaks when a disk is highly inclined, is observed along several of the sight-lines for each merger orbit angle implying that the molecular gas is in fact located within a rotating disk. The fact that this is observed for all of our merger orbit angles indicates that molecular disk formation may be a relatively common occurence in merger-induced elliptical galaxy formation.
The possibility of molecular disks being a common occurrence in elliptical galaxies is interesting. First, early-type galaxies are canonicaly thought to be relatively devoid of molecular gas. Second, if early-types form in hierarchical merging of dynamically cold disks, one might naively expect the disks to be disrupted in the merging process.
The molecular disks in our simulations form from gas not consumed in the merger-driven starburst. During the merger, gravitational torques on the gas (by the stars) cause the gas to lose anuglar momentum and collapse toward the center (Barnes & Hernquist, 1996; Mihos & Hernquist, 1996). A large increase in central gas density ensues leading to a burst of star formation. The remnant gas, originally in the outer regions of the progenitors, re-virializes into a rotationally-supported disk around the compact central potential induced by the post-merger stars. A similar formation mechanism for post-merger stellar disk formation has been discussed in detail by Robertson et al. (2006), Roberston & Bullock (2008) and Hopkins et al. (2009).
4. Discussion
4.1. Comparison with Observations
Young et al. (2008)(hereafter Y08) observed the CO (J=1-0) emission in four early-type galaxies using the BIMA array, which has a primary beam size of 100”. Of the four, three showed evidence for molecular disks. The properties of these three galaxies are listed in Table 2. We compare our results to their observation by placing our model galaxies at 17 Mpc ( the mean distance of the Y08 galaxies) and convolving the CO (J=1-0) model spectra with a 100”circular Gaussian beam. We list the relevant properties derived from our models in the same table for comparison.
We define the effective radius, , to be the radius at which the stellar mass profile drops from its central value by a factor of 1/. This implicitly assumes a constant mass-to-light ratio at these smaller radii (Cappellari et al., 2006). From comparing values in Table 2, we find the effective radius of NGC 3032 is similar to that of the d3e merger-remnant. The effective radius of NGC 4459 is in between that of the d3e and d3k remnants. The effective radius of NGC 4526 is similar to that of the d3k remnant.
The size of the molecular disks in our simulations is determined in the following way. For a near edge-on sight-line for each merger orbit angle, a line is put down connecting the maximum and minimum velocities for the molecular disks in the final ellipticals. An interpolation is performed to find the centroid velocities along this line at various distances from the center of the disk (taken to be where the velocity equals zero along the line). The resulting rotation curve of the molecular disk is sinusoidal in shape as would be expected for a rotating disk. We take the radius corresponding to the extremum of the rotation curve as the radius of the disk . These values are listed in Table 1 and alongside the Y08 values in Table 2. Reasonable correspondence is seen between the observed values in Y08 and our models to within a factor of 2-3.
Finally, the simulated molecular gas masses within the disks are compared (see Table 1) to those observed. The study of Y08 uses a CO-to-H2 conversion factor of cm-2 (K km/s)-1 when deriving their molecular gas masses. In comparing these molecular gas masses (see Table 2), the agreement seems poorer at first glance. The typical discrepancies are within a factor of 4-10. However, this is about equal to the dispersion seen in the CO-to-H2 conversion factor in local galaxies (which ranges by a factor of 2-5 within the Galaxy and by up to an order of magnitude in other galaxies; Downes & Solomon, 1998; Gao & Solomon, 2004; Arimoto et al., 1996; Boselli et al., 2002).
The total (baryonic + dark matter) mass of the merger-remnant for each model is . The percentage of the total mass enclosed within the molecular disk radius is given under the column heading ‘’ in Table 1 and are typically of order 1-2%. This result may be applicable in determining the total mass of an observed galaxy.
4.2. Detectability
Finally we investigate the detectability of these molecular disks using two different approaches: from their synthetic CO spectra and from their centroid velocity maps.
From the 100 arbitrary model viewing angles, we estimate the detectability of the disk as the fraction of these sight-lines where an obvious broadened and double-side-peaked line (due to rotation) is visible. An automated peak finding routine is used to test whether each spectrum has this characteristic multi-peak profile. If it does, then we consider the disk to be detectable.
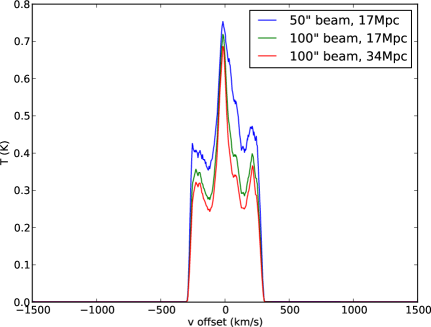
Examples of such spectra obtained by placing the galaxy at varying distances and convolving with different beam sizes are shown in Figure 3 with 20 km/s smoothing (a typical resolution used by Y08). The green line in the plot corresponds to the models we compared to the observations of Y08 in §4.1 (i.e. distance to galaxy = 17 Mpc, beam size = 100”). The blue and red lines represent galaxy distances and beam sizes of 17 Mpc, 50” and 34 Mpc, 100” respectively. Although this is an arbitrary sight-line through the molecular disk of model d3m, it is representative of all the models in this study.
The detectability of disks using spectral line profiles for the models comparable to Y08 are given in Table 1 under the heading ‘’. The sightline averaged detectability of disks (e.g. the fraction of viewing angles over which the characterstic 3-peaked line profile is visible) is 60-75%. This is comparable to the detection fraction of molecular disks in early-types by Y08 (75%). The smaller beam size and more distant galaxy cases are detectable to similar percentage levels (within ).
The spectroscopic CO line profile may change in shape due to beam size and distance to a galaxy. For example, if the galaxy is isolated and unresolved in a telescope beam, as the beam size gets larger the line temperature will decrease while the line shape stays the same. If the galaxy is resolved, then as the beam gets bigger or smaller, more or less velocity components within the galaxy are included or excluded so the line shape may change. Figure 3 and the similar detectabilities suggests that this technique for detecting underlying molecular disks is relatively robust against a variety of modeled galaxy distances and beam sizes.
Another method that can be used to detect molecular disks is by analyzing the centroid velocity data. In this case, we can estimate the detectability of the disk as the fraction of sight-lines in each merger model that show a single distinct blue velocity peak and a single distinct red velocity peak, like in Figure 2. If the centroid velocity map has these distinct peaks, we consider the disk detectable. Another automated peak finder is used to perform this search. We find similar detectabilities to the spectra method for the models comparable to Y08. These are given in Table 1 under the heading ‘’ and mostly lie in the 60-75% range as before.
5. Conclusions
We study the early-type galaxies formed in gadget-2 simulations of gas-rich major mergers at four arbitrary merger orbit angles. A 3D non-LTE radiative transfer code creates 100 CO (J=1-0) spectra for each merger remnant by “viewing” it at arbitrary viewing angles. Molecular gas disks are detected in all four merger remnants which range between fast to slow-rotators. This implies that molecular gas disks, thought to reform after a gas-rich merger through a re-virialization process induced by the compact central potential of post-merger/post-starburst stars, may not be a rare occurrence in early-type galaxies. Consequently, if an early-type merger remnant contains a molecular disk, it is likely that a wet merger was responsible for its formation rather than a dry merger.
The rare nature of major mergers in the standard LCDM context though, means that the simulations studied here are likely not perfect analogs to most early-type galaxies in the local universe. They are, however, interesting limiting cases in the formation of molecular disks in early-type galaxies. We would expect that a more typical merger ratio like 1:3 will leave an S0-like remnant with of the mass in the bulge (Hopkins et al., 2009). This implies a smaller disruption to the original gas disks and hence, a higher probability of having a molecular disk in the remnant.
We compare the molecular disk radii and the molecular gas masses enclosed within these radii to the observational results of Young et al. (2008). Reasonably good agreement between our models and their results are found to within a factor of 2-3 for disk radius. The molecular gas masses differ by a factor of 4-10. However, these differences are within the uncertainty of the CO-to-H2 conversion factor.
We find the total mass enclosed within the molecular disk radius to be 1-2% of the total mass (baryons + dark matter) of the galaxy. This result may be useful for estimating the total mass of an observed galaxy.
We investigate the detectability of underlying molecular disks using two methods: from CO spectra and centroid velocity maps. From model CO spectra, we derive typical disk detection rates of 60-75%. This compares well to the 75% detection rate of molecular disks in the galaxies observed by Young et al. (2008). Using the centroid velocity map approach, a similar disk detection rate is achieved.
References
- Adler et al. (1992) Adler, D. S., et al. 1992, ApJ, 392, 497
- Arimoto et al. (1996) Arimoto, N., Sofue, Y., & Tsujimoto, T. 1996, PASJ, 48, 275
- Baldry et al. (2004) Baldry, I. K., et al. 2004, ApJ, 600, 681
- Barnes & Hernquist (1991) Barnes, J. E., & Hernquist, L. E. 1991, ApJ, 370, L65
- Barnes & Hernquist (1996) Barnes, J. E., & Hernquist, L. E. 1996, ApJ, 471, 115
- Blitz & Rosolowsky (2006) Blitz, L., & Rosolowsky, E. 2006, ApJ, 650, 933
- Boselli et al. (2002) Boselli, A., Lequeux, J., & Gavazzi, G. 2002, A&A, 384, 33
- Cappellari et al. (2006) Cappellari, M., et al. 2006, MNRAS, 366, 1126
- Ciotti et al. (1991) Ciotti, L., et al. 1991, ApJ, 376, 380
- Cox et al. (2006) Cox, T. J., et al. 2006, ApJ, 650, 791
- Cretton et al. (2000) Cretton, N., Rix, H.-W., & de Zeeuw, P. T. 2000, ApJ, 536, 319
- Das et al. (2005) Das, M., et al. 2005, ApJ, 629, 757
- de Zeeuw & Franx (1989) de Zeeuw, P. T., & Franx, M. 1989, ApJ, 343, 617
- Downes & Solomon (1998) Downes, D., & Solomon, P. M. 1998, ApJ, 507, 614
- Faber & Gallagher (1976) Faber, S. M., & Gallagher, J. S. 1976, ApJ, 204, 723
- Fakhouri & Ma (2008) Fakhouri, O., & Ma, C.-P. 2008, MNRAS, 386, 577
- Gao & Solomon (2004) Gao, Y., & Solomon, P. M. 2004, ApJS, 152, 63
- Guo & White (2008) Guo, Q., & White, S. D. M. 2008, MNRAS, 384, 2
- Hernquist (1990) Hernquist, L. 1990, ApJ, 356, 359
- Hollenbach et al. (1971) Hollenbach, D. J., Werner, M. W., & Salpeter, E. E. 1971, ApJ, 163, 165
- Hopkins et al. (2009) Hopkins, P. F., et al. 2009, ApJ, 691, 1168
- Inoue et al. (1996) Inoue, M. Y., et al. 1996, AJ, 111, 1852
- Jonsson et al. (2010) Jonsson, P., Groves, B. A., & Cox, T. J. 2010, MNRAS, 403, 17
- Lee et al. (1996) Lee, H. H., Bettens, R. P. A., & Herbst, E. 1996, A&A, 119, 111
- Kaviraj et al. (2007) Kaviraj, S., et al. 2007, ApJS, 173, 619
- Keres et al. (2003) Keres, D., Yun, M., & Young, J. 2003, ApJ, 582, 659
- Khochfar & Burkert (2005) Khochfar, S., & Burkert, A. 2005, MNRAS, 359, 1379
- Knapp & Rupen (1996) Knapp, G. R., & Rupen, M. P. 1996, ApJ, 460, 271
- Lees et al. (1991) Lees, J. F., et al. 1991, ApJ, 379, 177
- Mihos & Hernquist (1996) Mihos, J. C., & Hernquist, L. 1996, ApJ, 464, 641
- Nakai & Kuno (1995) Nakai, N., & Kuno, N. 1995, PASJ, 47, 761
- Narayanan et al. (2006) Narayanan, D., et al. 2006, ApJ, 642, L107
- Narayanan et al. (2008) Narayanan, D., et al. 2008, ApJS, 176, 331
- Okuda et al. (2005) Okuda, T., et al. 2005, ApJ, 620, 673
- Pelupessy et al. (2006) Pelupessy, F. I., Papadopoulos, P. P., & van der Werf, P. 2006, ApJ, 645, 1024
- Robertson et al. (2006) Robertson, B. E., et al. 2006, ApJ, 645, 986
- Roberston & Bullock (2008) Robertson, B. E., & Bullock, J. S. 2008, ApJ, 685, L27
- Rupen (1997) Rupen, M. P. 1997, in ASP Conf. Ser. 116, The Nature of Elliptical Galaxies, ed. M. Arnaboldi, G. S. da Costa, & P. Saha (San Francisco: ASP), 322
- Springel (2005) Springel, V. 2005, MNRAS, 364, 1105
- Springel et al. (2005a) Springel, V., Di Matteo, T., & Hernquist, L. 2005, MNRAS, 361, 776
- Springel et al. (2005b) Springel, V., Di Matteo, T., & Hernquist, L. 2005, ApJ, 620, L79
- Springel & Hernquist (2002) Springel, V., & Hernquist, L. 2002, MNRAS, 333, 649
- Springel & Hernquist (2003) Springel, V., & Hernquist, L. 2003, MNRAS, 339, 289
- Stewart et al. (2008) Stewart, K. R., et al. 2008, ApJ, 683, 597
- Wiklind et al. (1997) Wiklind, T., et al. 1997, A&A, 323, 727
- Yi et al. (2005) Yi, S. K., et al. 2005, ApJ, 619, L111
- Young (2002) Young, L. M. 2002, AJ, 124, 788
- Young (2005) Young, L. M. 2005, ApJ, 638, 258
- Young et al. (2008) Young, L. M., Bureau, M., & Cappellari, M. 2008, ApJ, 676, 317
- Younger et al. (2009) Younger, J. D., et al. 2009, MNRAS, 396, 66
| Model | Orbit Angle | |||||||||
|---|---|---|---|---|---|---|---|---|---|---|
| (kpc) | () | () | (%) | (spectra) | (CV) | |||||
| d3e | 30 | 60 | -30 | 45 | 2.0 | 1.1 | 0.47 | 0.50 | ||
| d3m | 0 | 0 | 71 | 90 | 2.0 | 0.95 | 0.61 | 0.66 | ||
| d3f | 60 | 60 | 150 | 0 | 3.6 | 1.9 | 0.72 | 0.66 | ||
| d3k | -109 | 30 | 71 | 30 | 1.8 | 0.95 | 0.71 | 0.75 | ||
Note. — Models are referred to by the designations under the “Model” heading throughout the paper.
| Property | NGC 3032 | NGC 4459 | NGC 4526 | d3e | d3m | d3f | d3k |
|---|---|---|---|---|---|---|---|
| Distance (Mpc) | 21.4 | 15.7 | 16.4 | 17 | 17 | 17 | 17 |
| (kpc) | 0.93 | 2.7 | 3.5 | 1.2 | 6.0 | 4.8 | 3.6 |
| () | |||||||
| (kpc) | 1.5 | 0.67 | 1.1 | 2.0 | 2.0 | 3.6 | 1.8 |