A theoretical model of torsional oscillations from a flux transport dynamo model
Abstract
Assuming that the torsional oscillation is driven by the Lorentz force of the magnetic field associated with the sunspot cycle, we use a flux transport dynamo to model it and explain its initiation at a high latitude before the beginning of the sunspot cycle.
1 Introduction
The small periodic variation in the Sun’s rotation with the sunspot cycle, first discovered on the solar surface by Howard & LaBonte (1980), is called torsional oscillations. Helioseismology has now established its existence throughout the convection zone (see Howe et al. 2005 and references therein). Its amplitude near the surface is of order 5 m s-1 or about 1% of the angular velocity. Apart from the equatorward-propagating branch which moves with the sunspot belt, there is also a poleward-propagating branch at high latitudes. One intriguing aspect of the equatorward-propagating branch is that it begins a couple of years before the sunspots of a particular cycle appear and at a latitude higher than where the first sunspots are seen. The top panel of Fig. 1 shows the torsional oscillations at the solar surface with the butterfly diagram of sunspots. If the torsional oscillation is caused by the Lorentz force of the dynamo-generated magnetic field as generally believed, then the early initiation of this oscillation at a higher latitude does look like a violation of causality! Our main aim is to explain this which could not be explained by the earlier theoretical models (Durney 1980; Covas et al. 2000; Bushby 2006; Rempel 2006). The details of our work can be found in a recent paper (Chakraborty, Choudhuri & Chatterjee 2009a, hereafter CCC). Please note that this paper has an erratum (Chakraborty, Choudhuri & Chatterjee 2009b).
2 Theoretical model
The flux transport dynamo model first developed by Choudhuri, Schüssler & Dikapti (1995) appears to be the most promising model for explaining the sunspot cycle. We use the model presented by Chatterjee, Nandy & Choudhuri (2004). Some details of the model with the basic equations can be found in Choudhuri (2010). In order to model torsional oscillations, in addition to the basic equations of the dynamo, we simultaneously have to solve the Navier–Stokes equation in the form
where is the term corresponding to advection by the meridional circulation, is the diffusion term, and is the component of the Lorentz force. If the magnetic field is assumed to have the standard form
then the Lorentz force is given by the Jacobian
where . On the basis of flux tube simulations suggesting that the magnetic field in the tachocline should be of order G (Choudhuri & Gilman 1987; Choudhuri 1989; D’Silva & Choudhuri 1993), it is argued by Choudhuri (2003) that the magnetic field has to be intermittent in the tachocline. Hence the full expression of Lorentz involves a filling factor as explained by CCC.

Our theoretical model incorporates a hypothesis proposed by Nandy & Choudhuri (2002), which is essential for explaining the early initiation of the torsional oscillation at high latitudes. According to this Nandy–Choudhuri (NC) hypothesis, the meridional flow penetrating in stable layers below convection zone causes formation of toroidal field in high latitude tachocline. Sunspots form a few years later when this field is advected to lower latitudes and brought inside convection zone. We also assume that the stress of the magnetic field formed in the tachocline is carried upward by Alfven waves propagating along vertical flux concentrations conjectured by Choudhuri (2003).
3 Results of simulation
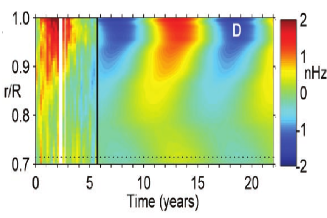
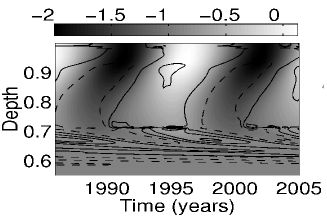
The incorporation of the NC hypothesis in our theoretical model causes magnetic stresses to build up at higher latitudes before sunspots of the cycle appear, leading to the early initiation of torsional oscillations. The bottom panel of Fig. 1 shows theoretical results of torsional oscillations at the surface with the theoretical butterfly diagram. This bottom panel can be compared with the observational upper panel in Fig. 1. Our theoretical model also gives a satisfactory account of the evolution of torsional oscillations within the convection zone. The depth-time plot of torsional oscillations at a certain latitude given in Fig. 3 of CCC compares favourably with the observational plot given in Fig. 3(D) of Vorontsov et al. (2002). This is reproduced in Fig. 2 for completeness.
References
- [Bushby (2006)] Bushby, P. J. 2006, MNRAS, 371, 772
- [Chakraborty et al. (2009a)] Chakraborty, S., Choudhuri, A. R., & Chatterjee, P. 2009a, Phys. Rev. Lett., 102, 041102
- [Chakraborty et al. (2009b)] Chakraborty, S., Choudhuri, A. R., & Chatterjee, P. 2009b, Phys. Rev. Lett., 103, 099902
- [Chatterjee et al. (2004)] Chatterjee, P., Nandy, D., & Choudhuri, A. R. 2004, A&A, 427, 1019
- [Choudhuri (1989)] Choudhuri, A. R. 1989, Solar Phys., 123, 217
- [Choudhuri (2003)] Choudhuri, A. R. 2003, Solar Phys., 215, 31
- [Choudhuri (2010)] Choudhuri, A. R. 2010, this volume
- [Choudhuri & Gilman (1987)] Choudhuri, A. R., & Gilman, P. A. 1987, ApJ 316, 788
- [Choudhuri et al. (1995)] Choudhuri, A. R., Schüssler, M., & Dikpati, M. 1995, A&A, 303, L29
- [Covas et al. (2000)] Covas, E., Tavakol, R., Moss, D., & Tworkowski, A. 2000, A&A, 360, L21
- [D’Silva & Choudhuri (1993)] D’Silva, S., & Choudhuri, A. R. 1993, A&A, 272, 621
- [Durney (2000)] Durney, B. R. 2000, Solar Phys., 196, 1
- [Howard & LaBonte (1980)] Howard, R., & LaBonte, B. J. 1980, ApJ, 239, L33
- [Howe et al. (2005)] Howe, R. et al. 2005, ApJ, 634, 1405
- [Nandy & Choudhuri (2002)] Nandy, D., & Choudhuri, A. R. 2002, Science, 296, 1671
- [Rempel (2006)] Rempel, M. 2006, ApJ, 647, 662
- [Vorontsov et al. (2002)] Vorontsov, S. V. et al. 2002, Science, 296, 101