Universal two-step crystallization of DNA-functionalized nanoparticles
Wei Dai,a Sanat K. Kumar,b and Francis W. Starr∗a
Received 7th June 2010, Accepted 12th August 2010
DOI: 10.1039/b000000x
We examine the crystallization dynamics of nanoparticles reversibly tethered by DNA hybridization. We show that the crystallization happens readily only in a narrow temperature “slot,” and always proceeds via a two-step process, mediated by a highly-connected amorphous intermediate. For lower temperature quenches, the dynamics of unzipping strands in the amorphous state is sufficiently slow that crystallization is kinetically hindered. This accounts for the well-documented difficulty of forming crystals in these systems. The strong parallel to the crystallization behavior of proteins and colloids suggests that these disparate systems crystallize in an apparently universal manner.
1 Introduction
The use of DNA as a programmable linking agent is a practical, “bottom-up” approach to materials design 1, 2, 3, 4. One starts from “molecules”, consisting of nanoparticles (NP) functionalized by multiple single stands of DNA (ssDNA). When the DNA on adjacent particles hybridize to form double-stranded DNA (dsDNA) the particles are physically linked, potentially leading to the formation of complex structures 5, 6. If one can specify the number and orientation of the ssDNA attached to the NP, it is possible to control the local geometry of the networks, which in turn may control the geometry of higher-order structures 7. This bottom-up approach can result in a precision hard to achieve by molecular nano-fabrication, with promising future applications in optical and electrical materials 8, 2. While there have been some recent successes creating crystalline ordered arrays of DNA-linked NP 9, 10, 11, 12, 13, 14, the formation of regularly ordered structures has proved challenging. More frequently, the NP assemble into disordered aggregates 15, 16, 17, 18, 19, 20, 21. Therefore, we aim to better understand the dynamical pathways the system must follow in order to crystallize, as well as the mechanisms that hinder ordering, with the ultimate goal of avoiding kinetic bottlenecks.
To put these difficulties in the context of more traditional materials, experiments on colloidal particles, which isotropically interact with each other, are well-known to exhibit a two-step crystallization mechanism. In these cases, the gas-liquid coexistence curve is metastable relative to the gas-solid coexistence curve. Quenching these colloidal system inside the gas-liquid coexistence region results in (i) a phase separation into a high-density liquid, followed by (ii) crystal nucleation within this high-density droplet. Quenching the system to very low temperature causes it to simply form disordered gels, kinetically hindering crystal formation. There is considerable theoretical and simulation evidence for this scenario 22, 23, 24, 25, 26, 27, 28, 29, 30, 31, 32. Similar ideas have also been proposed for proteins, and it is now believed that there is a crystallization temperature “slot” outside which crystallization does not occur 25, 26, 27, 28. An alternate mechanism for clustering preceding crystallization has also been proposed for the case of proteins interacting through strong, but patchy interactions. It has been argued that self-assembly, driven by highly specified local geometry imposed by the bonding sites, can create a locally high-density region which enhances the formation of nuclei, even in the absence of the thermodynamic drive for phase separation. A two-step mechanism, mediated by this self-assembled amorphous state, is thus another pathway by which proteins can crystallize 23. While the factors controlling the crystallization of colloids and proteins (or patchy colloids) may be system specific, we stress that crystallization in these soft matter systems always seems to follow a two-step kinetic scheme, with an amorphous, highly-connected phase serving as a kinetic intermediate.
Motivated by this apparent universality in these systems, we examine the crystallization of DNA-linked NP, where the formation of clusters is controlled by DNA hybridization. We show that, in spite of the significant differences in the physical connectivity between this case and previously examined situations (i.e., colloids and proteins), the crystallization of NPs linked by DNA tethers also follows a two-step process: initially there is a cluster of linked particles without any crystalline order. This process is facilitated either by self-assembly of the nanoparticles, or by phase separation, depending on the region of parameter space explored. We show that the persistence of this amorphous state grows very rapidly on cooling, resulting in a very narrow crystallization temperature slot. We thus argue that the crystallization of such ssDNA tethered NPs follow the same universal behavior as found for colloids, proteins and other patchy colloids.
2 Modeling
In our simulations, each NP is grafted with 6 chains in an octahedral symmetry. This orientation will naturally lead these NP to crystallize into a simple cubic structure. We use an effective potential model developed to capture the base-pair selectivity between two ssDNA based on the nucleotides’ identity (A, T, C, or G), and the bonding specificity which allows only one bond to each base 33, 34. The effective potential between two ssDNA depends only on the intermolecular separation and their relative angular orientation. The parameters of the effective potential are obtained by a systematic coarse-graining of a more detailed model for the DNA interactions, and it has been verified that the coarse-grained model quantitatively reproduces the behavior of the more explicit model 35, 34. We study this model via Monte Carlo (MC) simulations in the canonical ensemble (fixed number of particles , volume , temperature ). For a randomly chosen NP, we perform three sequential attempts – (i) NP translation without rotation, (ii) NP rotation without translation, and (iii) a combined NP translation and rotation. We define one Monte Carlo step (MCS) as such attempts, where is the total number of NP. Note that the dominant interactions in this system are between the bonding arms; the short-ranged NP core repulsion plays relatively little role. There are no explicit solvent interactions, so we cannot directly capture effects such as salt concentration. We used reduced units, as defined in ref. 33. To improve the statistics of our results, we average over 5-15 independent runs for each system.
The formation of a crystal or liquid phases in this system is driven by the DNA base pairing alone, resulting in very low density phases. The addition of significant attractions between NP cores – which might be expected in some experimental systems – can result in much higher density phases, where the density is determined by the packing of the NP cores. Such phases are analogous to those found for isotropically interacting colloids. We do not consider this more complicated situation in this paper, and defer it to future research.
Previously, ref. 36 examined the phase diagram for this model, and showed that it exhibits polymorphous phase behavior with at least six distinct crystal phases. The lowest density crystal, crystal I, consists of a simple cubic (SC) lattice that reflects the octahedral symmetry of the functionalized NP. The length of the DNA connections between NP leaves ample space, allowing the cubic order to repeat itself as a hierarchy of interpenetrating cubic lattices. Accordingly, crystal II consists of two interpenetrating SC lattices, crystal III has three interpenetrating SC lattices, etc. Experimentally, achieving this interpenetration may be challenging, due to repulsions from the charged DNA backbone. However, with a proper choice of solution, electrostatic interactions beyond a few nm between DNA can be effectively screened 37. Accordingly, functionalizing strands should be long enough to open the network structure and thereby minimize electrostatic repulsions.
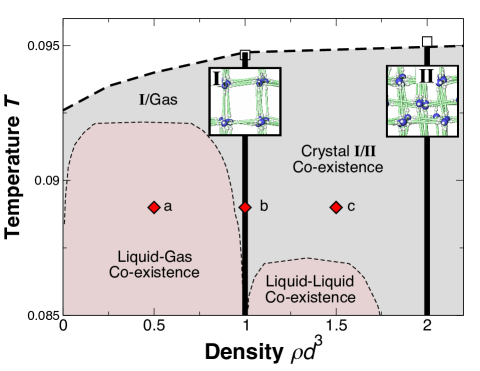
Fig. 1 shows the melting temperature for crystal I and II and the metastable amorphous phase boundaries; the phase boundary of the metastable amorphous phases is estimated by extrapolating the observed phase boundaries of NP functionalized by 3, 4, or 5 DNA strands in ref. 36. Parallel to the crystal polymorphism, there is liquid state polyamorphism – that is, this system exhibits the unusual feature of multiple thermodynamically distinct liquid states in a pure system 40, 38, 39.
We focus primarily on quenches to where we empirically find that crystallization proceeds most readily. We also consider other to test how the rate of crystallization varies. We investigate systems at , , and , where is the scaled density so that a single SC lattice has density 36. We keep fixed, so these three densities correspond to , respectively. The system at is located in the amorphous phase separation region, whereas other two systems at , and are outside of any amorphous-amorphous phase transition. These three systems allow us to separately address the role of single versus double-interpenetrating crystals, and spinodal-assisted versus assembly-driven crystallization processes.
3 Results
Since we wish to track the dynamics of crystallization, we need to separately identify the formation of clusters and the degree of crystallinity of those clusters. First, we evaluate the evolution of the cluster size directly from the number of bonded NP and calculate the weighted mean cluster size
| (1) |
where is the size of a cluster at some time , and is the probability of finding a cluster of size . Here, a bond is determined by the linkage of the DNA strands connecting NP.
Following the approach in ref. 41, we can identify crystal-like regions using an orientational order parameter , defined by a sum over spherical harmonic functions using the unit vectors defined by the bonded neighbors. Among the various choices for the degree of , provides the strongest signal for the expected cubic symmetry; specifically, for an ideal SC lattice. To capture the locally SC structure in case of two separate lattices, we consider only bonded neighbors when calculating , excluding unbonded neighbors, which might have small separation but belong to a distinctly different bonded network. Additionally, we compute for nearest neighbors to identify possible body-centered-cubic (BCC)-like structures of non-bonded units that might arise due to interpenetration at . For amorphous systems, in the thermodynamic limit, so that one can immediately distinguish crystal from amorphous systems.
While and are useful to identify global crystallinity in a given configuration, they are less helpful in identifying the presence of local crystal regions embedded in a larger amorphous cluster. Identification of these locally crystalline regions is necessary to track if crystals can assemble directly, or if crystals only form following a connected amorphous intermediate state. Following ref. 41, we identify crystal-like particles using a local invariant for each individual particle, and the corresponding complex vector . A particle is said to be crystal-like if it has a minimum number of neighbors with crystal-like connections. Bonded particles and are said to have a crystal-like connection if the vector dot product exceeds a threshold value. By comparing the distribution of dot product values of amorphous systems with well-crystallized systems, we find that a threshold value for the dot product identifies more than of bonds in crystal state, and only misidentifies less than of the bonds of the amorphous system as crystal-like at . Similar precision is found at and . Finally, analysis of these systems shows that we reliably define a crystal-particle if it has at least three crystal-like bonded neighbors. We use this as our criterion to label an NP as part of a crystal.
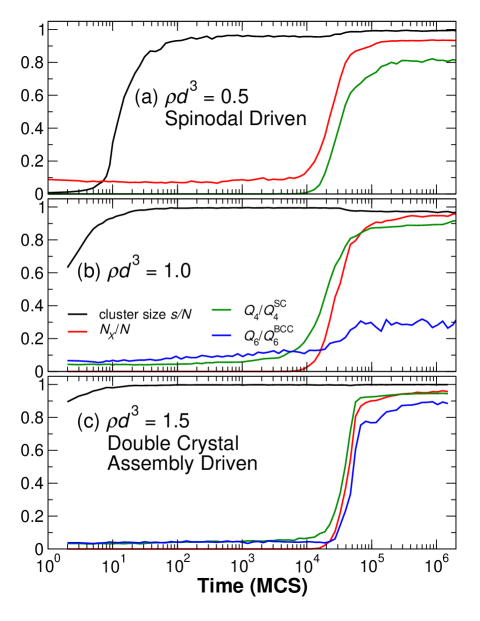
We examine the evolution of the crystallizing systems by evaluating the fractional cluster size , the fraction of crystal-like nanoparticles , and the normalized average orientation , so that all quantities vary over the range (Fig. 2). The density allows us to examine crystallization to a single network in the presence of an amorphous phase separation, similar to the case of colloidal systems. For comparison, density follows crystal formation driven only by the assembly of DNA links. Finally, for , self-assembly (without phase separation) drives the formation of a higher density state so that the system crystallizes into a combination of a single cubic lattice and a second higher density interpenetrating lattice. Accordingly, we can determine if the pathway for crystallization for interpenetrating networks differs from that for a single network, and compare spinodal driven versus self-assembly driven clustering.
Figure 2 shows that, after quenching from high to (just below the hybridization temperature for the DNA), we find that all systems rapidly undergo a condensation from an unbonded state to a large, bonded amorphous cluster. Both and remain small for , demonstrating the amorphous nature of the cluster. The ordering process only occurs much later, at when and rise sharply within a narrow window of time. Since the ordering happens over a relatively narrow time window, the global is itself an indication of crystal formation. Note that the fraction never reaches one, since there are always surface particles of the crystal that will not be identified as crystal-like. These results establish that, for each state point considered, the system first forms a highly connected amorphous phase, from which a crystal nucleates and grows. We refer to this as the two-step process of crystallization.
Having established the two-step nature of crystallization, we next wish to determine if the intermediate amorphous phase can be considered a metastable equilibrium, and how this impacts the difficulty of the eventual crystallization. To do so, we examine the crystallization dynamics as a function of the quench depth by evaluating the time needed for the crystal to nucleate and the internal relaxation time of the amorphous intermediate. We define by the time when 10% of the particles are designated as crystal, since the crystallization process appears irreversible at this fraction; an alternate criterion will change the value of , but not the dependence. We define for the amorphous phase from the relaxation time of the coherent intermediate scattering function , evaluated at the wave vector corresponding to the bonding distance between NP; we choose this wave-vector since it captures the slowest relaxation (apart from ). The determination of is complicated due the the aging of the amorphous state following the temperature quench. To limit aging effects, we wait for the largest possible time to begin calculating that will still allow to decay to zero prior to crystallization.
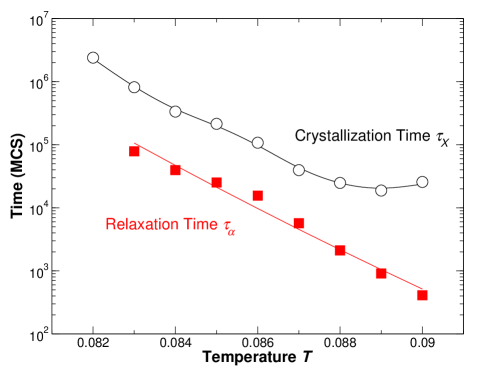
Figure 3 shows the time crystallization time and the amorphous relaxation time for density , which have been averaged over 10 independent trajectories. Such a plot is commonly referred to as a “time-temperature-transformation” diagram 42, 43. We find that is significantly smaller than so that the clustered state can reach a metastable equilibrium prior to crystallization. Hence the first step toward crystallization also includes the equilibration of the metastable state. On cooling, increases rapidly, since the lifetime of dsDNA pairs grows quickly, thereby hindering relaxation. In contrast, initially decreases on cooling, expected since the predicted barrier to crystallization decreases on cooling from classical nucleation theory 42. However, on further cooling, rapidly increases, as it become dominated by the slow relaxation of . From a physical perspective, the persistence of DNA base-pair bonds prevents unzipping on a reasonable time scale, and thus the amorphous cluster cannot reorganize to “find” the crystal state, resulting in a kinetically dominated process. Accordingly, there is a very narrow slot that must be found for successfully nucleating the crystal state. The minimum, or “nose”, in the crystallization time is ubiquitous in supercooled liquids 42, 43, 44, 45. If the system is cooled below in a time less than , the system will not have adequate time to crystallize. Accordingly, the nose defines a critical cooling rate , where is the melting temperature 42; cooling faster than this rate will prevent crystallization in all cases, and should therefore be avoided.
For the highest density , we wish to further determine if the formation of a double network occurs simultaneously with, or after the formation of a single SC network. To test this, we check for the presence of BCC order in the lattice using (since it is more sensitive to BCC order) and compare its evolution to . For the calculation of , we use spatial separation, rather than bonds, to determine neighbors, since the units comprising the BCC structure are actually unbonded neighbors in a separate cubic lattice. These unbonded neighbors are separated by a distance less than the bonding distance. Choosing a cutoff separation of (ratio of BCC to FCC lattice spacing) effectively excludes cubic bonded neighbors, and includes most neighbors that should have BCC order. We actually use a slightly less restrictive definition, and include neighbors up to a distance , since the positions of interpenetrating particles are not rigidly fixed; this cutoff is still small enough that it excludes the vast majority of bonded neighbors.
For reference, we first examine density where there should be no interpenetration, so that we know to what degree might give a false signal of interpenetration. Fig 2(b) shows that for the final SC crystal, so that we have little false signal of interpenetration. The small value of can be largely attributed to our choice of the cutoff distance used to determine neighbors, since if we included the bonded neighbors of the SC lattice we would expect (for a perfect SC lattice). Applying this metric for the case with interpenetration (), Fig. 2(c) shows that captures the eventual interpenetration. However, the growth of slightly lags behind that of of . Thus, the formation of a single cubic lattice appears to slightly precede the interpenetrating structure. Note that the asymptotic value of for is slightly larger than for the lower densities. This is because we use a larger , and thus the surface-to-volume ratio is smaller, and so the surface effect on is smaller.
For both densities, note that slightly increases upon crystallization. Presumably, the long ranged order allows for the formation of some additional bonds that were dangling in the clustered, but disordered state. For , has a very small but noticeable decrease immediately prior to ordering. This can be understood by the fact that the formation of two interpenetrating SC lattices requires a separation of two lattices; therefore, there must be a temporary breaking of amorphous bonds between locally cubic lattices before ordering, which temporarily decreases .
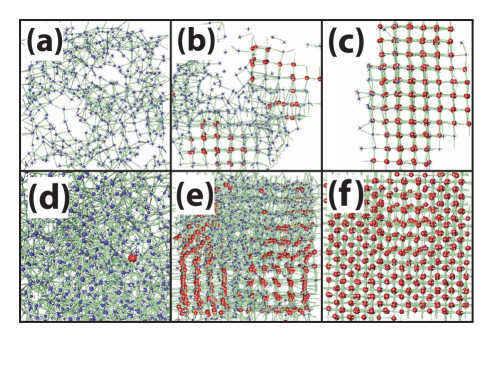
We directly visualize the crystallization of two systems ( and ) at three important points: (i) clustering prior to ordering; (ii) the ordering process, and (iii) after ordering (Fig. 4). The crystal-like NP are colored in red with a slightly larger radius. From Fig. 4 (b) and (e) we can clearly see the interface between crystal and amorphous phases. Fig. 4 (b) has two separate SC lattices and evidence of multiple nucleation cores.
4 Discussion and Conclusions
The observed sequence of clustering via DNA links followed by ordering for all densities confirms that the crystallization dynamics for the DNA-linked NP follows a conventional “two-step” pathway of crystallization – even in the case where a double-interpenetrating network must form. Depending on density, the amorphous intermediate is driven either through metastable phase separation or DNA driven assembly. Additionally, the intermediate amorphous state has a rapidly growing lifetime on cooling. Thus, the same framework used to understand protein and colloid crystallization kinetics also applies to this more unusual material.
We compare our results with the recent experimental studies of Mirkin and co-workers 14, where they report a 3-stage crystallization process for uniformly DNA-coated NP. In that study, the NP initially form small amorphous aggregates, and these clusters separately evolve crystallinity at stage two. The ordered but dispersed clusters eventually coalesce into a large final crystal lattice. As noted by these authors, this last stage of crystallization is probably driven by Ostwald ripening, a mechanism that is relatively well explored. Accordingly, these experiments also fit within the general framework of the two-step process, since the crystallinity of small clusters evolves from the amorphous aggregates. To further compare to these experiments, we also checked if very slow ripening might occur in our simulations under different thermodynamic conditions. Indeed, simulations at lower density () evolve crystallinity in small region within the amorphous cluster. The subsequent growth of this crystal is so slow, that we are not able to complete the crystallization in the computational time frame of the simulation. This slower scenario for crystal growth is likely the same as that observed in ref. 14. Accordingly, the rate of the “second” step in the process (crystal growth) can vary significantly depending on the state point chosen. We should note a potentially important difference between our simulations and that of the experiments of ref. 14. For the uniformly coated NP used experimentally, the local NP binding is not predisposed to reflect the order of the eventual crystal state. In contrast, our 6-armed units bind in such a way to readily reflect SC symmetry. We expect that the coarsening to the eventual crystal state should occur more readily in the case where the crystal order is reflected in the symmetry of local bonding. Nonetheless, since the experimental system and the simulated model behave similarly, we conclude that the two-step crystallization is the apparently universal pathway followed by these systems.
Experiments using nanoparticles functionalized with many strands of DNA (as opposed to a small number of strands) present an additional potential barrier to crystallization. As the strand density increases, it has been experimentally found that the hybridization transition becomes increasingly sharp 46. This behavior has also been argued for theoretically 4. Narrowing the hybridization window will also result in narrowing the crystallization temperature slot – making the formation of ordered structures even more challenging. Accordingly, it may be valuable to work with NP functionalized by a small number of strands. These limited functionality systems also have the advantage that they lend themselves more readily to a theoretical description 47.
Since there are no NP attractions in our model (other than indirectly via DNA linking), the gas-liquid phase separation is driven by the self-assembling DNA-hybridization. If, in addition to the hybridization, there were isotropic NP attractions, the system might be able to form a much higher density droplet controlled by the packing of the NP cores. This could result in a crystallization by hybridization that would actually dramatically decrease the density relative to the amorphous cluster, since DNA links will serve to open the structure, qualitative similar to the crystallization of ice from water. Such an intermediate not created by DNA base pairing might offer different pathways to creating crystals, without the kinetic traps that are encountered experimentally. This is another possible avenue to pursue to experimentally facilitate the crystallization process.
The highly specified DNA orientation in our model clearly helps to build in self-assembly of the higher-order crystal structure. However, this is not a sufficient condition to guarantee the ready formation of crystals. If that were the case, a previous study of NP decorated with ssDNA in a tetrahedral orientation 35 should have discovered the spontaneous formation of diamond lattices, but instead found only amorphous gels. Hence, significant work remains to understand how to best design a desired higher order structure from relatively simple building blocks.
5 Acknowledgments
We thank C.W. Hsu, F. Sciortino, and F. Vargas for helpful discussions. We acknowledge the NSF for support under grant number DMR-0427239, and we thank Wesleyan University for computer time supported by the NSF under grant number CNS-0959856.
References
- Niemeyer 2000 C. M. Niemeyer, Curr. Opin. Chem. Biol., 2000, 4, 609–618.
- Seeman 2003 N. C. Seeman, Nature, 2003, 421, 427–430.
- Condon 2006 A. Condon, Nat. Rev. Genet., 2006, 7, 565–575.
- Geerts and Eiser 2010 N. Geerts and E. Eiser, Soft Matter, 2010, in press.
- Mirkin et al. 1996 C. A. Mirkin, R. L. Letsinger, M. R. C. and J. J. Storhoff, Nature, 1996, 382, 607–609.
- Alivisatos et al. 1996 A. P. Alivisatos, K. P. Johnsson, X. G. Peng, T. E. Wilson, C. J. Loweth, M. P. Bruchez and P. G. Schultz, Nature, 1996, 382, 609–611.
- Glotzer and Solomon 2007 S. C. Glotzer and M. C. Solomon, Nat. Mater., 2007, 6, 557–562.
- Crocker 2008 J. C. Crocker, Nature, 2008, 451, 528.
- Kim et al. 2009 A. J. Kim, R. Scarlett, P. L. Biancaniello, T. Sinno and J. C. Crocker, Nat. Mater., 2009, 8, 52–55.
- Park et al. 2008 S. Y. Park, A. K. R. Lytton-Jean, B. Lee, S. Weigand, G. C. Schatz and C. A. Mirkin, Nature, 2008, 451, 553–556.
- Nykypanchuk et al. 2008 D. Nykypanchuk, M. M. Maye, D. van der Lelie and O. Gang, Nature, 2008, 451, 549–552.
- Xiong et al. 2009 H. Xiong, D. van der Lelie and O. Gang, Phys. Rev. Lett., 2009, 102, 015504.
- Kim et al. 2006 A. J. Kim, P. L. Biancaniello and J. C. Crocker, Langmuir, 2006, 22, 1991–2001.
- Macfarlane et al. 2009 R. J. Macfarlane, B. Lee, H. D. Hill, A. J. Senesi, S. Seifert and C. A. Mirkin, Proc. Natl. Acad. Sci. U.S.A., 2009, 106, 10493–10498.
- Park et al. 2004 S.-J. Park, A. A. Lazarides, J. J. Storhoff, L. Pesce and C. A. Mirkin, J. Chem. Phys., 2004, 108, 12375.
- Biancaniello et al. 2005 P. L. Biancaniello, A. J. Kim and J. C. Crocker, Phys. Rev. Lett., 2005, 94, 058302.
- Nykypanchuk et al. 2007 D. Nykypanchuk, M. M. Maye, D. van der Lelie and O. Gang, Langmuir, 2007, 23, 6305.
- Maye et al. 2006 M. M. Maye, D. Nykypanchuk, D. van der Lelie and O. Gang, J. Am. Chem. Soc., 2006, 128, 14020–14021.
- Maye et al. 2007 M. M. Maye, D. Nykypanchuk, D. van der Lelie and O. Gang, Small, 2007, 3, 1678–1682.
- Park et al. 2001 S.-J. Park, A. A. Lazarides, C. A. Mirkin and R. L. Letsinger, Ang. Chem., 2001, 40, 2909 – 2912.
- Geerts et al. 2008 N. Geerts, T. Schmatko and E. Eiser, Langmuir, 2008, 24, 5118–5123.
- Hobbie 1998 E. K. Hobbie, Phys. Rev. Lett., 1998, 81, 3996–3999.
- Liu et al. 2009 H. Liu, S. K. Kumar and J. F. Douglas, Phys. Rev. Lett., 2009, 103, 018101.
- Filobelo et al. 2005 L. F. Filobelo, O. Galkin and P. G. Vekilov, J. Chem. Phys., 2005, 123, 014904.
- Galkin and Vekilov 1999 O. Galkin and P. G. Vekilov, J. Phys. Chem. B, 1999, 103, 10965–10971.
- Galkin and Vekilov 2000 O. Galkin and P. G. Vekilov, Proc. Natl. Acad. Sci. U.S.A., 2000, 97, 6277–6281.
- Galkin and Vekilov 2000 O. Galkin and P. G. Vekilov, J. Am. Chem. Soc., 2000, 122, 156–163.
- Vekilov 2005 P. G. Vekilov, J. Cryst. Growth, 2005, 275, 65–76.
- Garetz et al. 2002 B. A. Garetz, J. Matic and A. S. Myerson, Phys. Rev. Lett., 2002, 89, 175501.
- Bonnett et al. 2003 P. Bonnett, K. J. Carpenter, S. Dawson and R. J. Davey., Chem. Comm., 2003, 698–699.
- Qian and Botsaris 2004 R.-Y. Qian and G. D. Botsaris, Chem. Eng. Sci., 2004, 59, 2841–2852.
- Lu et al. 2008 P. J. Lu, E. Zaccarelli, F. Ciulla, A. B. Schofield, F. Sciortino and D. A. Weitz, Nature, 2008, 453, 499–503.
- Starr and Sciortino 2006 F. W. Starr and F. Sciortino, J. Phys. Condens. Matter, 2006, 18, L347–L353.
- Largo et al. 2007 J. Largo, P. Tartaglia and F. Sciortino, Phys. Rev. E, 2007, 76, 11402.
- Hsu et al. 2008 C. W. Hsu, J. Largo, F. Sciortino and F. W. Starr, Proc. Natl. Acad. Sci. U.S.A., 2008, 105, 13711–13715.
- Dai et al. 2009 W. Dai, C. W. Hsu, F. Sciortino and F. W. Starr, Langmuir, 2009, 26, 3601–3608.
- Randall et al. 2006 G. L. Randall, B. M. Pettitt, G. R. Buck and E. L. Zechiedrich, Journal of Physics: Condensed Matter, 2006, 18, S173.
- Poole et al. 1997 P. H. Poole, T. Grande, C. A. Angell and P. F. McMillan, Science, 1997, 275, 322–323.
- Mishima and Stanley 1998 O. Mishima and H. E. Stanley, Nature, 1998, 396, 329–335.
- Poole et al. 1992 P. H. Poole, F. Sciortino, U. Essmann and H. E. Stanley, Nature, 1992, 360, 324–328.
- ten Wolde et al. 1996 P. R. ten Wolde, M. J. Ruiz-Montero and D. Frenkel, J. Chem. Phys., 1996, 104, 9932–9947.
- Debenedetti 1996 P. G. Debenedetti, Metastable Liquids, Princeton University Press, Princeton, 1996.
- MacFarlane et al. 1983 D. R. MacFarlane, R. K. Kadiyala and C. A. Angell, The Journal of Chemical Physics, 1983, 79, 3921–3927.
- Kim et al. 1996 Y. J. Kim, R. Busch, W. L. Johnson, A. J. Rulison and W. K. Rhim, Applied Physics Letters, 1996, 68, 1057–1059.
- Yamada et al. 2002 M. Yamada, S. Mossa, H. E. Stanley and F. Sciortino, Phys. Rev. Lett., 2002, 88, 195701.
- Jin et al. 2003 R. Jin, G. Wu, Z. Li, C. A. Mirkin and G. C. Schatz, Journal of the American Chemical Society, 2003, 125, 1643–1654.
- Hsu et al. 2010 C. W. Hsu, F. Sciortino and F. W. Starr, Physical Review Letters, 2010, 105, 055502.