Present address: ] Muon Science Laboratory, Institute of Materials Structure Science, KEK, 1-1 Oho, Tsukuba, Ibaraki 305-0801, Japan
The magnetic structure of the chain family NaxCa1-xV2O4 determined by muon-spin rotation
Abstract
We present muon-spin rotation measurements on polycrystalline samples of the complete family of the antiferromagnetic (AF) chain compounds, NaxCa1-xV2O4. In this family, we explore the magnetic properties from the metallic NaV2O4 to the insulating CaV2O4. We find a critical which separates the low and high Na-concentration dependent transition temperature and its magnetic ground state. In the compounds, the magnetic ordered phase is characterized by a single homogenous phase and the formation of incommensurate spin-density-wave order. Whereas in the compounds, multiple sub-phases appear with temperature and . Based on the muon data obtained in zero external magnetic field, a careful dipolar field simulation was able to reproduce the muon behavior and indicates a modulated helical incommensurate spin structure of the metallic AF phase. The incommensurate modulation period obtained by the simulation agrees with that determined by neutron diffraction.
pacs:
76.75.+i, 75.50.Lk, 75.50.EeI Introduction
Experimental and theoretical studies of quasi-one dimensional (quasi-1D) magnets have flourished recently. On theoretical grounds, such systems seem to experience low dimensionality combined with frustrated interactions of nearest-neighbors and next-nearest-neighbors competition, leading to spin density waves forming chiral orderhikihara and other exotic ground stateszvyagin ; oleg . Experimentally, progress has accelerated due to recent use of high-pressure techniques varga ; akimoto ; yamauraChem , enabling synthesis of numerous compounds. Such materials show remarkable physical behavior yamauchi ; nakamura ; mao , where the nature behind these phenomena is governed by a strong spin-spin interaction along one direction combined with a much weaker interaction in the other directions. A novel quasi-1D spin system of particular interest is NaV2O4 (NVO)yamaura , which is isostructural with CaV2O4 (CVO)pieper . Unlike other vanadate compounds, which are spinelszhang , NVO and CVO posses an orthorhombic structure with the Pnma space group, where irregular hexagonal 1D channels are formed by a series of edge-sharing VO6 octahedra aligned along the -axis. The magnetic V ions are thus arranged in a 1D chain. Despite their closely related chemical and crystallographical nature, they exhibit dramatically different magnetic and electronic properties. The metallic NVO incorporates a mixed valence V+3.5 state and undergoes an antiferromagnetic (AF) transition at K, with a complex magnetic ground stateyamaura ; jun1 . In fact, recent neutron studies indicate the formation of incommensurate magnetic order in NVO below nozaki . The insulating CVO, on the other hand, has a V+3 valence () with an AF transition at K, coexisting with intrachain ferromagnetic interactions. Furthermore, the chemical substitution of Na for Ca causes an interesting insulator to metal transition at a critical Na concentration in NaxCa1-xV2O4 (NCVO). The presence of the insulator to metal transition suggests a dynamic change in the electronic structure of NCVO with , resulting in the change in its magnetic ground state. It is therefore desirable to systematically investigate the evolution of the microscopic magnetic order/disorder in NCVO.
Recently, through the use of positive muon-spin rotation and relaxation (SR), we found the formation of static AF order for a few NCVO compounds below their and proposed a magnetic phase diagramjun1 . SR is known to be a powerful technique for studies on microscopic magnetic nature in solids, due to its inherent 100% spin polarization and local sensitivity. The most interesting feature in NCVO is the unusual coexistence of AF order and metallic behaviour below for NCVO with . The main purpose of this paper is, therefore, to clarify the microscopic magnetic ground state of the entire NCVO family through the use of SR and numerical simulations based on dipolar field calculations. This is, to our knowledge, a pioneering attempt to deduce the incommensurate modulation period from SR data. We also seek to complete the magnetic phase diagram of NCVO by additional SR measurements on insulating and metallic NCVO samples with and , which were not described in our previous report. Our results reveal that the magnetic ground state in the insulating compounds with are also an incommensurate magnetically ordered phase. This means that not only pure CaV2O4 but also the complete family of NCVO exhibit incommensurate magnetic order at low , concurrent with the change of the valence state of the V ion from 3 to 3.5 with increasing . This could provide a very interesting challenge for theorists: to predict the magnetic phase diagram of this chain compounds.
II Experiment
Polycrystalline samples of NCVO were prepared by a solid-state reaction technique under a pressure of 6 GPa using CaV2O4, Na4V2O7, and V2O3 powders as starting materials. A mixture of the three powders was packed in an Au capsule, then heated at 1300oC for 1 hour, and finally quenched to ambient . A powder X-ray diffraction (XRD) analysis showed that all the samples were almost single phase with an orthorhombic system, space group, at ambient . dc- measurements showed that all our samples have almost the same dependence as that in the previous report Sakurai . The preparation and characterization of the samples have been reported in greater detail elsewhere Sakurai .
The SR measurements were carried out on the M20 surface muon beamline with the LAMPF spectrometer at TRIUMF, the Canada’s National Laboratory for Particle and Nuclear Physics located in Vancouver, Canada, which provides a highly intense, polarized beam of positive muons. The samples, 13 polycrystalline discs with 6 mm diameter and 5 mm thickness of NCVO, were mounted on the sample holder for the muon veto cryostat insert sample_holder by Mylar-tape.
Weak transverse field SR (wTF-SR) and zero field SR (ZF-SR) spectra were measured in a non-spin-rotated mode– i.e., the initial muon-spin direction is anti-parallel to the muon momentum direction. Here, “weak” means that the applied field is significantly less than any possible spontaneous internal fields () in the ordered state. A wTF-SR technique is sensitive to local magnetic order through the spin polarization amplitude. In contrast, ZF-SR is a sensitive probe of local magnetic [dis]order through the precession of the muon due to internal magnetic fields at the muon interstitial sites.
III Results
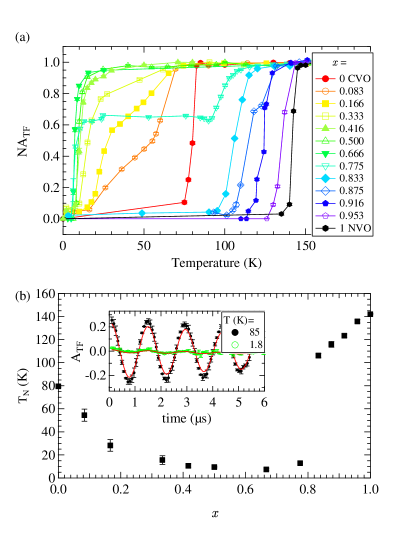
In the inset of Fig. 1(b) we show the typical wTF asymmetry () represented here by the sample at two temperatures, above and below . In the paramagnetic state, at high temperatures ( K), the muon-spin precess at the frequency corresponding to the external transverse field Oe. Below , decreases, due to the strong static internal magnetic fields, , obeying . The remaining oscillating amplitude, shown in the figure, reflects the portion of muons not coupled to , thus the fraction of the wTF oscillatory signal below is negligibly small for the magnetic nature of these compounds. The wTF spectrum is well described by an exponentially relaxing cosine oscillation;
| (1) |
where with kHz/Oe. The fit is represented by the solid lines in the inset of Fig. 1(b).
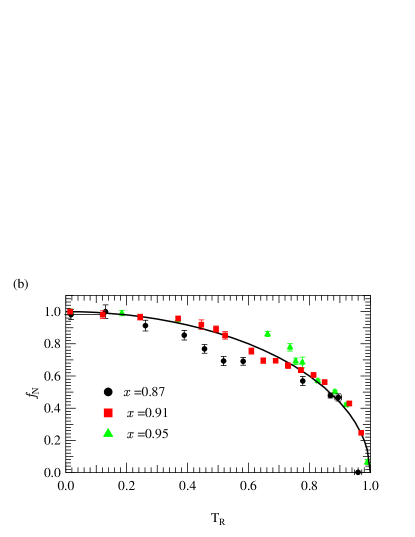
Figure 1(a) depicts the temperature dependence of the normalized , , which is proportional to the fraction of the paramagnetic regions in the sample. In NCVO, we find two distinct AF phases; one occurs as Na concentration increases up to and the transition temperature, decreases, the second occurs with , as the Na concentration increases takes a sharp turn and increases to higher and higher temperatures with increasing above K. These observations are summarized in Fig. 1(b) which plots versus the Na concentration . is found at the middle of the transition and the errors on are taken as of the transition temperature width. Since the and samples do not experience a sharp magnetic transition, we find these samples to be a mixture of phases. Additionally, we can indicate that a critical doping level separates the two phases. However, we wish to emphasize that both bulk magnetization measurements and x-ray diffraction analysis show that each of these samples is almost a single phase with an orthorhombic structurejun1 ; varga . This clearly indicates the importance of the current microscopic measurements, which show results quite different from the macroscopic bulk measurements.
III.1 insulating region; NCVO with
We now explore the two AF phases, identified by the wTF-SR measurements, using the ZF-SR technique. The ZF-SR is a sensitive site-based probe of static magnetism, in which the time dependent muon polarization signal is determined exclusively by the ’s in the sample. We expect that different magnetic phases would cause different s, resulting in different muon frequencies. Therefore, following upon the wTF measurements, we performed detailed ZF measurements for the entire range. In the range, we concentrate on the low behaviour, where the AF transition occurs for K. In contrast, for the samples, we examine a broad range below 150 K.
Before discussing our current results in NCVO, we briefly summarize the ZF-SR results of pure CVOjun1 . The CVO ZF-SR spectra indicated four temperature dependent frequencies below the AF transition, two of which have significant amplitudes. In order to clarify the ground state, dipolar field calculations suggested that AF order exists along the two 1D legs in the chain, and AF order between the chains. This result was found to be consistent with neutron measurements both for ’s and the magnitude of the ordered V moment.
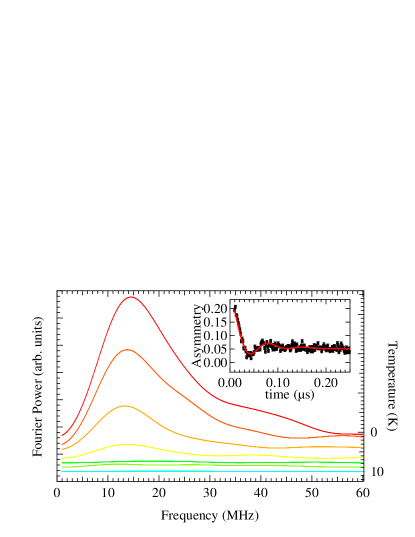
The typical raw ZF-spectrum, represented by the sample, taken at K is depict in the inset of Fig. 2. One can clearly see a strongly damped oscillation in the early time domain, s, at the lowest measured. In order to fit the spectrum, we, at first, attempted to apply a combination of an exponentially relaxing cosine signal and a slowly relaxing signal. The former corresponds to the static AF ordered signal, and the latter does to the “1/3” tail for the powder sample:
| (2) | |||||
| (3) |
Although the ZF-spectrum was reasonably fitted by Eq. (3), the initial phase () delays by , and in the , and samples. Since should be zero for a simple commensurate AF order, the delay indicates either a wide distribution of or a formation of an incommensurate (IC) AF order. In fact, the Fourier Transform (FT) of the ZF time-spectrum in clearly demonstrates the wide field distribution at the muon sites [see the main panel of Fig. 2 as an example of the sample]. The FT spectrum also indicates the presence of a shoulder on the higher frequency side, suggesting the formation of complex magnetic order. Indeed, the ZF-spectrum is better fitted by a zeroth-order Bessel function of the first kind [)], especially in explaining the fast relaxing behaviour in the early time domain (before 0.02 s). A ZF-spectrum described by is well established signature that the ’s experience an IC magnetic field in the lattice muSR_ICfields . Hence, the ZF-SR spectra at low were fitted with a combination of two signals;
| (4) | |||||
| (5) |
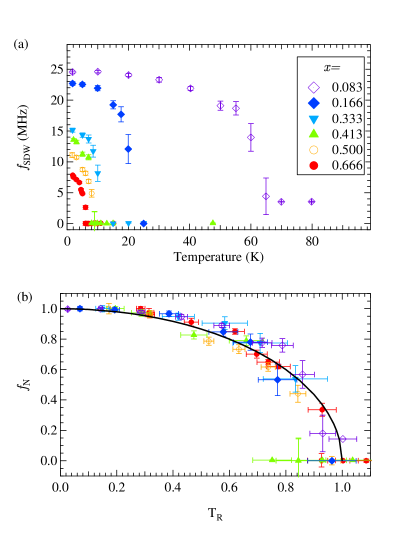
The fit is demonstrated by the solid line in the inset of Fig. 2. In Fig. 3(a), we plot the frequency , extracted from the fits, versus . For all , as increases, decreases with an increasing slope (d/d) and approaches zero at . Interestingly, as indicated in Fig. 3b, the normalized [] and the reduced () are independent of [see Fig.3(b)]. In fact, the -vs.- curves now collapse to a single universal curve, indicating the same origin of the IC transition. This universal curve is well explained by the dependence of the BCS gap energy, as expected for the order parameter of the IC-AF state Gruner_1 Le . This was recently found by a 51V NMR study, which suggested an IC AFM for hikaru (Note that AF resonance lines in the metallic phase were observed in Ref.hikaru ). We therefore find that the IC phase in the insulating region includes all compounds, at low .
The transverse relaxation rate, , shows typical critical behavior as , namely, increases with increasing up to as expected ryan ; uemura ; kalvius . The longitudinal relaxation rate, , can in principle reveal whether frustration prevents the system from reaching the full static limit, as observed in some highly frustrated systems: normally one expects (static limit) as . However, is very small (s-1) compared with and difficult to determine reliably, especially in the presence of several signals, hence we cannot make a confident statement.
III.2 metallic region; NCVO with
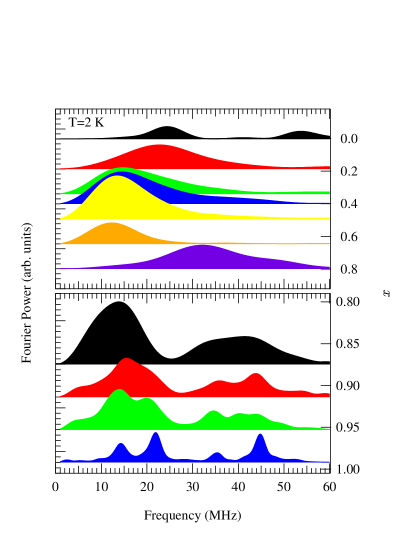
The FT of the whole range, at K, is presented in Fig. 4. Clearly, the ZF measurements of the metallic compounds, i.e., samples, reveal different behavior than those at smaller x. Unlike the insulating compounds, the metallic compounds, display multiple frequencies (two in , four in ), forming one frequency at higher and vanishing above the phase transition (not shown). Therefore, the ZF-spectra for these compounds were fitted by a sum of four oscillating signals with a slow exponential relaxation,
| (6) | |||||
| (7) |
where and , and are the angular frequency, the initial phase, and the relaxation rate of the -th muon precession, and are the asymmetry and the relaxation rate for the “1/3 tail” signalishida ; zorkoJAP , as we measured powder samples.
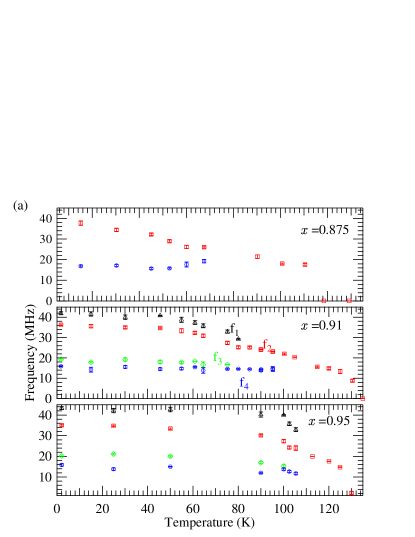
The quality of the fit, shown for NVO, is represented by the solid green line in Fig. 6(a). The dependence of the frequencies, , of the samples shown in Fig. 5(a). In the sample, we note that at K two frequencies are distinguished, but at K a single frequency is observed. In (), the number of frequencies is decreased from 4, at K to 2 (3) and then to one frequency. Recent neutron scattering measurements suggests that a small displacement of O2- ions, which leads to a change in the muon sitesnozaki is the trigger to this intermediate phase. This scenario was also proposed in other compoundsjun2007 . One of the distinctive features in this range, are two common frequencies. At base , MHz and MHz are independent. As in the insulating phase, by plotting the frequency versus the reduced temperature results in the collapse of these frequencies to a single curve, suggesting the IC AFM in this phase as well. Fig. 5(b) demonstrates this for . In the next section we aim to find the correct spin configuration which produces this behavior.
| [] (Å-1) | |||
|---|---|---|---|
| Helical | 0.916 | 0.381 | 1.591 |
| 0.958 | 0.363 | 3.732 | |
| 1 | 0.191 | 0.910 | |
| Linear | 1 | 0.571 | 105.203 |
IV Discussion
IV.1 Incommensurate AF structure for NVO
We now address the origin of the 4 frequencies observed in metallic phase using computer simulations. We aim to fit the raw experimental data with a minimal number of free parameters. We use the known crystallographic structure in order to create the simulated crystal modelSakurai . We then find all possible muon sites in the sample using electrostatic potential calculationsexplain . Indeed the model finds 4 distinct muon sites, which was also seen previously in the pure NVOjun1 . The next step was to find the correct spin configuration which results in the fields which give the muon precession measured in each site. Hence, dipolar fields were calculated with different independent alignments of the AF moments of the two chains, residing in the plane. The simulation also probed different IC helical modulations, that is the magnetic moment size at the unit cell is
| (8) |
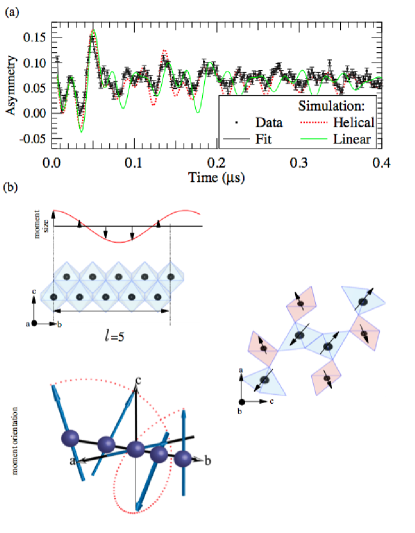
where is the propagation vector along and is the V moment size, which is the only free parameter, and is given in Ref.jun1 ; nozaki . We average over degenerate states obtained by the simulation in order to accurately describe this model. We use criteria as a crude guide in selecting the potential realized state. For comparison, we also performed the same calculation for a linear IC spin density wave, which is proposed by neutron measurementsnozaki . However, as seen in Table I, for a linear IC-SDW model was always higher than a helical-modulated setup. Figure 6(a) displays the experimental ZF-spectrum of NVO taken at K with the simulated spectrum assuming both the helical and linear configuration.
We find that the best fit to the experimental data is, thus, a configuration with an helical IC modulation along axis. Table 1 summarizes the simulation results and shows the propagation vector versus and the goodness-of-fit to the K experimental data of these compounds. The value of NVO is found to be very consistent with that obtained by the recent neutron experimentnozaki , namely, the modulation period is along the -axis. However, the powder neutron diffraction result does not suggests a helical IC order but rather a linear IC-SDW order in NVO. The reason for this discrepancy is not clear. We speculate that the since the neutron result was obtained from powder samples through the Rietveld analyses, and the result published may be that of a local minima. Secondly, it might be that the dipolar field alone, which do not take into account crystal fields might not be fully appropriate to describe such a subtle magnetic state. In fact, a helical IC ordered state is more reasonable in explaining the coexistence of the AF order and metallic conductivity below for NVO. Hence, SR is found to play a significant role to determine the AF structure in NCVO. In Fig. 6(b), we plot the corresponding magnetic structure suggested by the SR simulation.
IV.2 Phase diagram
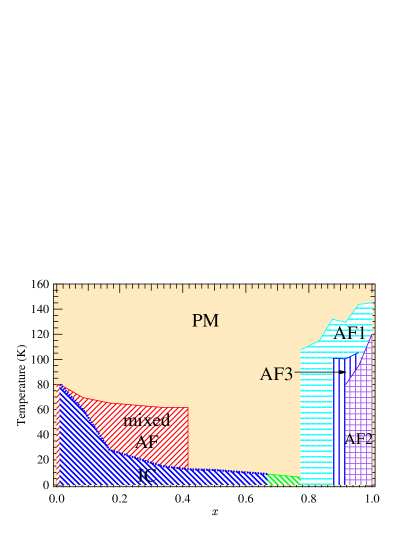
To summarize the muSR measurements of NCVO carried out in the present work, we propose in Fig. 7 the complete phase diagram as a function of x. In particular, the IC-AF phase with its wide field distribution, is present at low temperature of . Interestingly, (above the IC phase), the compounds show a mixture of CVO and the compound by the TF measurements (shown as mixed-AF in Fig. 7), but such mixture behavior is absent in the ZF data, in which only the IC phase is identified. The metallic phase, , is characterized by numerous AF phases. AF1 indicates the AF order identified by a single frequency, found below for and at higher temperatures for . AF2 and AF3 describes the low temperature AF order characterized by 4 frequencies occurring in the . We therefore updated the previously published phase diagramjun1 with the introduction of , identified the IC phase at , as well as the new data on shed additional light on the multiple AF phases.
V Summary
In summary, SR measurements on the NaxCa1-xV2O4 family reveal a diverse number of magnetic phases for different . Compounds in the insulating phase, , indicate a single muon site, data analyses identifies an incommensurate spin density wave phase. Whereas in the metallic phase, at high Na concentrations, , data suggests several muon sites. Numerical simulations verifies 4 magnetically distinct muon sites, and validates the existence of an incommensurate helical spin density of the V chain, with a spin-wave propagation vector along axis. Finally, we wish to point out that, although SR is usually thought to be incapable to determine the correlation length of the magnetic order, the present study clearly demonstrates that SR plays a crucial role for clarifying the magnetic structure of NCVO.
Acknowledgements.
We thank the staff of TRIUMF for help with the SR experiments. YI and JS are partially supported by the KEK-MSL Inter-University Program for Oversea Muon Facilities, and JHB is supported at UBC by NSERC of Canada, and (through TRIUMF) by NRC of Canada, KHC by NSERC of Canada and (through TRIUMF) by NRC of Canada, and HS by WPI Initiative on Materials, Nanoarchitronics, MEXT, Japan. This work is also supported by Grant-in-Aid for Scientific Research (B), 19340107, MEXT, Japan.References
- (1) Toshiya Hikihara, Lars Kecke, Tsutomu Momoi and Akira Furusaki, Phys. Rev. B 78, 144404 (2008).
- (2) A. A. Zvyagin and S.-L. Drechsler, Phys. Rev. B 78, 014429 (2008)
- (3) O. Tchernyshyov, Phys. Rev. Lett. 93, 157206 (2004).
- (4) Tamas Varga, John F. Mitchell, Kazunari Yamaura, 1, David G. Mandrus and Jun Wang, Solid State Sciences 11, 694 (2009).
- (5) Junji Akimoto, Junji Awaka, Norihito Kijima, Yasuhiko Takahashi, Yuichi Maruta, Kazuyasu Tokiwa, Tsuneo Watanabe, J. Sol St. Chem., 179, 169 (2006).
- (6) Kazunari Yamaura, Qingzhen Huang, Lianqi Zhang, Kazunori Takada, Yuji Baba, Takuro Nagai, Yoshio Matsui, Kosuke Kosuda, and Eiji Takayama-Muromachi, J. Am. Chem. Soc. 128, 9448 (2006).
- (7) T. Yamauchi, Y. Ueda and N. Mori, Phys. Rev. Lett. 89, 057002 (2002).
- (8) M. Nakamura, A. Sekiyama, H. Namatame, A. Fujimori, H. Yoshihara, T. Ohtani, A. Misu, M. Takano, PRB 49, 16191 (1994).
- (9) Z. Q. Mao, T. He, M. M. Rosario, K. D. Nelson, D. Okuno, B. Ueland, I. G. Deac, P. Schiffer, Y. Liu, and R. J. Cava, PRL 90, 186601 (2003). ?
- (10) K. Yamaura, M. Arai, A. Sato, A. B. Karki, D. P. Young, R. Movshovich, S. Okamoto, D. Mandrus, and E. Takayama-Muromachi, Phys. Rev. Lett. 99, 196601 (2007).
- (11) O. Pieper, B. Lake, A. Daoud-Aladine, M. Reehuis, K. Proke, B. Klemke, K. Kiefer, J. Q. Yan, A. Niazi, D. C. Johnston, and A. Honecker, Phys. Rev. B 79, 180409(R) (2009).
- (12) Z. Zhang, Despina Louca, A. Visinoiu, and S.-H. Lee, J. D. Thompson, T. Proffen, and A. Llobet, Y. Qiu, S. Park and Y. Ueda, Phys. Rev. B 74, 014108 (2006).
- (13) Jun Sugiyama, Yutaka Ikedo, Tatsuo Goko, Eduardo J. Ansaldo, Jess H. Brewer, Peter L. Russo, Kim H. Chow, and Hiroya Sakurai, Phys. Rev. B 78, 224406 (2008).
- (14) Hiroshi Nozaki, Jun Sugiyama, Martin Månsson, Masashi Harada, Vladimir Pomjakushin, Vadim Sikolenko, Antonio Cervellino, Bertrand Roessli, and Hiroya Sakurai, Phys. Rev. B 81, 100410(R) (2010).
- (15) Hiroya Sakurai, Phys. Rev. B 78, 094410 (2008).
- (16) http://musr.ca/equip/hold/mvhold.html
- (17) J. Major, J. Mundy, M. Schmolz, A. Seeger, K. -P. Dring, K. Frderer, M. Gladisch, D. Herlach and G. Majer, Hyperfine Interactions 31, 259 (1986); A. Amato, R. Feyerherm, F. N. Gygax, A. Schenck, H. v. Lneysen and H. G. Schlager, Phys. Rev. B 52, 54 (1995); N. Papinutto, M.J. Graf, P. Carretta, A. Rigamonti, M. Giovannini, Physica B 359, 89 (2005).
- (18) G. Grüner, Density Waves in Solids, Addison-Wesley-Longmans, Reading, 1994 (Chapter 4), and references cited therein.
- (19) L. P. Le, G. M. Luke, B. J. Sternlieb, W. D. Wu, Y. J. Uemura, J. H. Brewer, T. M. Riseman, R. V. Upasani, L. Y. Chiang and P. M. Chaikin, Europhys. Lett. 15, 547 (1991).
- (20) Hikaru Takeda, Masayuki Itoh, and Hiroya Sakurai, J. Phys.: Conf. Ser. 200, 012200 (2010).
- (21) D. H. Ryan, J. M. Cadogan, J. van Lierop, Phys. Rev. B 61, 6816 (2000).
- (22) Y. J. Uemura, T. Yamazaki, D. R. Harshman, M. Senba and E. J. Ansaldo, Phys. Rev. B 31, 546 (1985).
- (23) G. M. Kalvius, D. R. Noakes, and O. Hartmann, Handbook on the Physics and Chemistry of Rare Earths edited by K. A. Gschneidner Jr., L. Eyring, and G. H. Lander, (North-Holland, Amsterdam, 2001) vol. 32, chap. 206.
- (24) T. Ishida, S. Ohira, T. Ise, K. Nakayama, I. Watanabe, T. Nogami and K. Nagamine, Chem. Phys. Lett. 330, 110 (2000).
- (25) A. Zorko, M. Pregelj, H. Berger and D. Arcon, J. of Appl. Phys. 107, 09D906 (2010).
- (26) Jun Sugiyama, Yutaka Ikedo, Peter L. Russo, Hiroshi Nozaki, Kazuhiko Mukai, Daniel Andreica, Alex Amato, Maxime Blangero, and Claude Delmas, Phys. Rev. B 76, 104412 (2007).
- (27) The unit cell was electostatically mapped using the formal charge states for each of the ions in the unit cell. The result indicates 4 inequivalent magnetic sites next to O-2 suggesting a formation of a -O covalent bond.