Uncovering the Dominant Scatterer in Graphene Sheets on SiO2
Abstract
We have measured the impact of atomic hydrogen adsorption on the electronic transport properties of graphene sheets as a function of hydrogen coverage and initial, pre-hydrogenation field-effect mobility. Our results are compatible with hydrogen adsorbates inducing intervalley mixing by exerting a short-range scattering potential. The saturation coverages for different devices are found to be proportional to their initial mobility, indicating that the number of native scatterers is proportional to the saturation coverage of hydrogen. By extrapolating this proportionality, we show that the field-effect mobility can reach cm2/V sec in the absence of the hydrogen-adsorbing sites. This affinity to hydrogen is the signature of the most dominant type of native scatterers in graphene-based field-effect transistors on SiO2.
Freely suspended graphene sheets display high field-effect mobility, reaching cm2/V sec.Bolotin et al. (2008a, b) High mobilities allows for a wider utilization of graphene sheets in testing relativistic quantum mechanics, exploring two-dimensional physics, and creating new electronic, optoelectronic, and spintronic device technologies.Neto et al. (2009); Geim (2009); Geim and Novoselov (2007) Yet, suspended graphene sheets are fragile and impractical for most experiments and applications. Substrate-bound graphene sheets are easier to handle but possess low carrier mobilities, which can even vary by an order of magnitude from sample to sample. Poor and unpredictable transport properties reduce the utility of substrate-bound graphene sheets for both fundamental and applied sciences. Therefore, understanding the impact of substrates is crucial for graphene science and technology.
Charged impurities,Adam et al. (2007); Ando (2006) ripples,Katsnelson and Geim (2008) and resonant scatterers Ostrovsky et al. (2006); Stauber et al. (2007); Titov et al. (2010); Wehling et al. (2009) have been considered for modeling the transport property of graphene field-effect transistors (FETs). Previous experimental studies have explored the impact of charged impurities Chen et al. (2008) and resonant scatterers Chen et al. (2009); Bostwick et al. (2009); Elias et al. (2009); Ni et al. (2010) by using adsorbed impurities or creating vacancies on graphene sheets. Yet, these studies revealed only the impact of adsorbates or vacancies and did not shed information on the nature of the native scatterers already present in the samples. Furthermore, experiments using different dielectric environments have provided contradictory results on the role and importance of charged impurities.Ponomarenko et al. (2009); Jang et al. (2008) Thus, there are no conclusive experimental results revealing the nature of the native scatterers that limit the transport properties of graphene on SiO2.
We have measured the impact of low-energy atomic hydrogen on the transport properties of graphene as a function of coverage and the initial field-effect mobility. Our transport and Raman spectroscopy measurements show that hydrogen exerts a short-range scattering potential which introduces intervalley scattering. Hydrogen transfers a small but finite amount of charge, as indicated by the gate-dependent transport measurements. The resistivity added by hydrogen remains proportional to the number of adsorbed hydrogen and, therefore, adheres to Matthiessen’s rule even at the highest coverage. This shows that adsorbed hydrogen remains rather dilute and does not interfere with other pre-existing scattering mechanisms. The added resistivity at high carrier densities varies approximately as , where is the carrier density and . Importantly, the saturation coverage of atomic hydrogen is found to be proportional to the inverse initial mobility and, therefore, to the number of pre-existing scattering sites. Finally, our results show that the reactivity to atomic hydrogen is a characteristic manifestation of the most dominant scatterer in graphene sheets on SiO2.
The graphene FETs in our measurements are prepared using the conventional method.111Graphene is obtained from Kish graphite by mechanical exfoliation Novoselov et al. (2005) on 280 nm SiO2 over doped Si, which is used as the back gate. Raman spectroscopy is used to confirm that the samples are single layer graphene.Ferrari et al. (2006) Au/Cr electrodes, defined by electron-beam lithography, contact the graphene sheets. The devices are annealed in H2/Ar at 300 oC for 1 hour to remove resist residues.Ishigami et al. (2007). Each device is annealed in ultra-high vacuum at 490 K for longer than 8 hours to eliminate any residual adsorbates prior to hydrogen dosing experiments. Transport properties are measured using the four-probe method.222The voltage probes were placed on graphene areas measuring (length width) 5.0 m6.4m (sample A), 0.74 m0.31m (sample B), and 7.8 m8.2 m (sample C). The initial, pre-hydrogenation mobility ranged from 1900 to 8300 cm2/V sec for different graphene devices. Each device is hydrogenated at constant temperature between K.333Dosing is done at a constant temperature, which varied between different devices. We use a commercial atomic hydrogen cracker, EFM H from Omicron GmBH, which utilizes a tungsten capillary heated to 2500 K by an electron beam. The cracker also generates high energy ions which are steered away from graphene using an electric deflector. The dosage rate of atomic hydrogen 444The dosage rate is estimated from the angular distribution of atomic hydrogen provided by the manufacturer. is maintained constant throughout the measurements using a variable leak valve. The total dosage or accumulated areal dose density can be very different from the actual hydrogen coverage depending on the sticking coefficient. Transport properties are measured at increasing dosages.
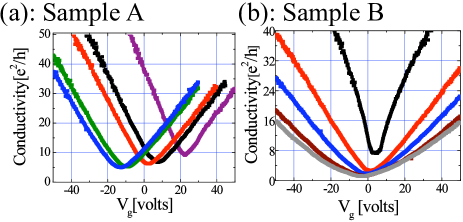
Figure 1 shows the impact of atomic hydrogen adsorption on the conductivity of graphene sheets. The changes induced by hydrogen adsorption saturate above a certain dosage. These changes are: (i) a shift in the gate voltage at which the conductivity is minimal (), (ii) an increase in the intensity of the D peak in the Raman spectra, (iii) a monotonic decrease of the conductivity minimum, and (iv) an additional gate-dependent resistivity which varies as where at large . The gate dependence of the conductivity becomes superlinear at high dosage levels as a result of this exponent. Below, we discuss each change in more detail.
A finite charge is donated to graphene by the adsorbed hydrogen, as indicated by the shift of upon hydrogenation. The observed sign of the charge transfer from atomic hydrogen to carbon is consistent with a previous experiment Ryu et al. (2008) and theoretical calculations,Zhu et al. (2005); Carneiro and Capaz (private communication) but different from hydrogenation studies using atomic hydrogen derived from a hydrogen plasma.Elias et al. (2009); Ni et al. (2010) It is not possible to determine the amount of charge transferred per adsorbed hydrogen directly from our experiment, as the sticking coefficient of hydrogen on graphene is unknown. Previous experiments Ryu et al. (2008); Elias et al. (2009); Ni et al. (2010) do not agree on the amount of charge transfer from hydrogen. Theoretical studies show 0.076 to 0.161 Carneiro and Capaz (private communication) or 0.16 to 0.25 Zhu et al. (2005) donated per hydrogen ( denotes the electron charge), depending on the degree of allowed lattice relaxation Carneiro and Capaz (private communication) or the position of hydrogen.Zhu et al. (2005) Below, these calculated values are used to estimate the saturation coverage of hydrogen.
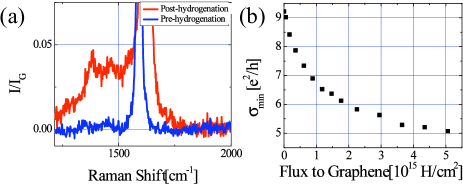
Raman spectroscopy and the impact of atomic hydrogen on the minimum conductivity reveal that atomic hydrogen introduces intervalley scattering and, therefore, exerts a short-range scattering potential.Malard et al. (2009) Figure 2a shows Raman spectra acquired at room temperature in air both before hydrogen dosing and after achieving saturation at low temperature. The intensity of the D peak in the Raman spectrum is larger upon adsorbing hydrogen. The relative intensity of the D peak to the G peak, , which can be used to estimate the adsorbed hydrogen density,Lucchese et al. (2010); Cancado et al. (2006); Sato et al. (2006) is 0.00340.0021 and 0.01820.0056 before and after hydrogen adsorption, respectively.555Multiple Lorentzian peaks near 1250, 1350, and 1450 cm were fitted to the experimental data to determine the peak height. The small values observed for this D-G ratio even at saturation are likely due to the small desorption barrier for hydrogen, as discussed below. Figure 2b shows that the minimum conductivity decreases monotonically as a function of hydrogen dosage. The minimum conductivity at saturation ranges from 0.52 to 5.1 for different devices. Since long-range scatterers have been found to vary the minimum conductivity non-monotonically and not below 4 ,Adam et al. (2007); Chen et al. (2008) our transport measurements are also consistent with hydrogen exerting a short-range scattering potential.
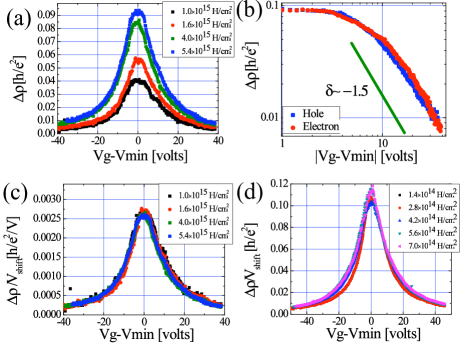
Figure 3a shows the added resistivity due to atomic hydrogen at different dosage levels as a function of . The impact of atomic hydrogen is nearly electron-hole symmetric and the added resistivity varies approximately as at large for all samples, as shown in Fig. 3b. The resistivity exponent differs from the -1 value expected for Coulomb impurities Adam et al. (2007); Chen et al. (2008) and the electron-hole symmetry is consistent with a resonant scatterer positioned very close to the Fermi level (i.e. a mid-gap resonant state).Peres et al. (2006) The observed exponent also agrees with calculated exponents for resonant scatterers with a finite on-site amplitude Mucciolo and Peres (unpublished) as well as for Gaussian-correlated scatterers.Adam et al. (2009),666Previous calculations Stauber et al. (2007); Titov et al. (2010); Wehling et al. (2010) using resonant scatterers with infinite on-site energy yield a resistivity exponent less or equal to -1. As shown in Fig. 3c, we find that the curves of added resistivity versus gate voltage for successive dosage levels collapse on top of each other when divided by the induced shift in , , indicating that the added resistivity at different dosage levels is proportional to . Therefore, the number of adsorbed hydrogen atoms is directly proportional to . For long-range scatterers such as potassium adsorbates,Chen et al. (2008) does not vary linearly with the number of adsorbates. Such non-linearity has been attributed to incomplete screening of the potential imposed by potassium on graphene.Adam et al. (2007) Therefore, we conclude that the excess charge of adsorbed atomic hydrogen is effectively screened by graphene. All samples we have measured show a similar behavior (for instance, see Fig. 3d for sample B). Deviations from the observed normalization by are found only at low dosages and can be attributed to uncertainty in determining at low dosage. The observed normalization also shows that the scattering cross section of hydrogen does not vary appreciably even at higher dosage levels and that hydrogen does not modify other scattering mechanisms. Therefore, the added resistivity by hydrogen follows Matthiessen’s rule, , where and are due to scattering by adsorbates and the substrate, respectively, and is the intrinsic resistance of the graphene sheet.
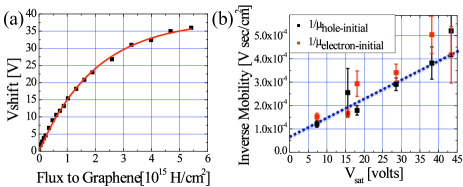
Figure 4a shows , which is proportional to the number of adsorbed hydrogen, as a function of the accumulated hydrogen dosage. The behavior is well described by a saturating exponential function, with a saturation voltage denoted . A wide range of is observed for different samples, from 7.34 to 43.4 volts. The maximum shift of 43.4 volts implies that the observed maximum coverage of hydrogen is 0.012 assuming the predicted charge transfer Carneiro and Capaz (private communication) of 0.076 per adsorbed hydrogen. We find no correlation between experimental temperatures and saturation voltages. Figure 4b shows that the saturation coverage for different samples is inversely proportional to their initial maximum electron and hole field-effect mobility. 777, where is field effect mobility and is capacitance per unit area, was used to calculate the gate-dependent mobility. Since the inverse mobility is proportional to the number of scatterers, our data show that the number of native scatterers is proportional to the number of possible adsorption sites for hydrogen. By extrapolation to the limit where these sites are absent, we obtain a mobility of cm2/V sec, as determined by a linear fit. This extrapolated mobility value is still an order of magnitude lower than the field-effect mobility measured for suspended graphene sheets,Bolotin et al. (2008a, b) showing that there are still other, less important, scatterers reducing the mobility of graphene on SiO2. Interestingly, the extrapolated value is similar to the maximum mobility observed on SiO2 in previous studies Morozov et al. (2008); Tan et al. (2007) suggesting that the reactivity to hydrogen is the signature of the most dominant type of native scatterers for all graphene devices on SiO2.
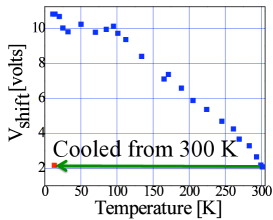
induced by the adsorbed hydrogen is reduced as the temperature is raised, as shown in Fig. 5. The value of remains constant when warmed samples are again cooled, indicating that the observed reduction in is due to the desorption of hydrogen. This temperature dependence indicates that the desorption energy of adsorbed hydrogen on graphene is much smaller than the previously reported values of approximately 1 eV on graphite.Zecho et al. (2002) A small desorption energy explains the small D peak observed in the Raman spectra of the hydrogen-dosed samples acquired at room temperature and suggests that atomic hydrogen is not forming a fully relaxed covalent bond to carbon. Furthermore, we also know that the maximum thermal energy of impinging atomic hydrogen barely exceeds the barrier of 0.21 eV calculated for the attachment of atomic hydrogen to planer graphite.Kerwin and Jackson (2008) Therefore, atomic hydrogen is binding only to unusual, chemically-activated sites, which do not relax to a full sp3 configuration upon adsorbing hydrogen.
It is possible that the reactivity of graphene sheets is enhanced by adding curvature or changing the Fermi level. Wrinkles Guinea et al. (2009); Pereira et al. (2010) and ripplesKatsnelson and Geim (2008) can perturb the sp2 bonds, generating chemically-activated sites for hydrogen. Charge puddles Adam et al. (2007) may also increase the reactivity of graphene sheets. However, the data presented in this paper cannot determine the sites with affinity to atomic hydrogen in graphene on SiO2. Atomically-resolved microscopy on hydrogenated graphene devices can reveal the exact mechanism for the enhancement of the reactivity, correlated to the most dominant scatterer in graphene on SiO2. These studies are being presently carried out.
In conclusion, we used atomic hydrogen to probe the nature of native scatterers in graphene. Hydrogen exerts short-range scattering potential in graphene, as indicated by Raman spectroscopy and the impact on the minimum conductivity. Charge is transferred from hydrogen to carbon and the Coulomb potential created by the induced charge on hydrogen is effectively screened by carriers in graphene. The adherence of the added resistivity to Matthiessen’s rule also shows that: (1) adsorbates do not influence the resistivity caused by other factors (such as lattice defects, phonons, etc.) and (2) the number of adsorbed hydrogen, , is proportional to . Finally, the number of hydrogen adsorption sites is found to correspond to the number of native scatterers; in the absence of these scatterers, the carrier mobility of graphene sheets will reach cm2/V sec. The scatterers uncovered in this study dominate the transport properties of graphene-based FETs on SiO2 and the affinity to atomic hydrogen is the hallmark of these scatterers. Our results provide an important insight into the nature of the scatterers which limit mobility of graphene sheets on substrates.
This work is based upon research supported by the National Science Foundation under Grant No. 0955625. MI thanks Enrique del Barco and Simranjeet Singh for collaboration in developing the graphene device fabrication procedure at UCF and providing access to photolithography and electron beam evaporator facilities. EM thanks Rodrigo Capaz, Vitor Pereira, and Nuno Peres for fruitful discussions.
References
- Bolotin et al. (2008a) K. I. Bolotin et al., Solid State Comm. 146, 351 (2008a).
- Bolotin et al. (2008b) K. I. Bolotin et al., Phys. Rev. Lett. 101, 096802 (2008b).
- Neto et al. (2009) A. C. Neto et al., Rev. Mod. Phys. 81, 109 (2009).
- Geim (2009) A. K. Geim, Science 324, 1530 (2009).
- Geim and Novoselov (2007) A. K. Geim and K. S. Novoselov, Nature Mat. 6, 183 (2007).
- Adam et al. (2007) S. Adam et al., Proc. Natl. Acad. Sci. USA 104, 18392 (2007).
- Ando (2006) T. Ando, J. Phys. Soc. Jap. 75, 074716 (2006).
- Katsnelson and Geim (2008) M. I. Katsnelson and A. K. Geim, Phil. Trans. R. Soc. A 366, 195 (2008).
- Ostrovsky et al. (2006) P. M. Ostrovsky, I. V. Gornyi, and A. D. Mirlin, Phys. Rev. B 74, 235443 (2006).
- Stauber et al. (2007) T. Stauber, N. M. R. Peres, and F. Guinea, Phys. Rev. B 76, 205423 (2007).
- Titov et al. (2010) M. Titov et al., Phys. Rev. Lett. 104, 076802 (2010).
- Wehling et al. (2009) T. O. Wehling, M. I. Katsnelson, and A. I. Lichtenstein, Phys. Rev. B 80, 085428 (2009).
- Chen et al. (2008) J. H. Chen et al., Nature Phys. 4, 377 (2008).
- Chen et al. (2009) J. H. Chen et al., Phys. Rev. Lett. 102, 236805 (2009).
- Bostwick et al. (2009) A. Bostwick et al., Phys. Rev. Lett. 103, 056404 (2009).
- Elias et al. (2009) D. C. Elias et al., Science 323, 610 (2009).
- Ni et al. (2010) Z. H. Ni et al., arXiV:1003.0202 (2010).
- Ponomarenko et al. (2009) L. A. Ponomarenko et al., Phys. Rev. Lett. 102, 206603 (2009).
- Jang et al. (2008) C. Jang et al., Phys. Rev. Lett. 101, 146805 (2008).
- Ryu et al. (2008) S. Ryu et al., Nano Lett. 8, 4597 (2008).
- Zhu et al. (2005) Z. H. Zhu, G. Q. Lu, and F. Y. Wang, J. Phys. Chem. B 109, 7923 (2005).
- Carneiro and Capaz (private communication) M. A. Carneiro and R. B. Capaz (private communication).
- Malard et al. (2009) L. M. Malard et al., Phys. Rep. 437, 51 (2009).
- Lucchese et al. (2010) M. M. Lucchese et al., Carbon 48, 1592 (2010).
- Cancado et al. (2006) L. G. Cancado et al., Appl. Phys. Lett. 88, 163106 (2006).
- Sato et al. (2006) K. Sato et al., Chem. Phys. Lett. 427, 117 (2006).
- Peres et al. (2006) N. M. R. Peres, F. Guinea, and A. H. C. Neto, Phys. Rev. B 73, 125411 (2006).
- Mucciolo and Peres (unpublished) E. R. Mucciolo and N. M. R. Peres (unpublished).
- Adam et al. (2009) S. Adam, P. W. Brouwer, and S. D. Sarma, Phys. Rev. B 79, 201404 (2009).
- Morozov et al. (2008) S. V. Morozov et al., Phys. Rev. Lett. 100, 016602 (2008).
- Tan et al. (2007) Y. W. Tan et al., Phys. Rev. Lett. 99, 246803 (2007).
- Zecho et al. (2002) T. Zecho et al., J. Chem. Phys. 117, 8486 (2002).
- Kerwin and Jackson (2008) J. Kerwin and B. Jackson, J. Chem. Phys. 128, 084702 (2008).
- Guinea et al. (2009) F. Guinea, B. Horovitz, and P. L. Doussal, Solid State Comm. 149, 1140 (2009).
- Pereira et al. (2010) V. M. Pereira et al., arXiv:1004.5384 (2010).
- Novoselov et al. (2005) K. S. Novoselov et al., Proc. Natl. Acad. Sci. U. S. A. 102, 10451 (2005).
- Ferrari et al. (2006) A. C. Ferrari et al., Phys. Rev. Lett. 97, 187401 (2006).
- Ishigami et al. (2007) M. Ishigami et al., Nano Lett. 7, 1643 (2007).
- Wehling et al. (2010) T. O. Wehling et al., arXiv:1003.0609 (2010).