Bilayer membranes in micro-fluidics: from gel emulsions to soft functional devices
Abstract
We outline a concept of self-assembled soft matter devices based on micro-fluidics, which use surfactant bilayer membranes as their main building blocks, arrested in geometric structures provided by top-down lithography. Membranes form spontaneously when suitable water-in-oil emulsions are forced into micro-fluidic channels at high dispersed-phase volume fractions. They turn out to be remarkably stable even when pumped through the micro-fluidic channel system. Their geometric arrangement is self-assembling, driven by interfacial energy and wetting forces. The ordered membrane arrays thus emerging can be loaded with amphiphilic functional molecules, ion channels, or just be used as they are, exploiting their peculiar physical properties. For wet electronic circuitry, the aqueous droplets then serve as the ’solder points’. Furthermore, the membranes can serve as well-controlled coupling media between chemical processes taking place in adjacent droplets. This is shown for the well-known Belousov-Zhabotinski reaction. Suitable channel geometries can be used to (re-) arrange the droplets, and thereby their contents, in a controlled way by just moving the emulsion through the device. It thereby appears feasible to construct complex devices out of molecular-size components in a self-assembled, but well controlled manner.
I Introduction
The miniaturization of technical components and machines has been one of the most powerful motors of advancement in both science and technology for the past four decades. Feature sizes in modern electronic circuits have come down to the scale of 45 nanometers, and single transistors are meanwhile routinely made smaller than 100 nm [1]. As a consequence, the density of components placed on micro-chips has seen a roughly exponential increase over many years. This development, which for its practical robustness has received the colloquial term ’Moore’s law’, is at the heart of, e.g., the enormous recent increase of widely available computer power [2]. All this has been reached by means of ’top-down’ lithographic techniques, which are capable of structuring solid state materials into arbitrary shapes with amazing accuracy by sophisticated lithographic procedures.
However, it is clear that there will soon be an end to this development of ever smaller structuring. Well before the structures come of molecular size ( nm), interfacial diffusion will lead to their rapid destruction. Other transport processes directly linked to the function of the device, such as electro-migration in electronic chips, are even much more effective. Since the lithographic approach necessarily leads to a structure which is very far from thermal equilibrium, this must be seen as a fundamental problem to the top-down concept. The large interfacial energy stored in these systems directly drives transport phenomena which are likely to lead to their destruction. Building devices with feature sizes even close to molecular scales therefore appears prohibitively difficult in a top-down approach. Any successful concept for exploiting the full scale down to molecular sizes would have to master the balancing act of stepping far enough out of equilibrium to make sustained dynamical functions possible, but staying close enough to equilibrium to avoid the destructive force of large gradients in free energy.
Yet we know that such systems exist abundantly on earth: all living matter has dynamic functional units on a hierarchy of length scales, down to molecular size. This has been possible only because evolution has used more than three billion years of genotype experience to master the key task posed above on the phenotype level. The building blocks, chiefly lipids, proteins, and nucleic acids, are designed such that they either self-assemble into the desired structure or function, or can be assembled at expense of only small amounts of free energy, such as in the case of chaperonins assembling the ’correct’ tertiary structure of proteins [3]. At the same time, chemical energy supply keeps the system sufficiently far off equilibrium to give rise to complex dynamic function, and to maintain structural components as traits of non-equilibrium steady states [4]. If we are to build devices with building blocks of molecular size, it therefore appears advisable to follow a similar path exploiting the self-assembly concept [6, 7, 5, 8].
It suggests itself to use components similar to those which have been so successfully ’tested’ by nature for eons. Soft matter, such as the materials of living systems, is governed by typical interaction energies on the thermal scale (), such that non-trivial functions are possible preferentially at room temperature. It exhibits high molecular mobilities as compared to classical solid state materials, like semiconductors, thus enabling sufficiently rapid self-assembly (and re-assembly) processes. Furthermore, the dispersion interactions dominating the structure and dynamics of soft matter systems are small compared to chemical binding energies. As a consequence, all molecules taking actively part in the functional processes stay intact. This opens an almost unlimited variety of building blocks. Finally, the use of building blocks similar to those of living matter appears particularly promising for devices to be interfaced with living organisms, such as for modern orthotic or prosthetic technology.
However, we cannot rely entirely on self-assembly, since the goal of any design is to reach a certain ’phenotype’, the idea of which is at the start of the whole endeavor. Coding the full complexity of the desired device into the molecular building blocks, such that the desired structure emerges completely out of self-assembly, would require full control of non-equilibrium states out of their microscopic conditions; this is a long-standing and so far unsolved problem. Even if a solution was at hand, the task would be still tremendous, and probably impossible to complete. It will thus be necessary to provide a sufficiently strict pre-selection of configurations which are ’allowed’ to the system for its assembly. A conceptually straightforward implementation of such pre-selection is some solid scaffold, which provides enough of the desired geometry to subtly ’convince’ the soft components to assemble the way one would like them to.
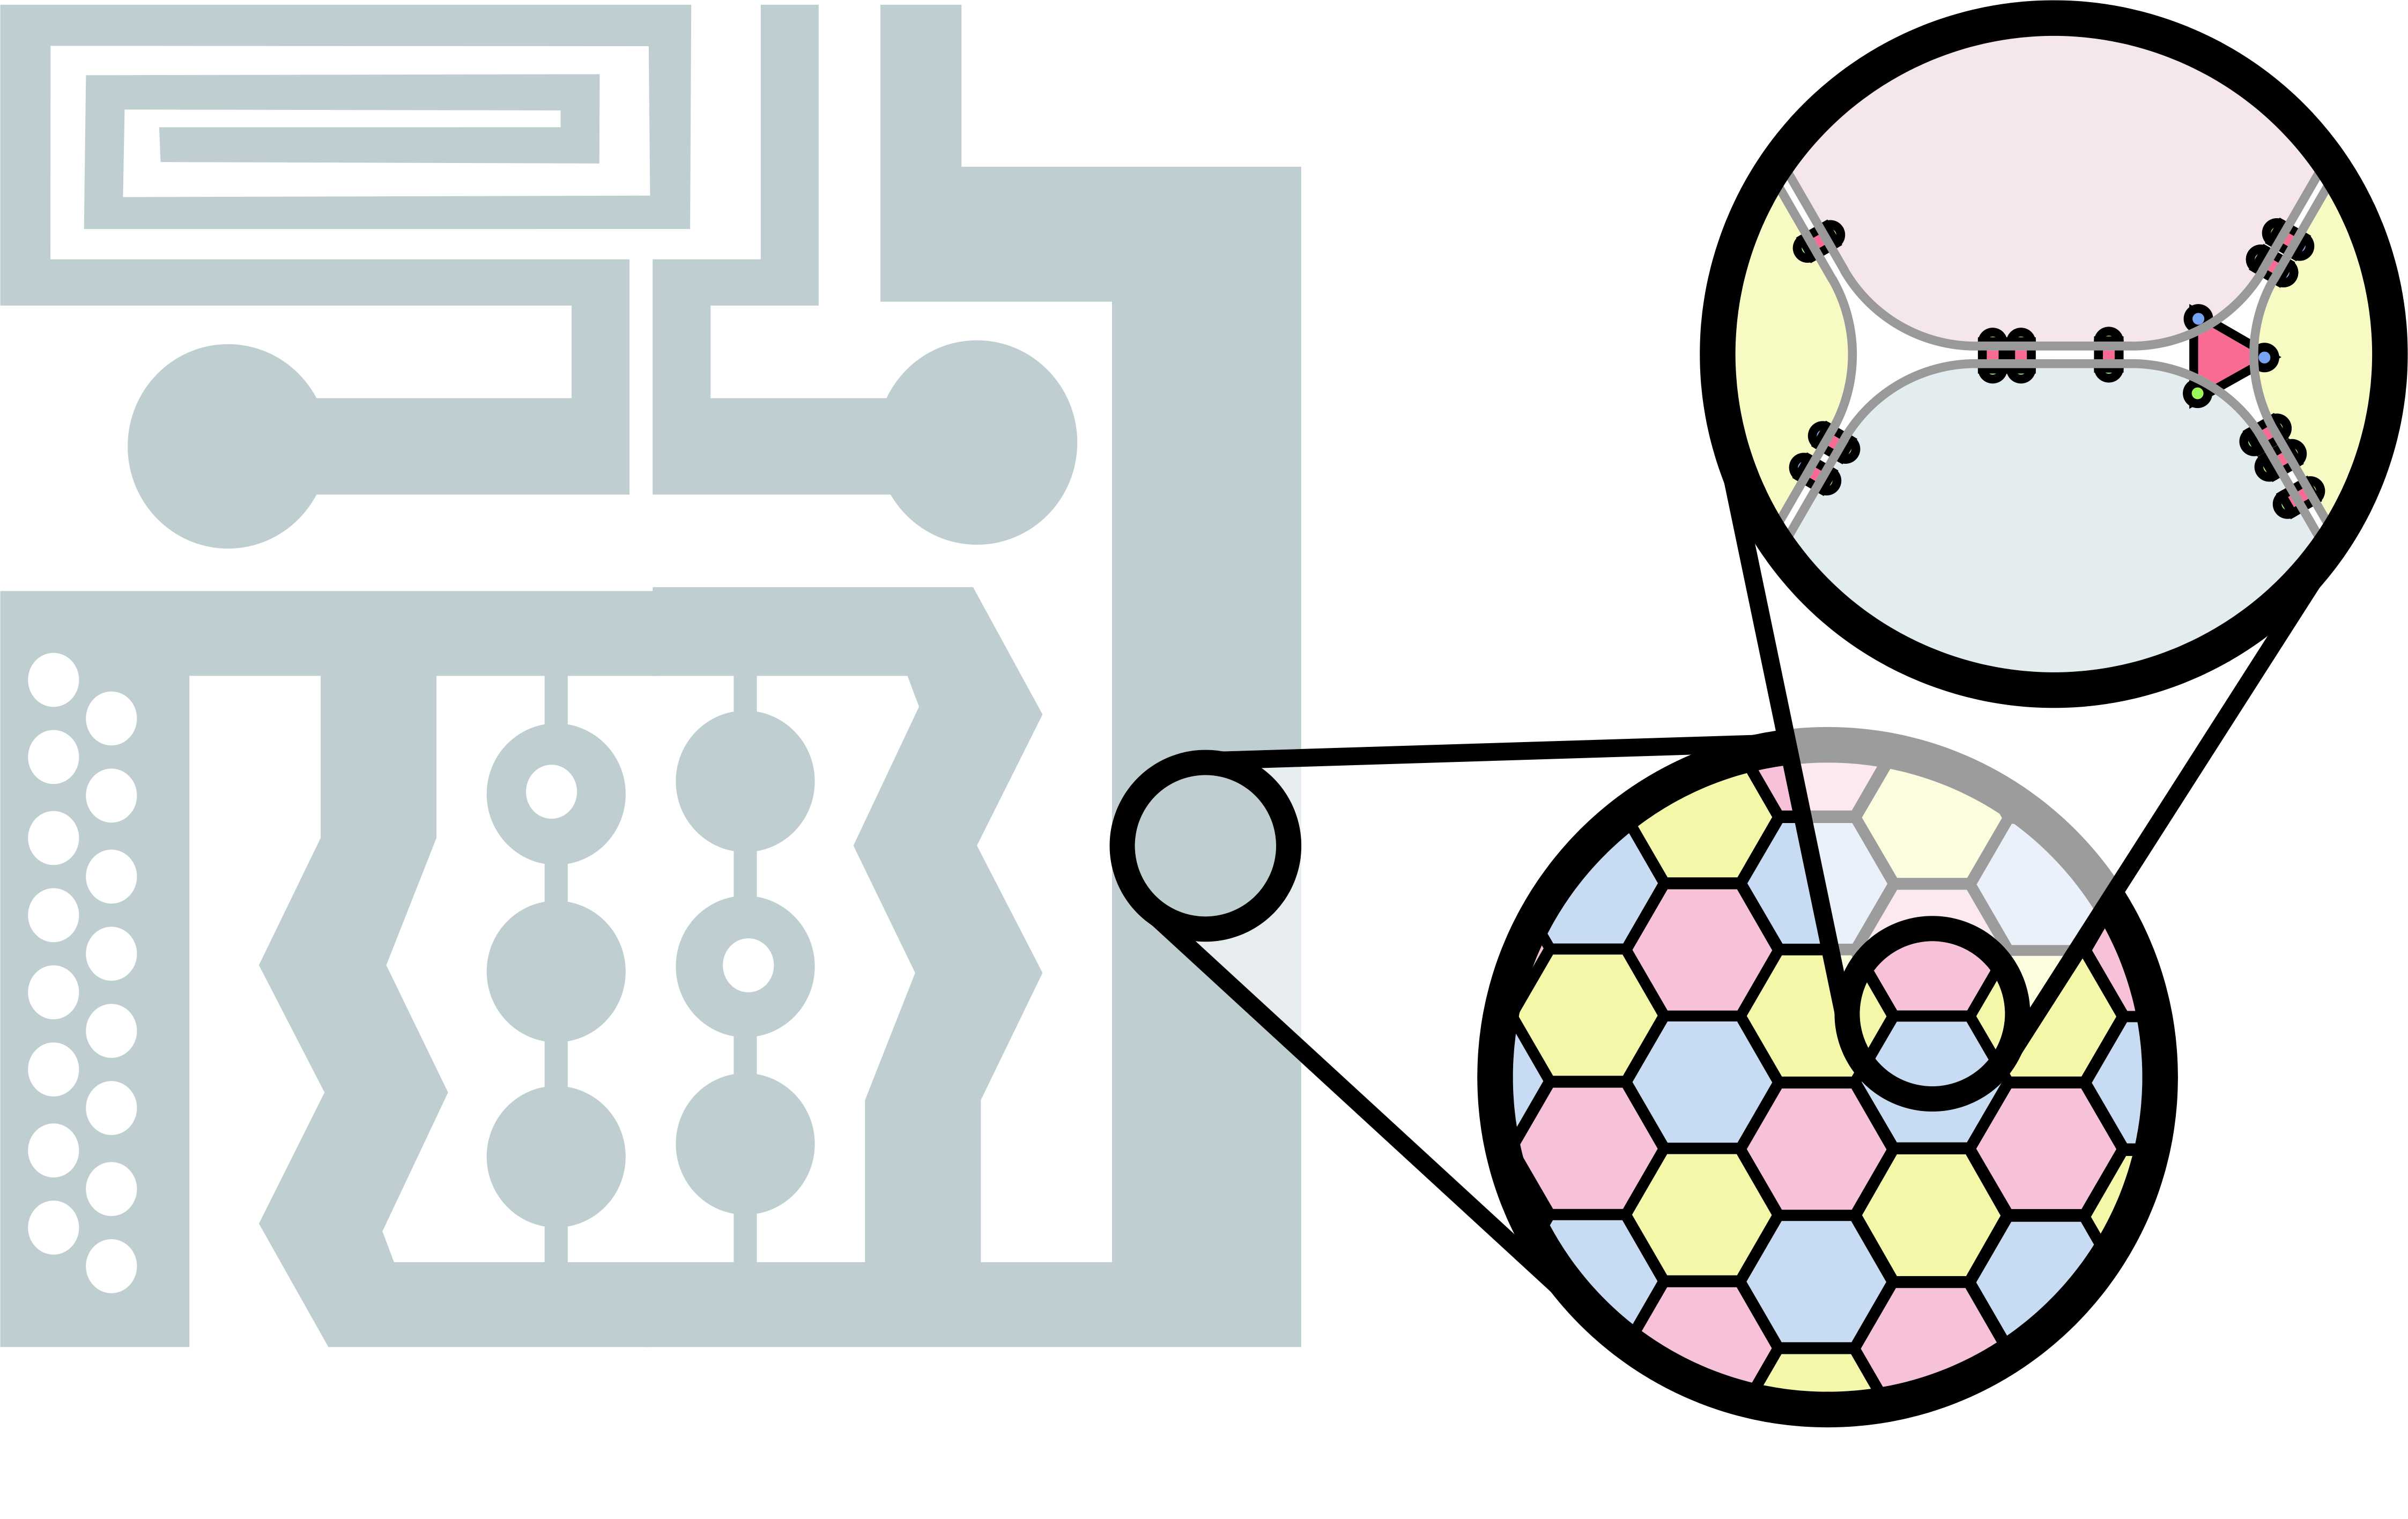
The concept which thus emerges, and on which we will dwell in the present article, is as follows. We create a system of microfluidic channels, compartments, posts, orifices and so on, on length scales which are well manageable by conventional top-down lithography. This system is then filled with soft molecular materials, which self-assemble within the prescribed geometry, forming well-defined structures down to much smaller scales. To be more explicit, we envisage the use of mono-disperse water-in-oil emulsions, with a small volume fraction of the oil phase and a suitable surfactant (e.g., a lipid) for stabilization. This type of emulsions, where the continuous phase is very dilute, are commonly called gel-emulsions [9]. In an externally predefined channel geometry, the water droplets will form well-oriented crystalline arrangements [10, 11]. Under suitable conditions, the interfaces of every two adjacent droplets will form molecular surfactant bilayers. These can serve, by means of dispersion forces and wetting, as nanoscopic tweezers for holding active components, such as ion channels or smaller molecules with non-trivial electronic properties. For molecular electronic circuitry, the water droplets take the role of the ’solder points’.
It is thus inherent to the concept outlined above that we are using self-assembly processes on two completely different scales: the scale of the droplets within the prescribed geometry of the micro-fluidic channel structures, and the nanoscopic scale of the membrane thickness and the functional molecular building blocks. On both scales, self-assembly is then purely driven by wetting forces. As will be discussed below, these forces can not only be used for maintaining certain membrane structures, but also for their controlled manipulation.
Clearly, there will be any gain over conventional ’top-down’ devices only if the self-assembled soft matter structures attain length scales below or so. In the present study, we still keep far away from this scale, in order to facilitate the production and observation of the structures and processes at this very preliminary stage. The present article rather aims at identifying basic mechanisms and conceptional elements which appear promising, but are still to be scaled down considerably. It should be noted, however, that one of the major potential problems of the concept, the instability of emulsions against coalescence, has been found to fade away as size is reduced. Some results pointing in this direction will be briefly discussed.
II formation and stability of membranes in micro-fluidic systems
It has been recognized long ago that for micro-fluidics to unfold its full power, it is advantageous to use two immiscible liquids as the working medium instead of a single liquid phase [13]. Not only can isolated droplets immersed in a continuous liquid be used as compartments for controlled reactions [14], but the complex interplay of the liquid/liquid interface with the channel geometry and hydrodynamic pressure gradients gives rise to an abundance of effects which can be harnessed into the engineering of functional devices. So far, this has been mainly limited to the use of isolated aqueous droplets in an oily continuous phase, as containers for chemical, biochemical, or biological processes. In these devices, the droplets are transported within the channel mainly due to their hydrodynamic drag in the surrounding oil phase. Contact between adjacent droplets was not desired, in an effort to keep droplet coalescence and other cross-talk effects to a minimum.
The situation becomes completely different if the volume fraction of the oil phase is reduced such that droplets maintain mutual contact throughout. The transport of the droplets in the device is then not anymore determined by the streamlines of the oil phase, but by the (dynamically varying) geometry of optimum packing of the droplets within the channel geometry [16, 17]. In fact, the arrangement of spherical droplets has been reported to change from random to crystalline as their volume fraction becomes large. In a square channel with a lateral dimension of about 4 droplet diameters, a volume fraction of 0.75 shows a crystalline order, while a random arrangement is observed at 0.55 [17].
It is clear that this opens up qualitatively new possibilities of droplet manipulation. In particular, the existence of several meta-stable configurations gives rise to strong hysteresis effects in the droplet geometry. Droplet motion may thus not be reversible, and become strongly history dependent. If the droplets are all of the same size, i.e., if a mono-disperse gel emulsion is used, these effects can in principle be exploited to dynamically access a large variety of droplet configurations in the device[10, 11, 12, 20]. Furthermore, these configurations are geometrically rather stable, because the wetting forces determining the angles of contact of the oil lamellae spanning between the droplets, give rise to substantial energy barriers for any spontaneous rearrangement.
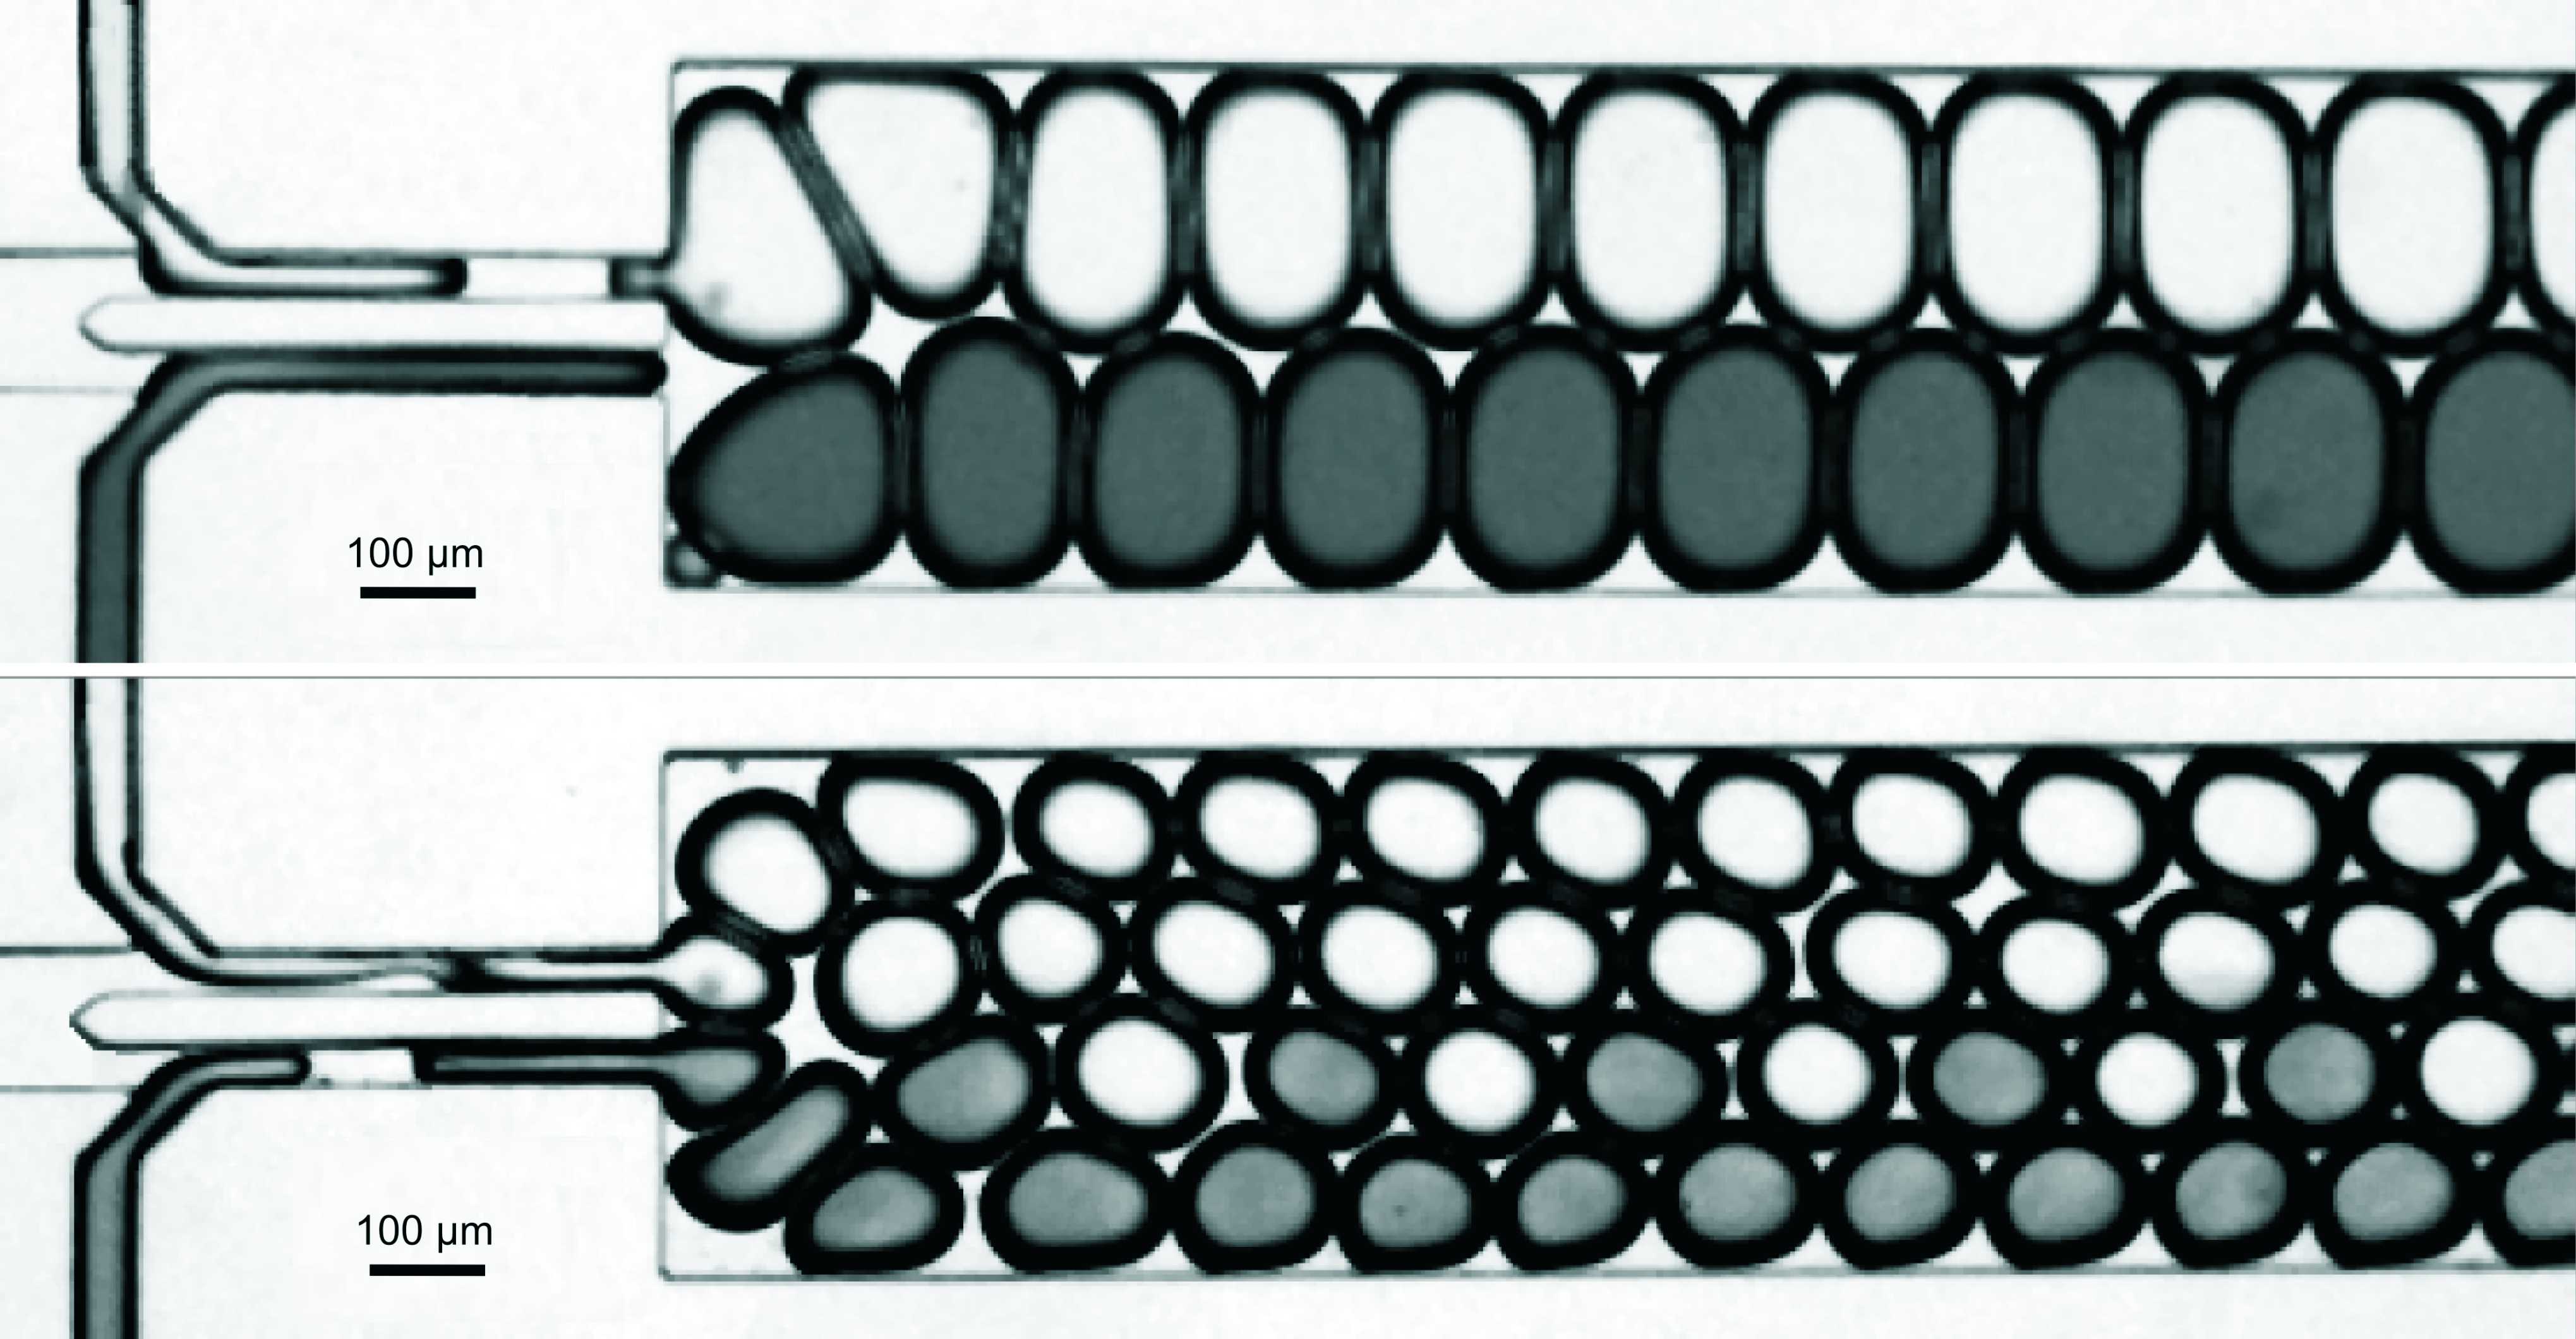
A simple example is displayed in Fig. 2, which shows regular configurations of droplets with different content. The channel structure was formed in poly-dimethyl-siloxane (PDMS, Dow Chemicals) by standard soft lithographic techniques. We used squalane with 15 mg/ml of 1,2-diphytanoyl-sn-glycero-3-phosphocholine (DPhyPC, Avanti Polar Lipids) plus 15 mg/ml of cholesterol as the oil phase, which enters the emulsification unit [23] from the left. For coloring the aqueous phase injected in the lower side channel, we used 2 mM DPhyPC doped with 2 molar % of 1,2-dioleoyl-sn-glycero-3-phosphoethanolamine-N-(carboxy fluorescein) in the upper picture, and 1,2-dipalmitoyl-sn-glycero-3-phosphoethanolamine-N-(lissamine rhodamine B sulfonyl) (both dyes from Avanti Polar Lipids) in the lower picture. The dye lipid was sonicated in the aqueous phase to create liposomes. We see that the droplets form a periodic structure with an ’elementary cell’ withstanding transport along the channel. The relative positions of the droplets within the arrangement are fixed, as is obvious due to the droplet color.
Most of the results discussed here were obtained with channel dimensions on the order of 100 microns or more, for the sake of simplicity of generating the devices and optical transparency. However, we repeated some of the experiments with channels etched in silicon which were much narrower (down to 20 wide). We found that the smaller the droplets and channel dimensions were, the more stable were the membranes. A straightforward explanation is that the Laplace pressure, which scales as the inverse of the droplet radius, sets the energy scale for any disturbance leading to substantial rearrangements of deformations of membranes, and thus potentially to coalescence. Extrapolating this general trend, further down-scaling is expected to yield emulsion structures which are even much more stable. It should be noted that the formation of stable, mono-disperse emulsions with droplet diameters of 50 nm or less is routinely possible by suitable methods [18].
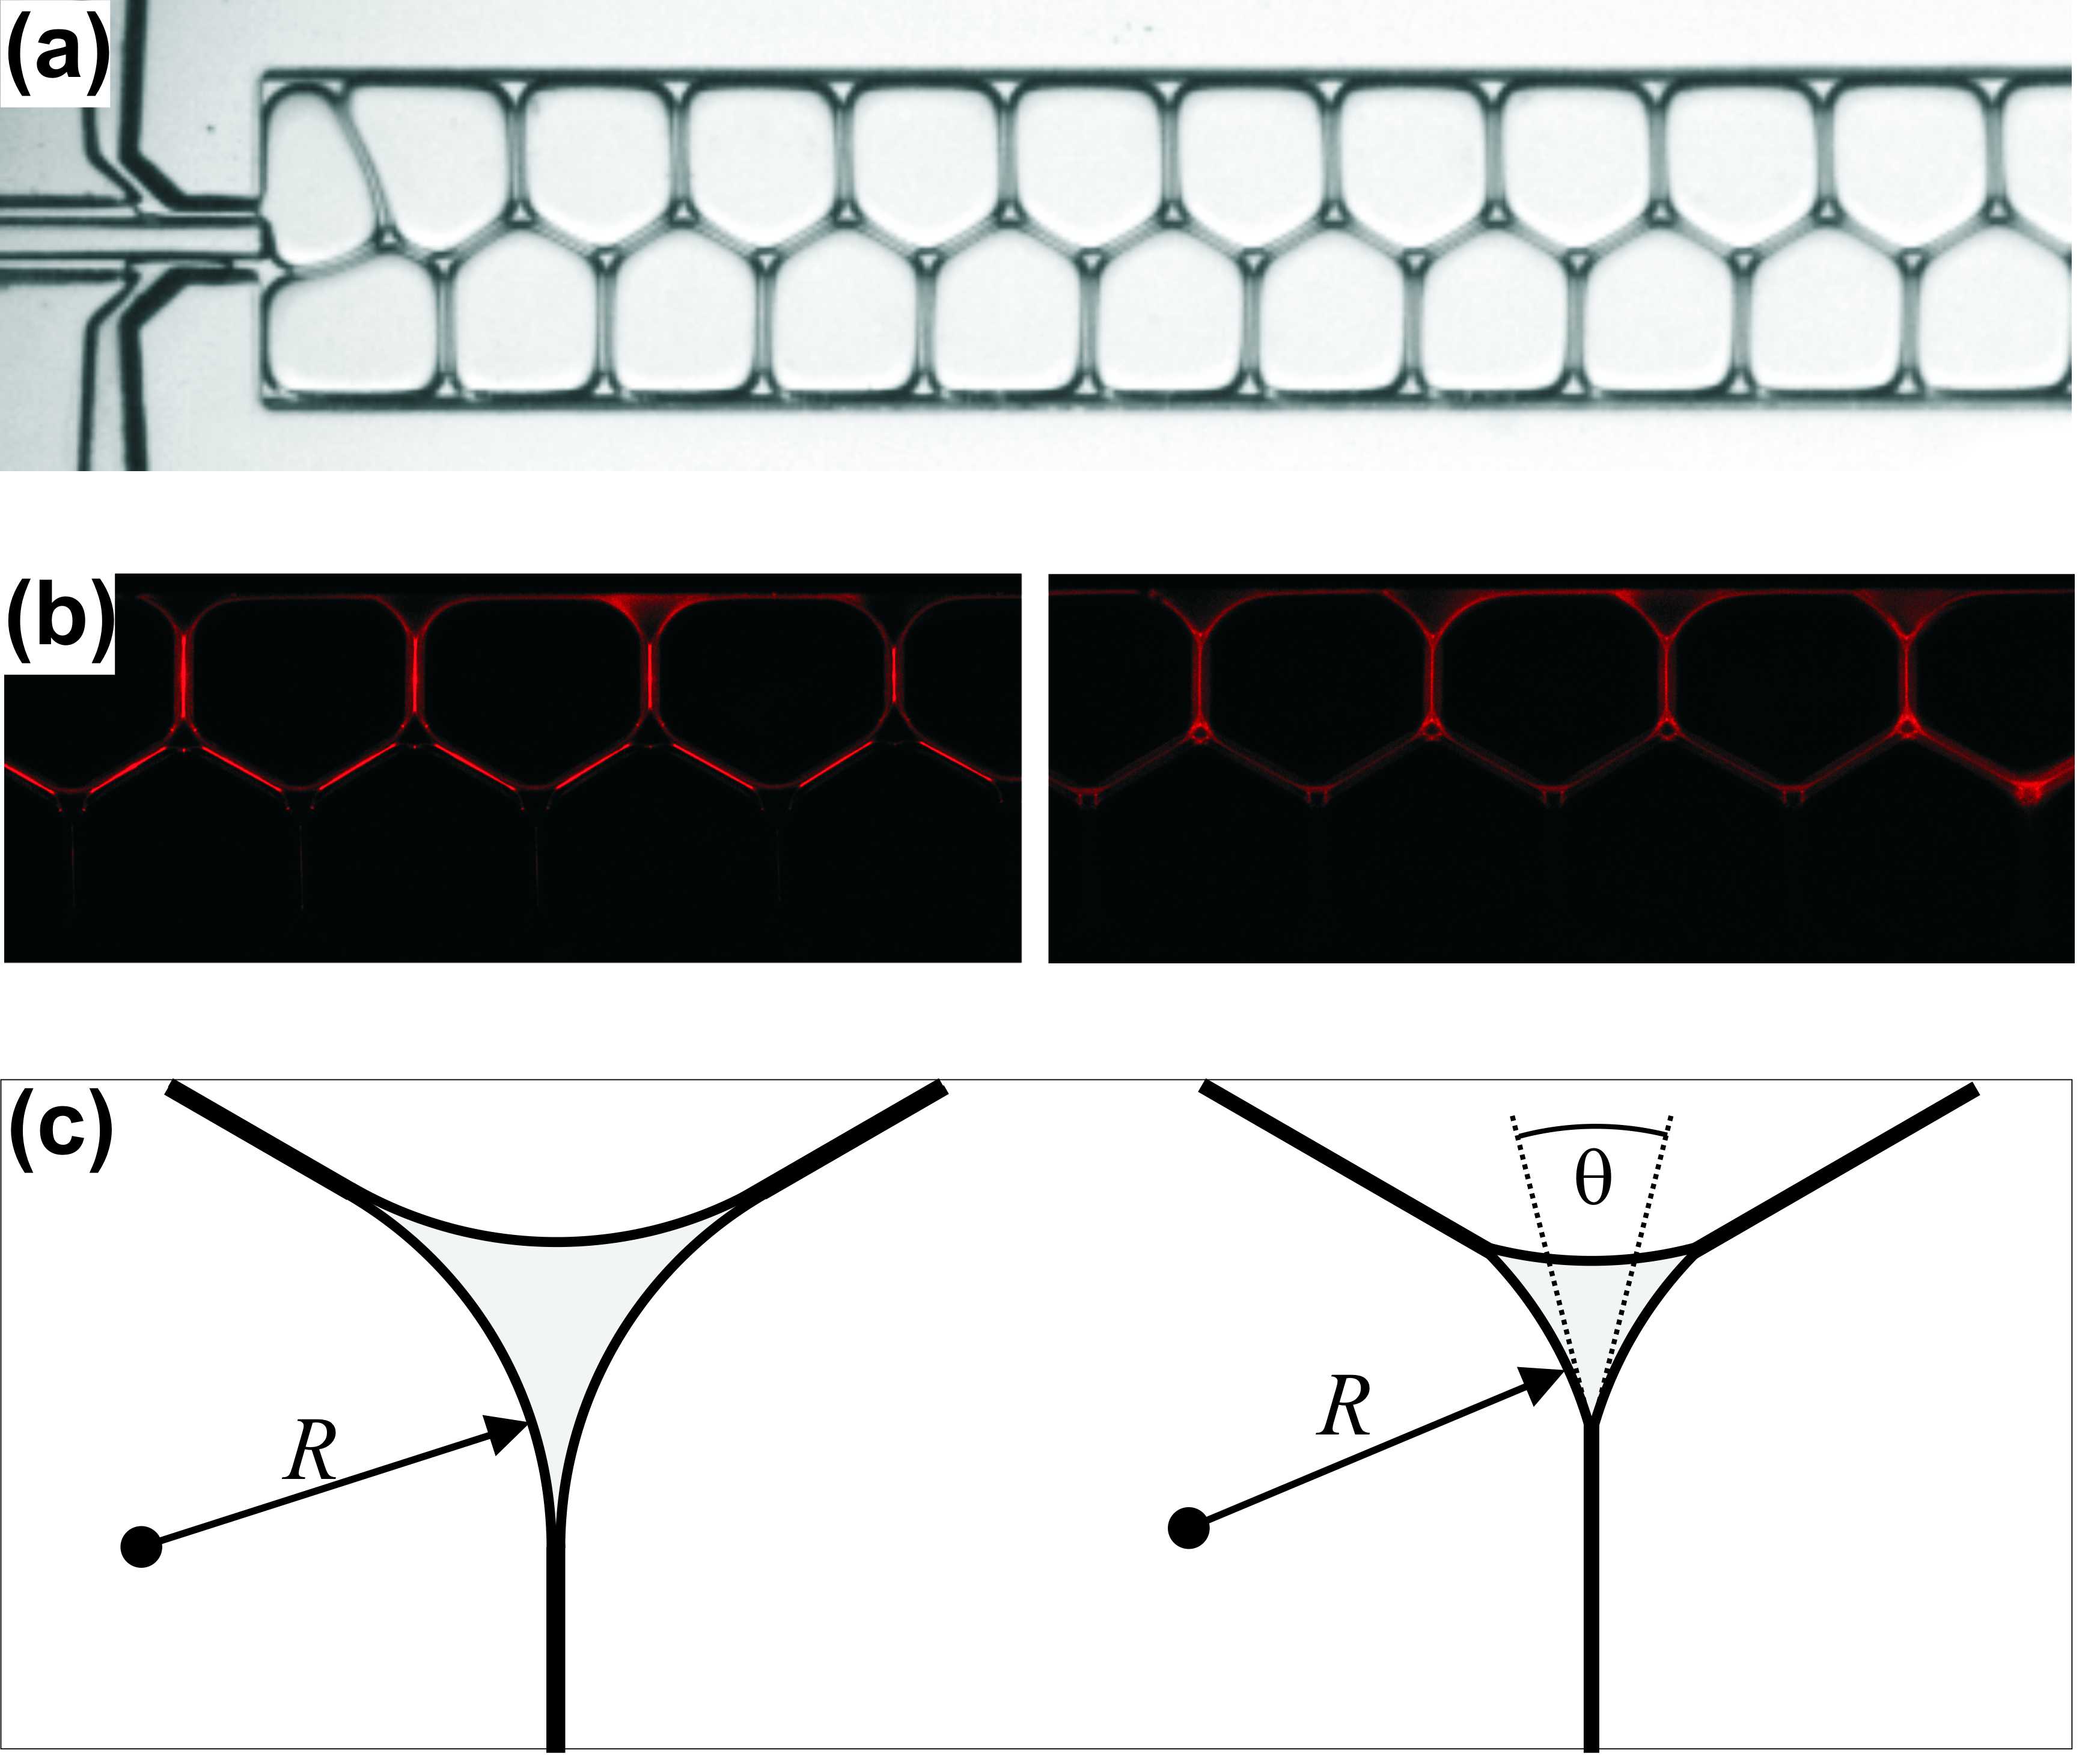
Spontaneous membrane formation is well known to occur if two surfactant-laden oil/water interfaces are brought in intimate contact on their lipophilic sides [15]. Recently, this has also been demonstrated with aqueous drops placed on a substrate next to each other in an oil background phase [21, 22]. It is to be expected that a similar process will occur if a suitable gel emulsion is squished into a micro-fluidic channel at sufficiently low continuous phase volume fraction. That this is indeed the case is demonstrated in Fig. 3. Here we have produced a zig-zag structure of mono-disperse aqueous droplets by step emulsification [23]. The oil is squalane, with the lipid mono-olein as the surfactant at a concentration of 25 mM/l, which is well above the critical micelle concentration (CMC). The droplets in the upper row contained a fluorescent dye (di-4-ANEPPS, Invitrogen) which preferentially enters the central lipophilic zone of a lipid bilayer. In Fig. 3a, which was taken immediately after the formation of the droplets, bright lines of fluorescence are visible in the oil layers extending between the droplets of the upper row. Fig. 3b is taken a few seconds later. Clearly, some of the bright lines have disappeared, indicating the expulsion of the majority of the oil from between the droplets. The transition from the bright line to this faint glow occurs abruptly, and for each oil layer independently. It suggests itself to interpret this transition as the formation of a lipid bilayer separating adjacent aqueous droplets.
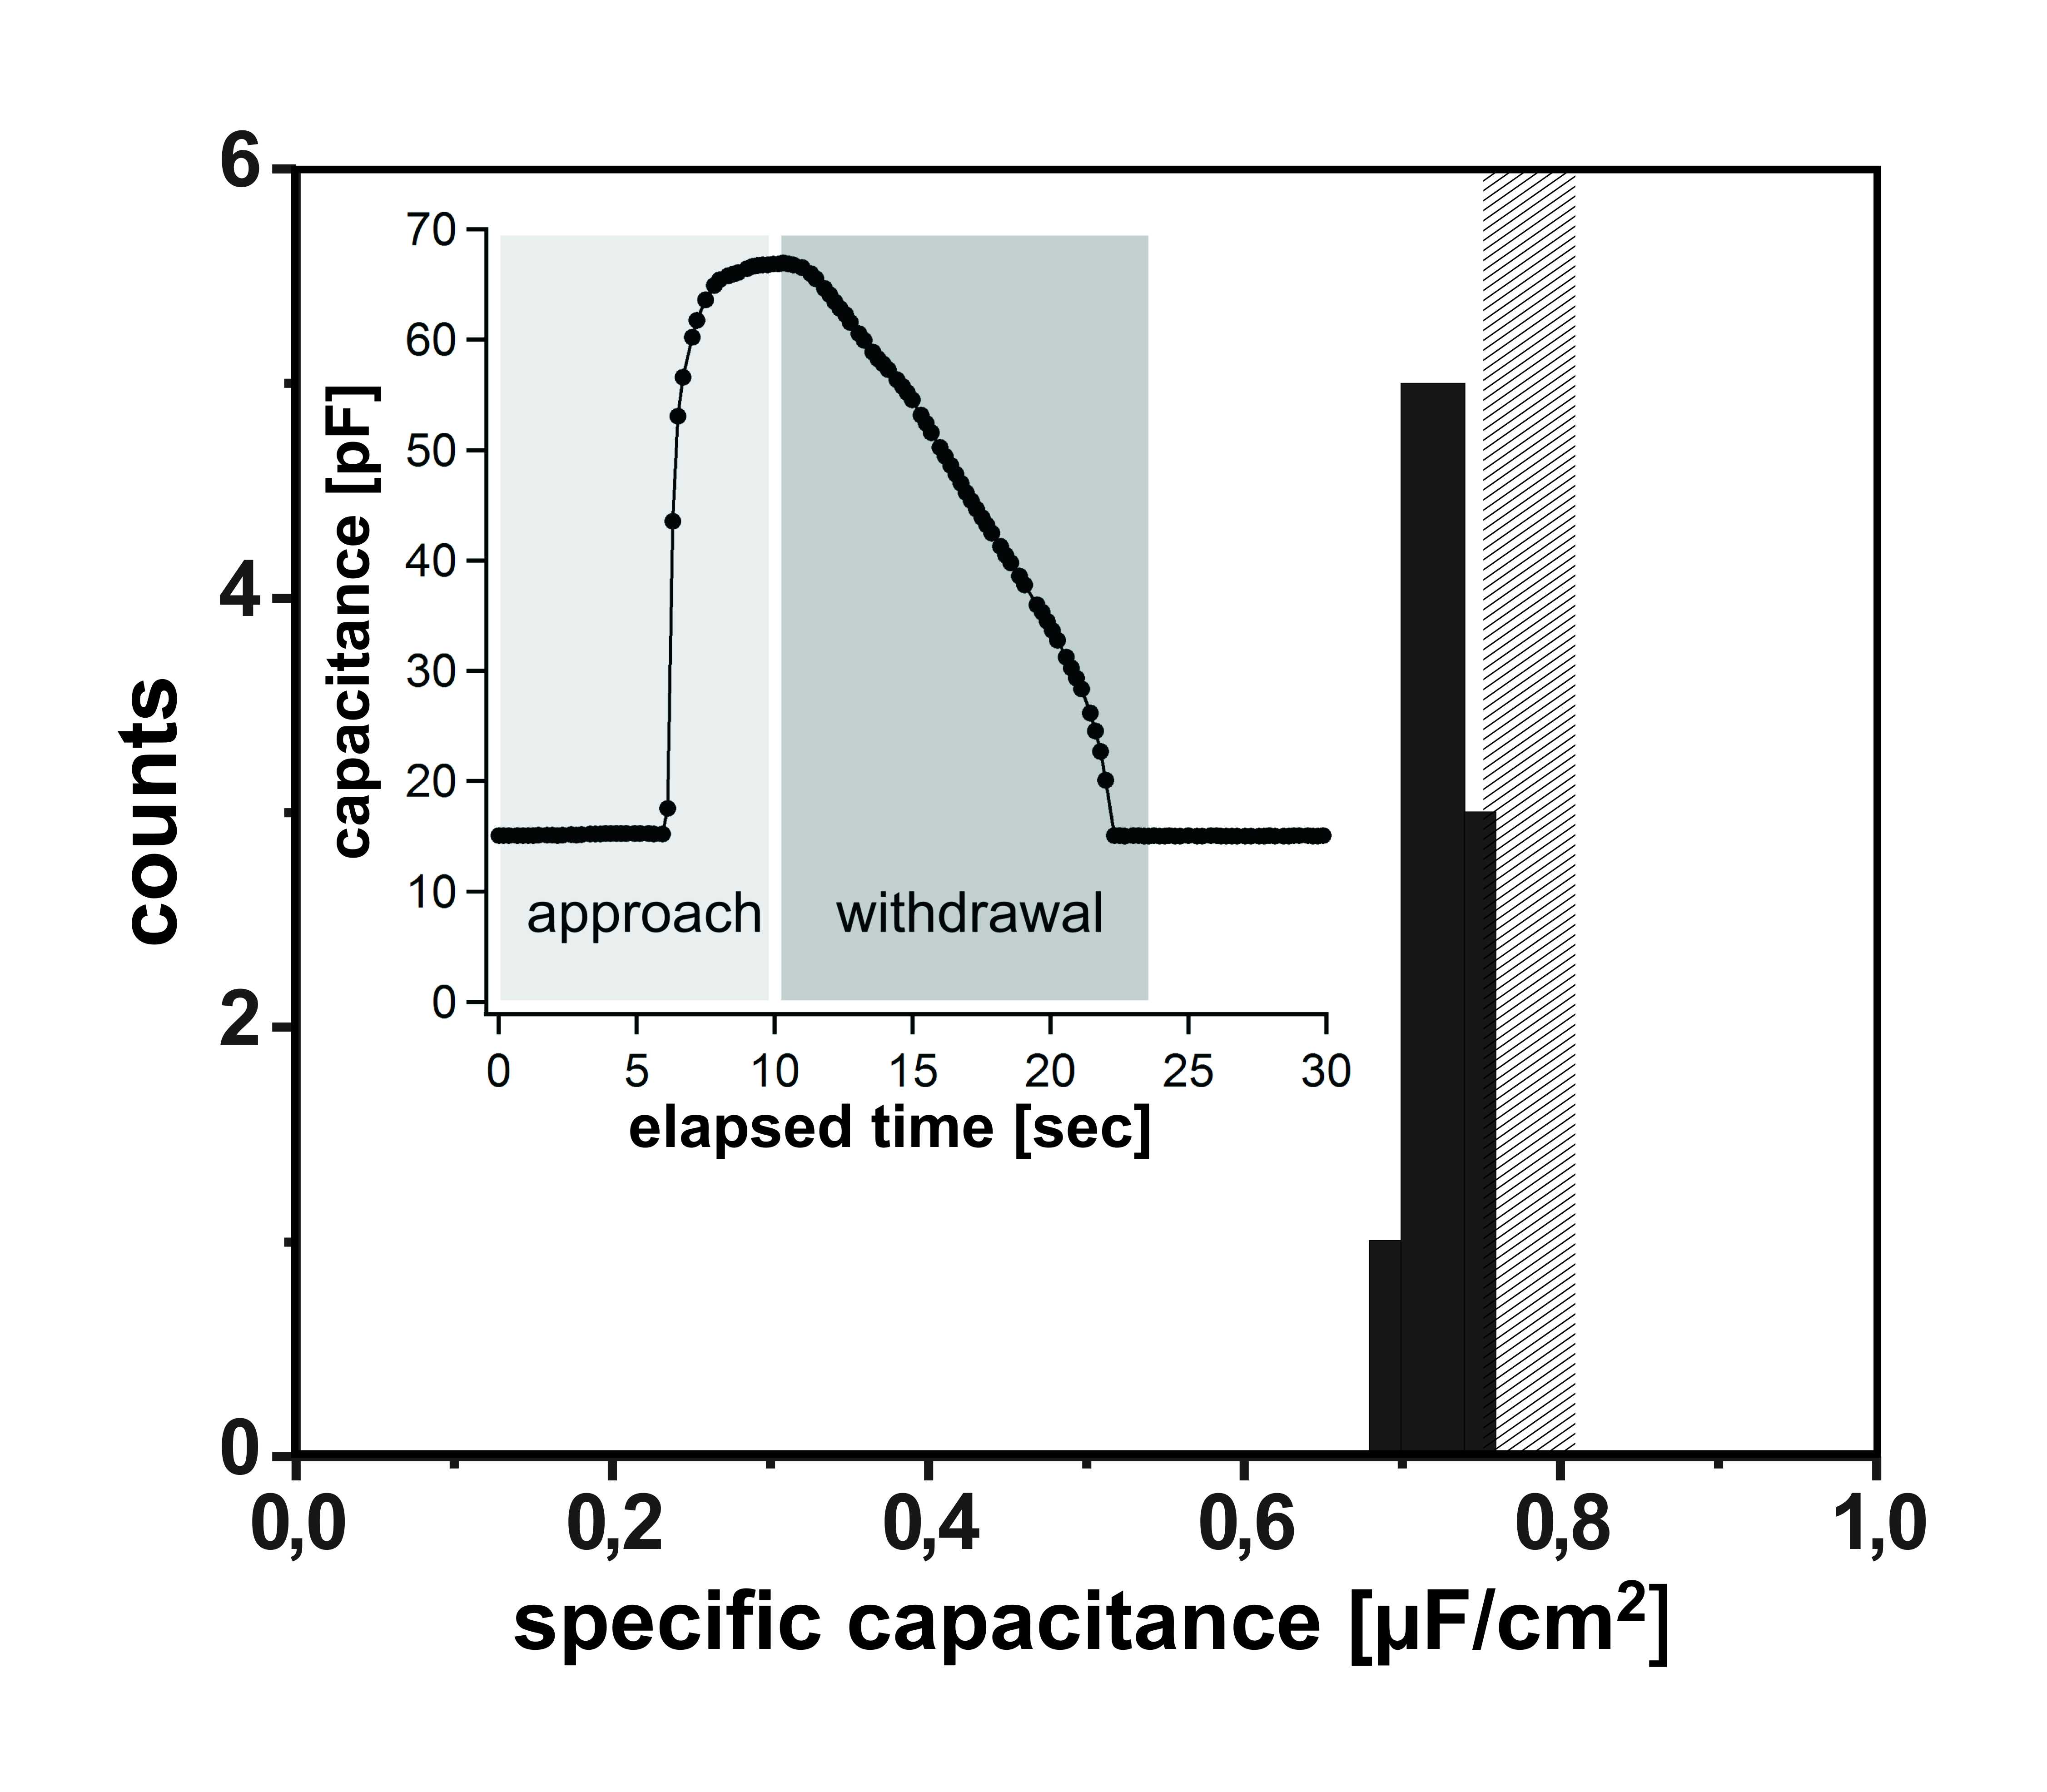
That this is indeed the case is shown in Fig. 4. For this experiment, two droplets were used which contained 150 mM/l NaCl in Millipore water, a content similar to those in Fig. 3 except for the dye. These were gradually approached, in an oil phase consisting of 25 mM/l mono-olein in squalane, beyond the formation of a contact between their interfaces, such that the latter formed a flat region separating the droplets. After a few seconds, the same abrupt transition was observed as reported in Fig. 3. This time the droplets were connected via electrodes to a patch-clamp amplifier, such that the capacitance could be continuously measured. The inset in Fig. 4 shows a trace of the sample capacitance for contact formation and subsequent withdrawal. From microscopic inspection of the flattened region of the interface, one can estimate the diameter of that region, and thereby its area. This allows to calculate the specific capacitance of the membrane thus formed. The histogram displayed in the main panel summarizes a series of experiments performed with the same pair of droplets. Clearly, the specific capacitance is well reproducible. The hatched region indicates estimates for a solvent-free membrane of mono-olein, and compares favorably with our results. The slight deviation may be either due to systematic errors in the estimation of the area, or to some residual oil trapped in the membrane formed.
The lines at which three membranes meet, at an angle of 120 degrees at equilibrium, is called a Plateau border [16]. These objects are clearly visible in Figs. 3a and 3b. In the central image, they show up as dark regions surrounded by the lines of glow from the surfactant layers and the oil. It is clear that as long as there is no membrane, the surfactant layers delimiting adjacent droplets will meet tangentially, i.e., at zero contact angle. This is illustrated in Fig. 3c, where the grey shaded area corresponds to the dark Plateau border in the fluorescence micrograph. The latter reveals that upon membrane formation, the size of this region shrinks significantly. We can use this effect to determine the contact angle at which the surfactant layers meet the membranes, as illustrated on the right hand side of F.g 3. For the shaded area, , one readily finds
| (1) |
The radius of curvature, , is directly linked to the pressure, , in the droplet via , where is the free energy per unit area of the surfactant-laden water/oil interface. can thus be considered to remain unchanged as the membrane forms. It is then easy to obtain the contact angle, , from the size of the Plateau borders. We obtain degrees.
At the three-phase contact line, where the membrane meets the adjacent water/oil interfaces, force balance yields
| (2) |
where is the free energy per unit area of the membrane. We can thus directly infer the membrane free energy from inspection of the Plateau borders if is known. Using the standard pendant drop method, we obtained mN/m. Our result for the membrane free energy is thus mN/m. The formation of the membrane is therefore accompanied by a gain in free energy of mN/m.
The interfacial free energies involved are of interest for the potential performance of devices designed in the way proposed here. In order to take full advantage of the concept, droplets have to be formed and moved relative to the geometry provided by the micro-fluidic channel structure. The excess free energy of the droplet interfaces sets the scale for the pressures to be applied in these processes. The Laplace pressure is given by , where is the size of the smallest orifice to be passed. For mN/m, we obtain bar for a 30 nm orifice, which appears well feasible.
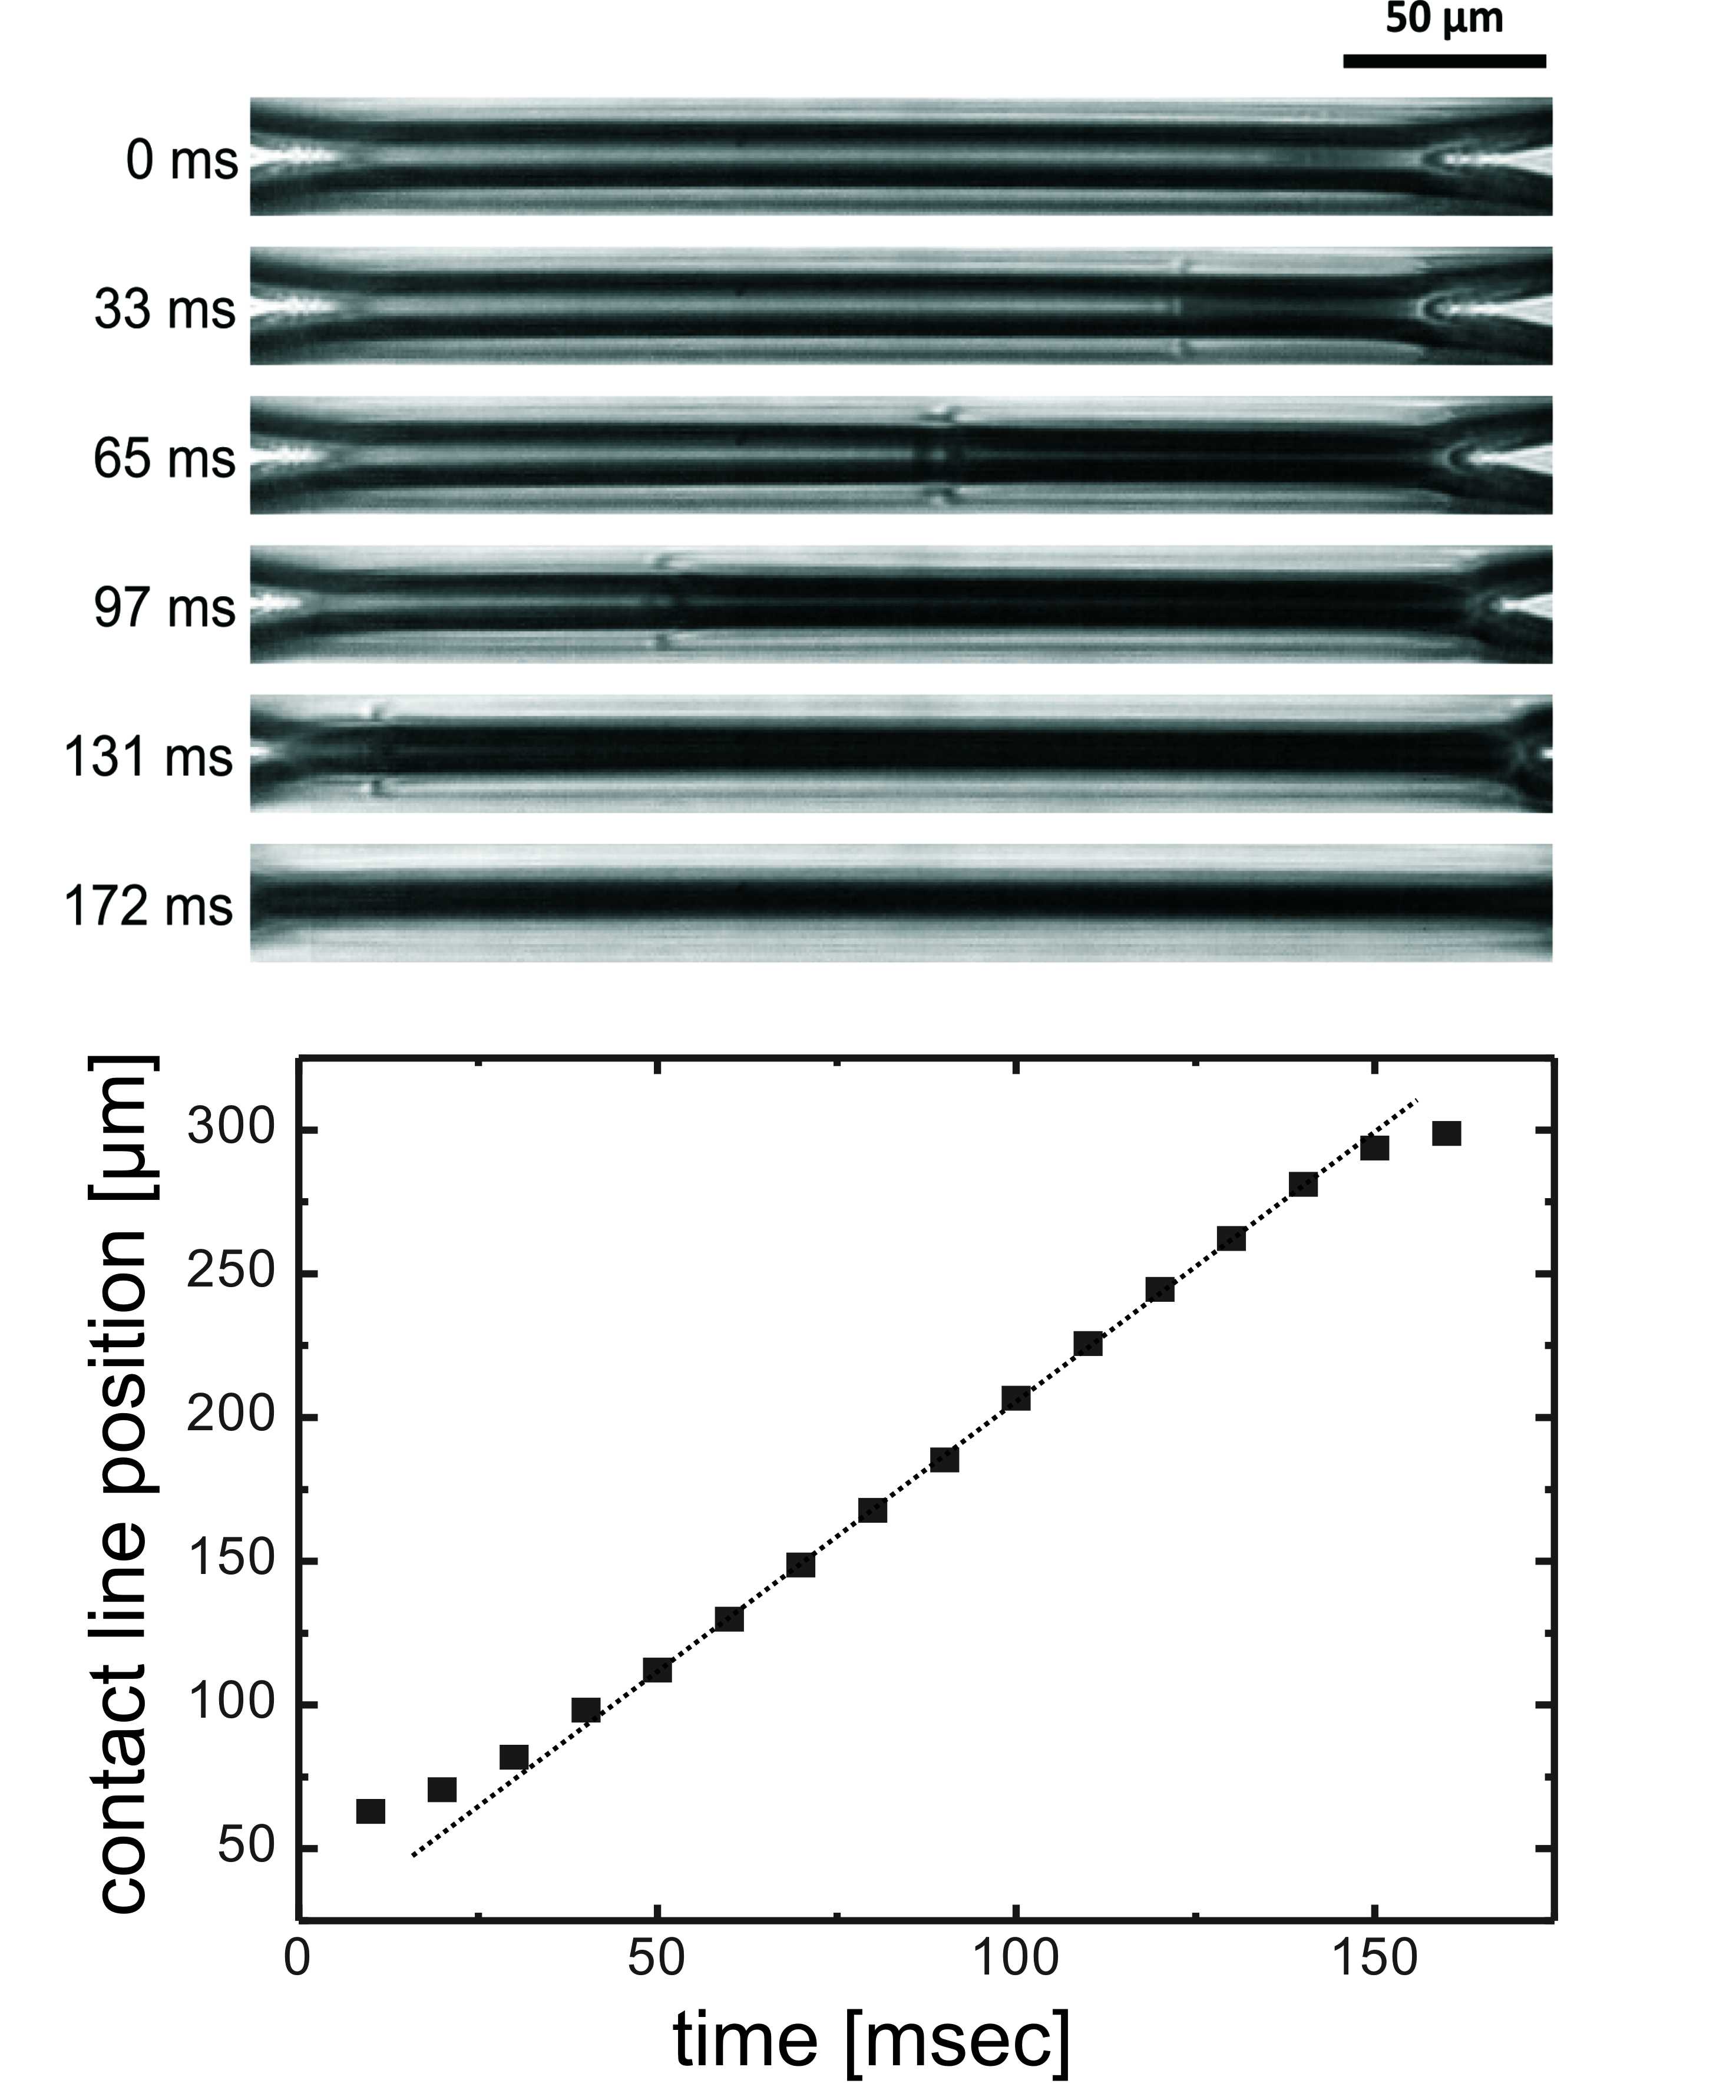
As the sharp rise in the capacitance trace shown in the inset of Fig. 4 suggests, the formation of the membrane is a rapid process. Fig. 5a displays a series of images captured with a high speed camera (1000 frames per second, Photron SA 3). The zipper-like transition is clearly discernible, although details on the scale of the membrane thickness are of course not accessible to optical imaging. The total time of formation in this run was about 150 ms. Fig. 5b shows the membrane diameter as a function of time, as observed during a single formation event. The approximate constancy of the contact line velocity (i.e., the first derivative of the diameter with respect to time) suggests a constant power of dissipation, which is due to the viscous friction in the vicinity of the edge of the membrane, where the two aqueous phases and the oil phase meet. More specifically, we can compare the contact line velocity of about 1.9 mm/s with the capillary velocity, 4.1 cm/s , where is the viscosity of the liquid (in this case Squalane which has a viscosity of 43.4 mPa.s). This is a natural velocity scale for the system, corresponding to the balance of interfacial and viscous forces. Clearly, the measured contact line velocity is much less than , which can be attributed to the diverging viscous stress near the three-phase contact line [24].
For an effective manipulation of the droplet configuration within the micro-fluidic setup, it may be necessary to move the emulsion through the micro-fluidic device. This can be done either externally by pressure or volume control (e.g., syringe pumps), or internally by means of suitable local mechanisms. In any case, it is of central importance that these manipulation steps do not lead to the destruction of membranes. One might anticipate that this constraint poses a serious conceptual problem, since the membranes are objects of minute thickness (about 4.5 nm in the case of mono-olein) and relatively small energy of formation (see above).
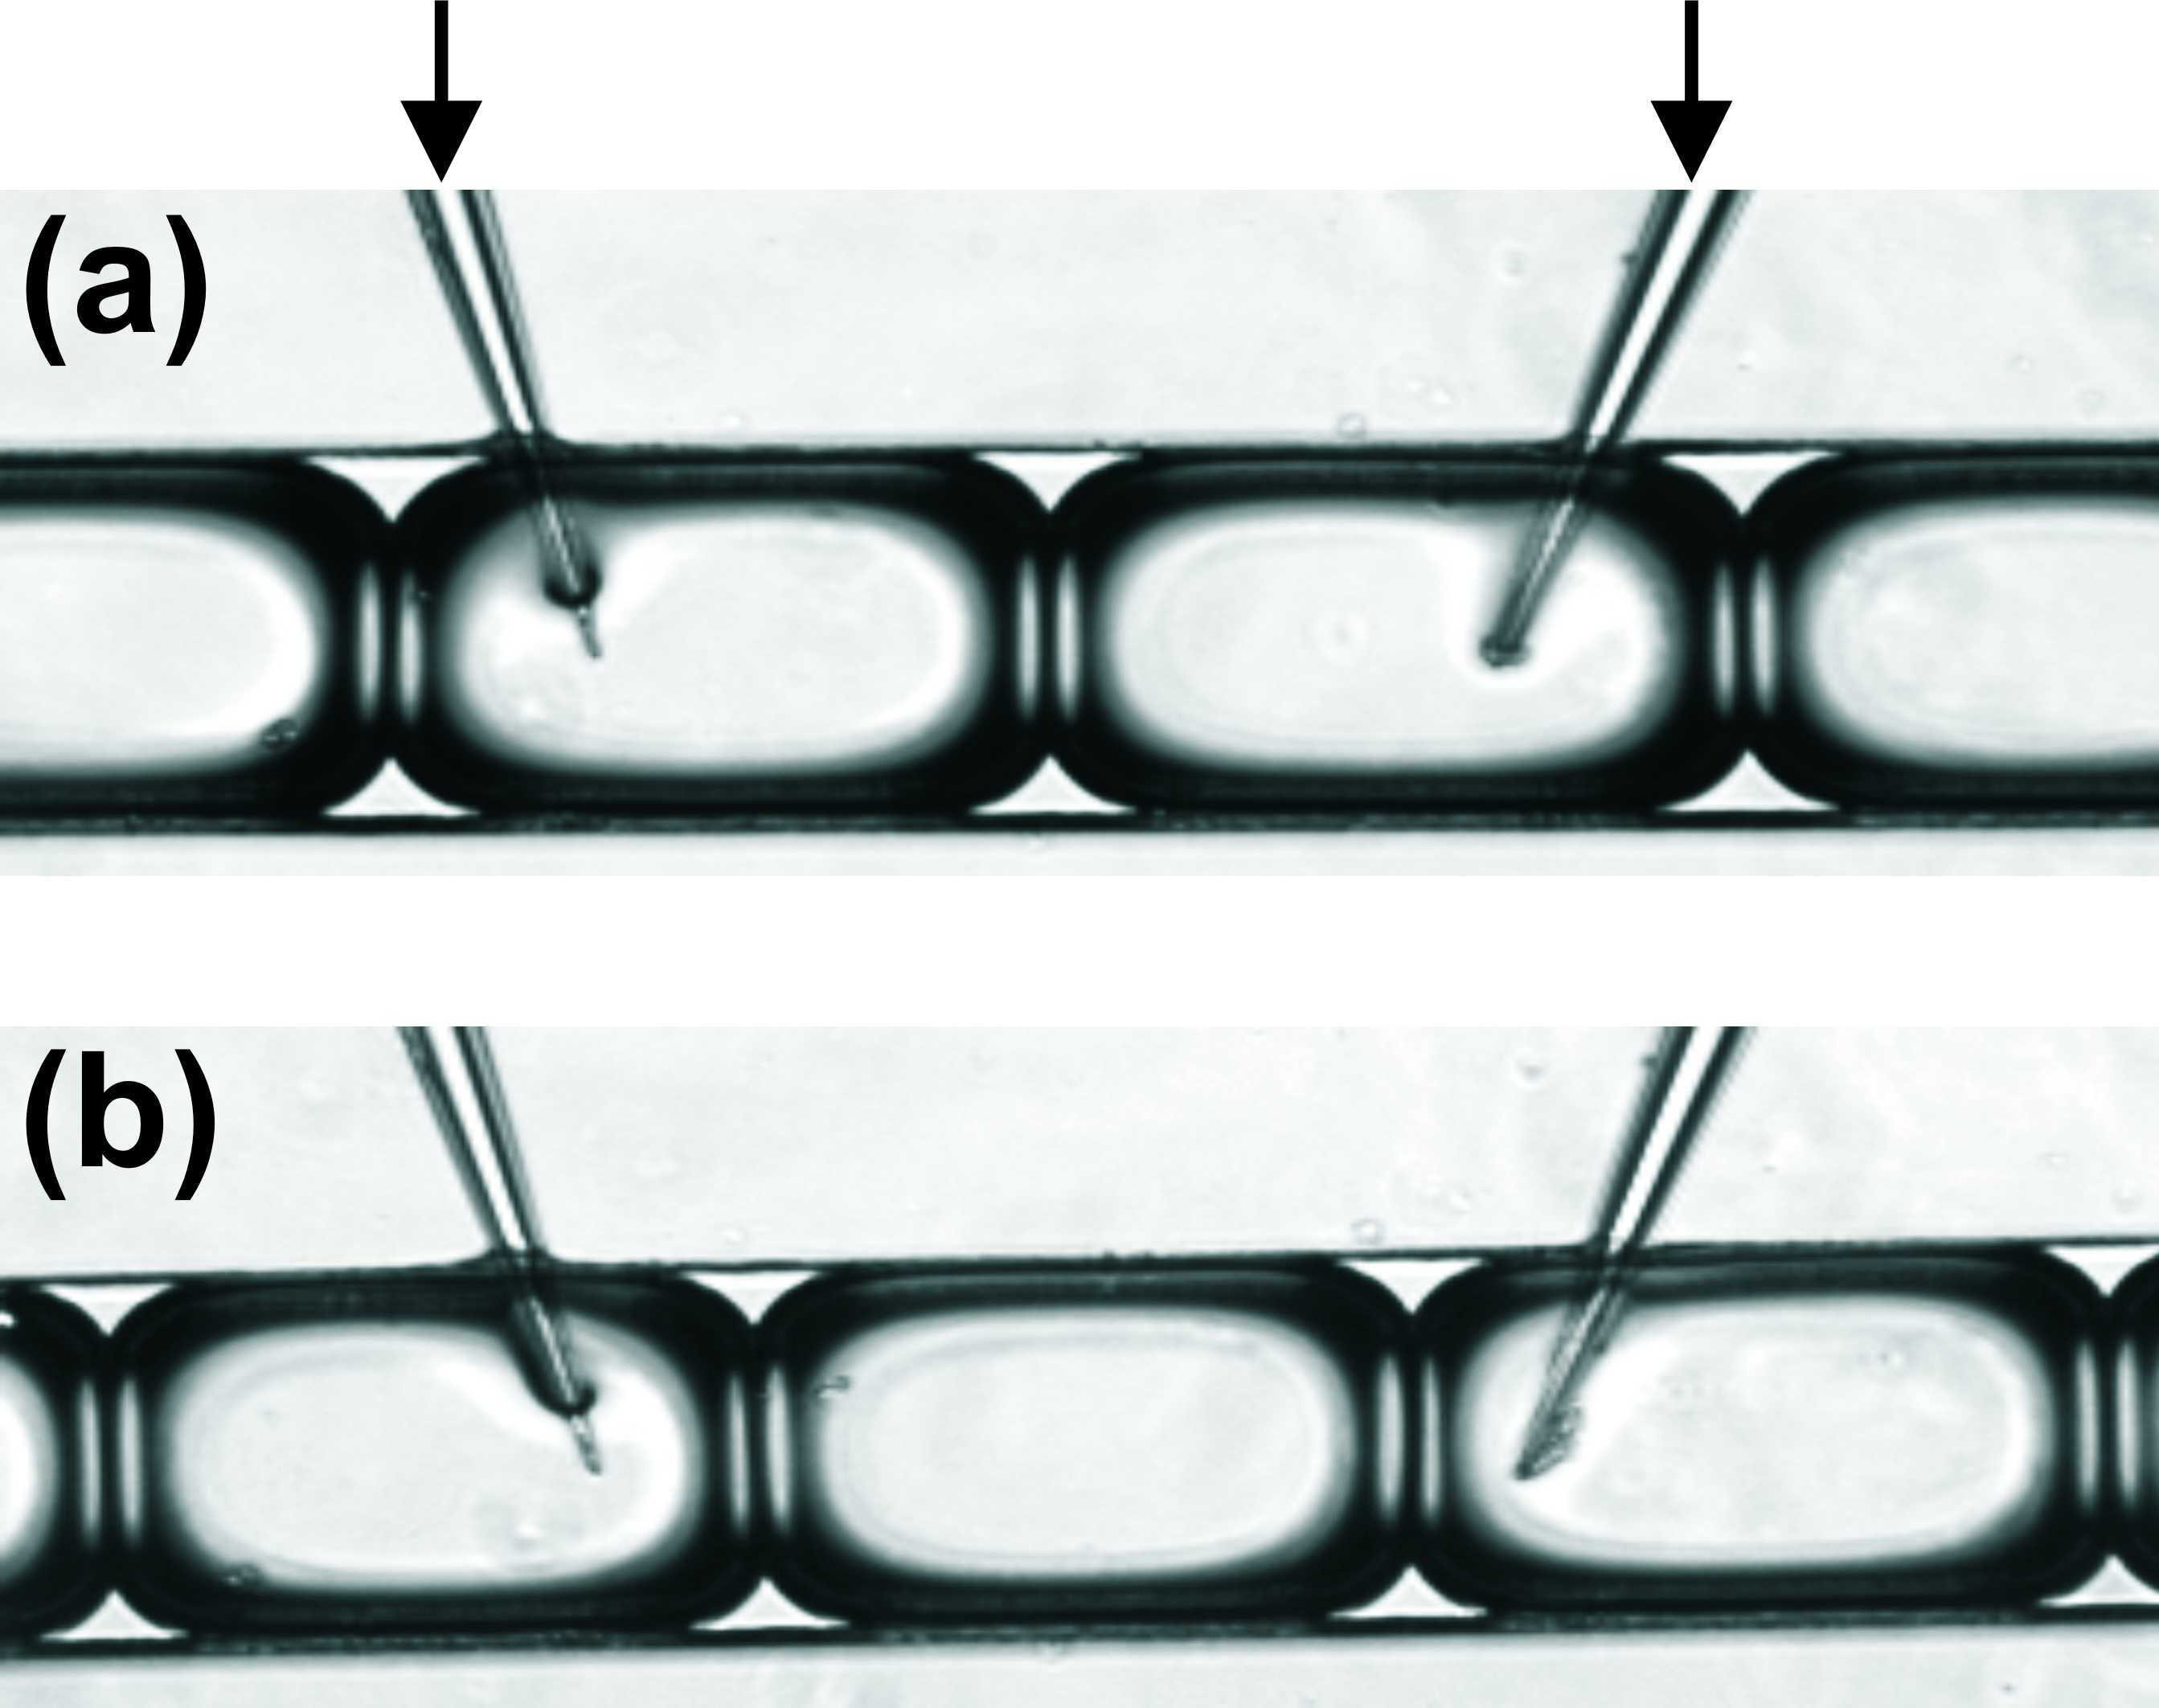
Quite remarkably, we found the bilayer membranes to be very stable against mechanical stresses, such as those exerted on them in micro-fluidic flow. A particularly striking example is shown in Fig. 6. Glass micro-pipettes can be inserted through thin walls (100 m) created in the PDMS directly into the droplets. This is important for establishing ohmic contacts to the aqueous droplet content by means of standard electrodes, as used in electro-physiology. In order to isolate the droplets hydrodynamically from the inside of the pipettes, the latter were filled with Millipore water plus 150 mM/l of NaCl and a small amount of agarose to form a gel. Electrical contact was established by inserting a 500 m diameter Ag wire into the pipette, which was chlorided before electrochemically with 3 M KCl. The droplets were pumped through the channel at a rate of about three droplets per second. As seen from Fig. 6a and Fig. 6b, the membranes survive their motion past the inserted glass pipettes: coalescence is not induced. We found that the stability of the membranes against such mechanical stress depended on the type of intruder. While the glass pipette electrodes did not seem to affect the membranes in any way, a tungsten wire (100 m diameter, sharpened to a 30 m tip) induced immediate coalescence.
III electrical contacts and characteristics
Let us now turn to the possibility of constructing electrical circuitry out of gel emulsions in micro-fluidic systems. The first thing we have to demonstrate is that the aqueous droplets, which are now to be considered the ’solder points’ of potential self-assembled circuits, can be suitably connected to external leads. The setup shown in Fig. 6 can indeed be used to measure the electrical properties of the membranes spanned between adjacent droplets. Fig. 7a shows typical traces obtained upon applying a square wave to a single membrane through the pipettes, which were configured as electrodes. Both the current and the voltage are recorded using a standard patch clamp amplifier (HEKA, EPC 10). We clearly see the loading current of the membrane capacitance, as well as an ohmic current persisting as long as the voltage is applied.
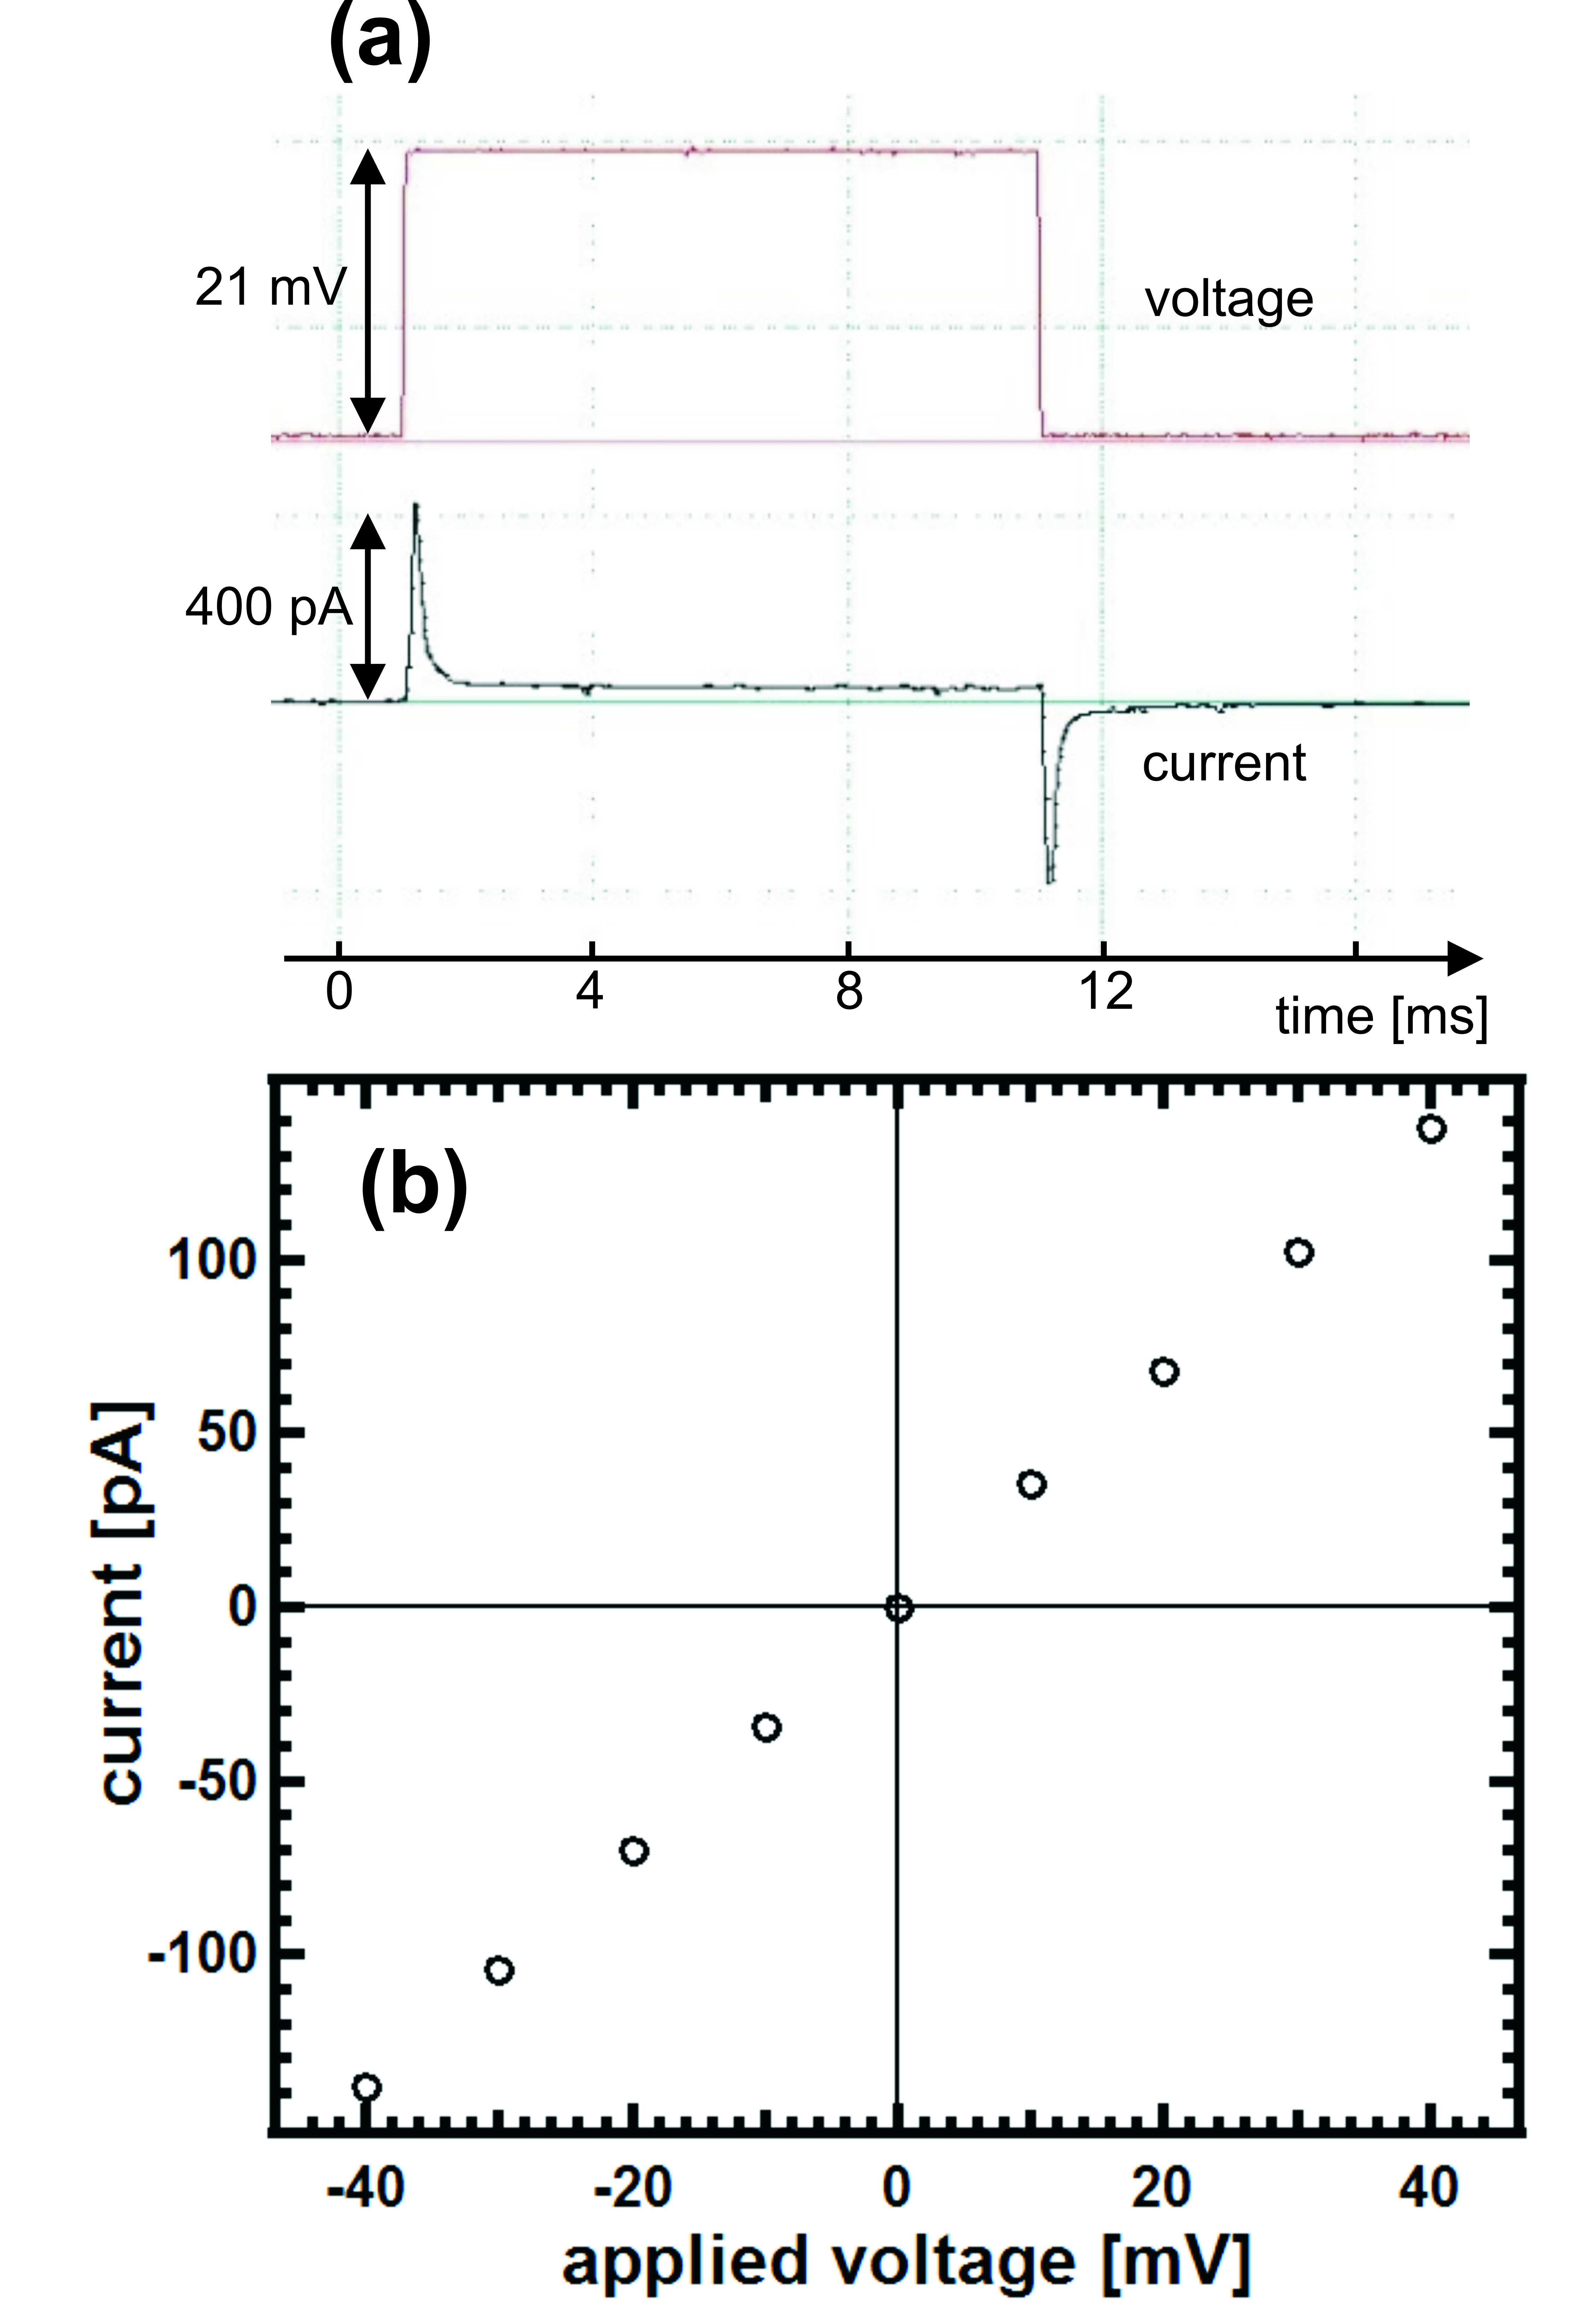
While the capacitive signal is unambiguously due to the membrane capacitance and corresponds to the specific capacitance of about (c.f. Fig. 4), the ohmic resistance is masked by the resistance of the ionic conductance of the surrounding aqueous solution. Comparing the traces obtained with the configurations displayed if Figs. 6a and b, we obtain the ’pure’ ohmic characteristic of a single membrane, as displayed in Fig. 7b. This conduction is probably due to ionic impurities which are sufficiently lipophilic to cross the membrane [25] in a thermally activated process.
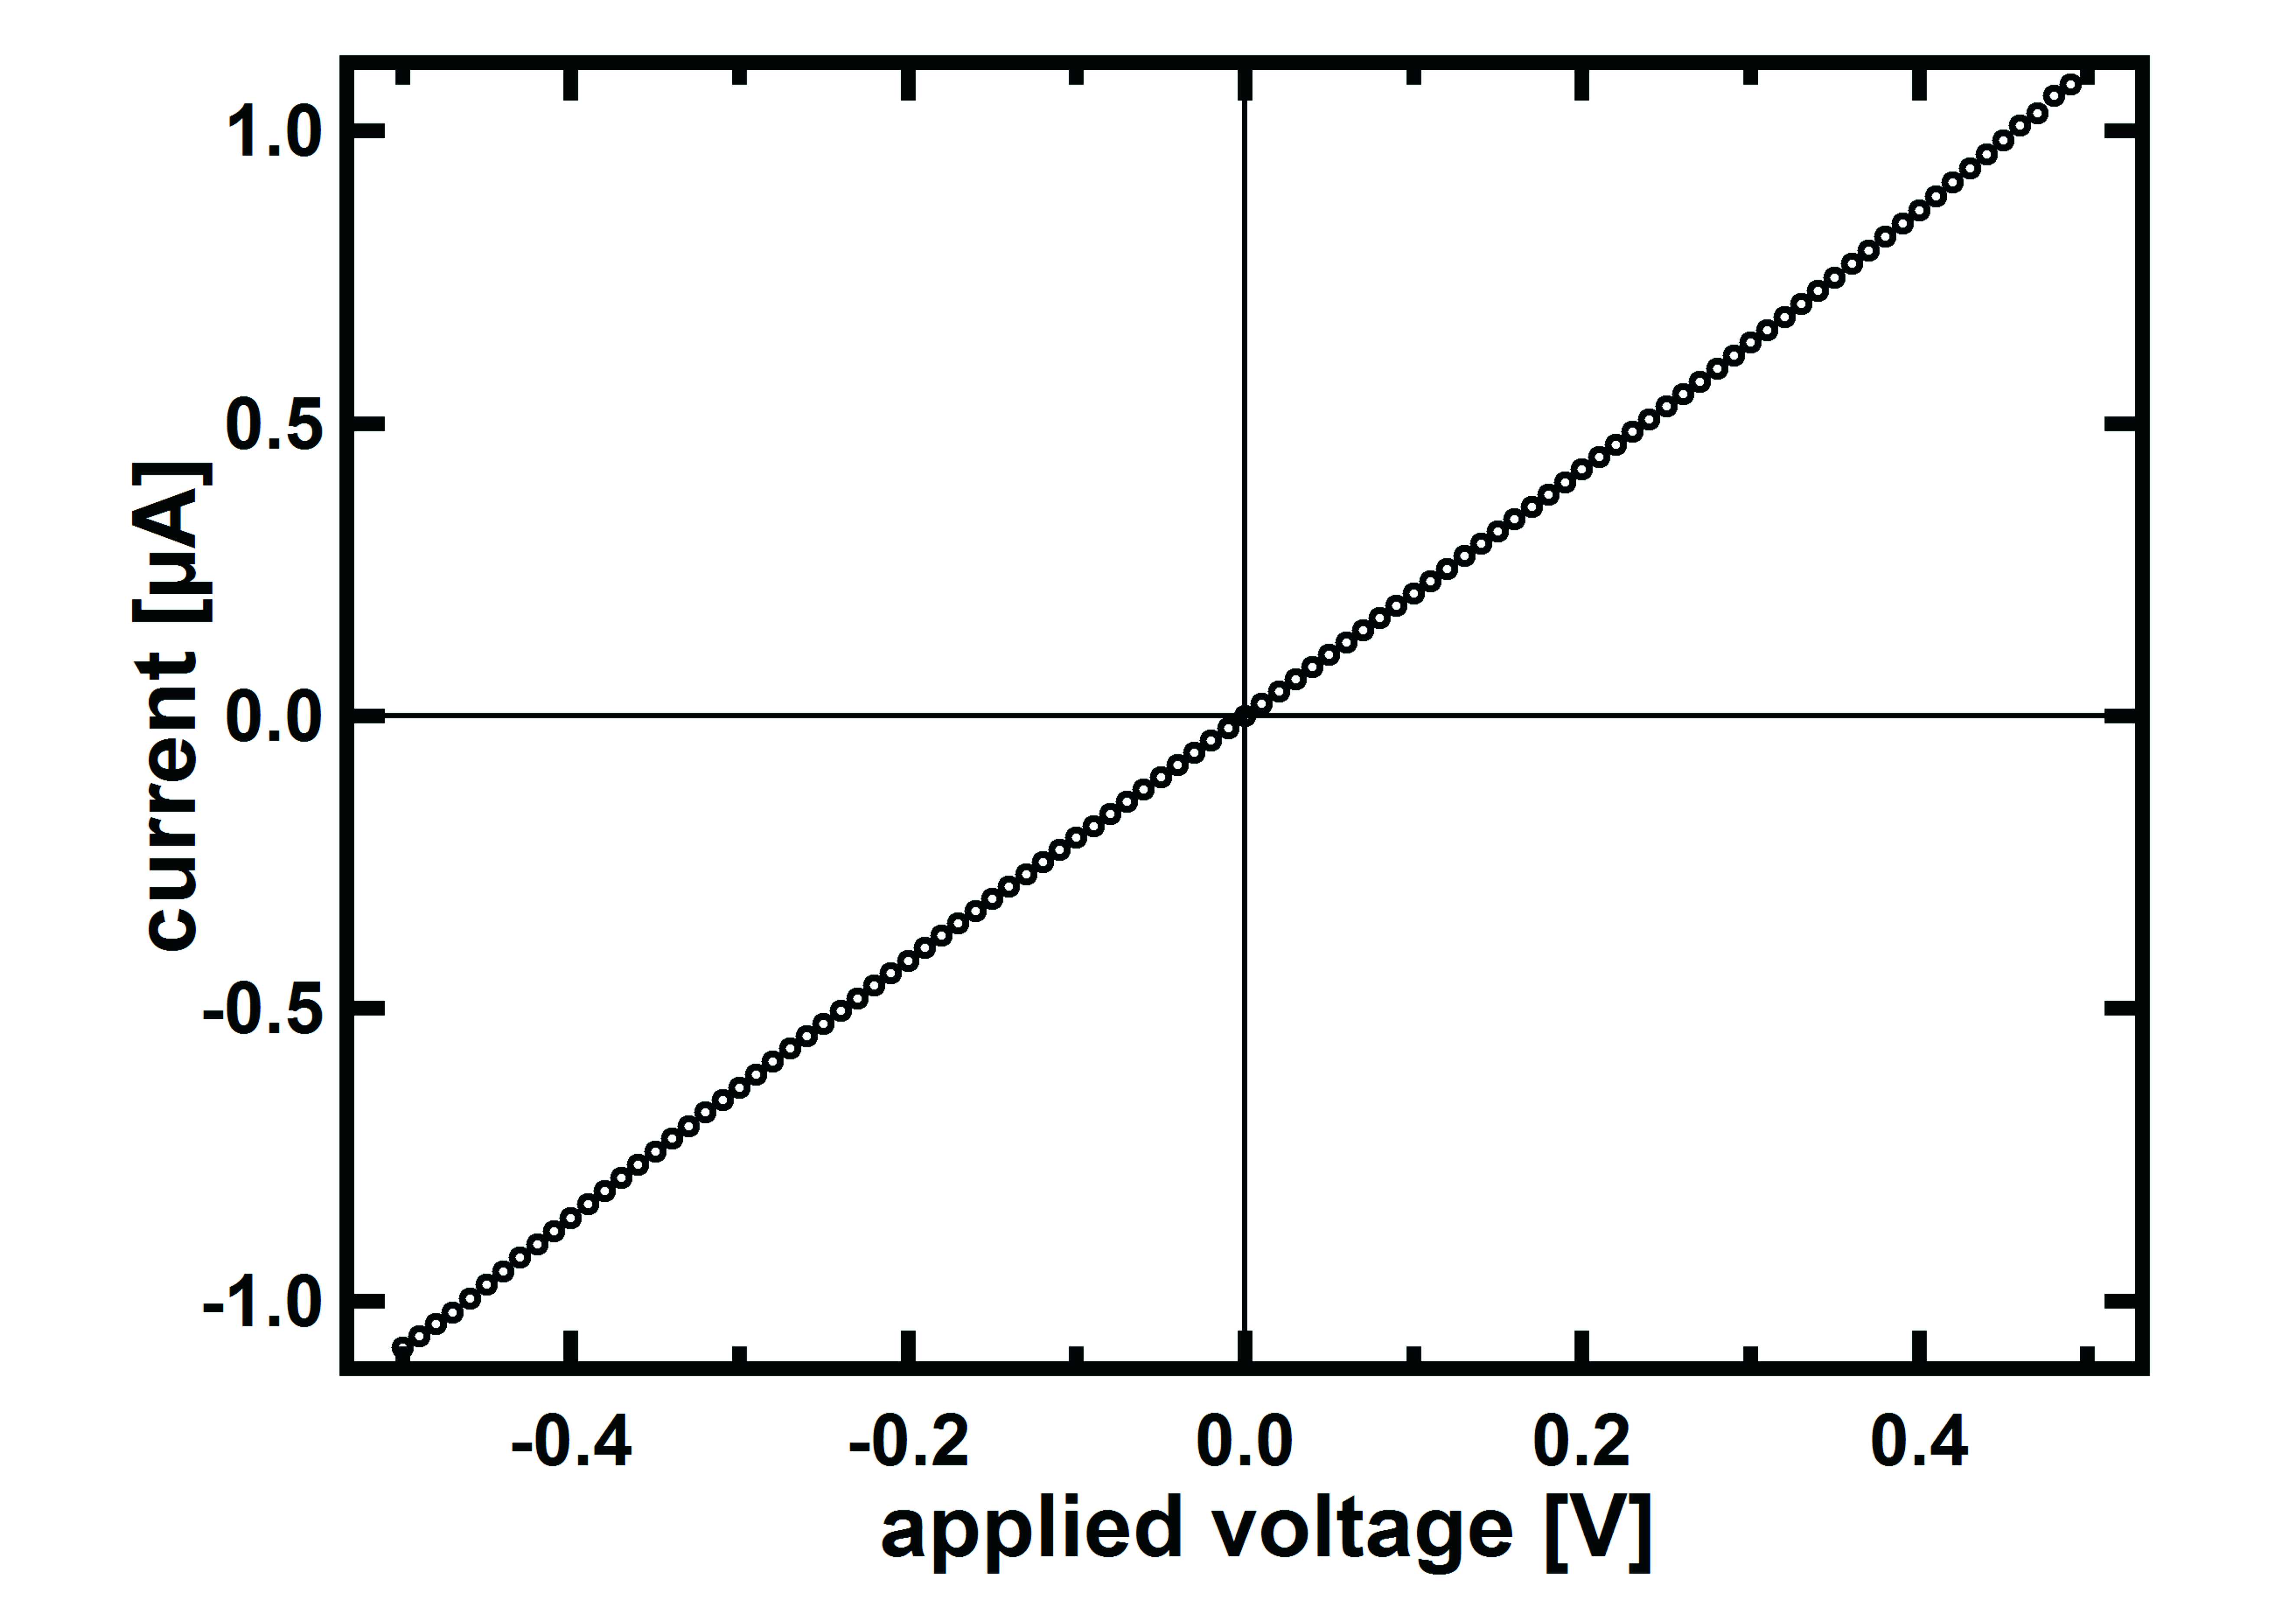
Next we want to demonstrate that the capability of membranes to incorporate active components, as it is well known from experiments in membrane physiology [26, 21], also pertains to the micro-fluidic setting. We have therefore added gramicidin ion pores to the liquid phase in the device, in order to see whether the presence of the channel walls might hamper their performance noticeably. Fig. 8 shows the current-voltage relationship of a membrane doped with gramicidin A ion pores (Sigma-Aldrich). The gramicidin is added to the aqueous phase at a concentration of . Clearly, there is now a dramatically increased conductance of the membrane, which we attribute to the ionic conductivity of the pores. From the unit conductance of the gramicidin A ion pore [27], we estimate the number of pores in our membrane to be in the order of . Since the membrane is now significantly conducting as compared with the native state, voltages of 500 mV (and even up to 1 V) can easily be applied without rupturing the membrane. In the native state, we found that applied voltages beyond roughly 300 mV ruptured the membrane.
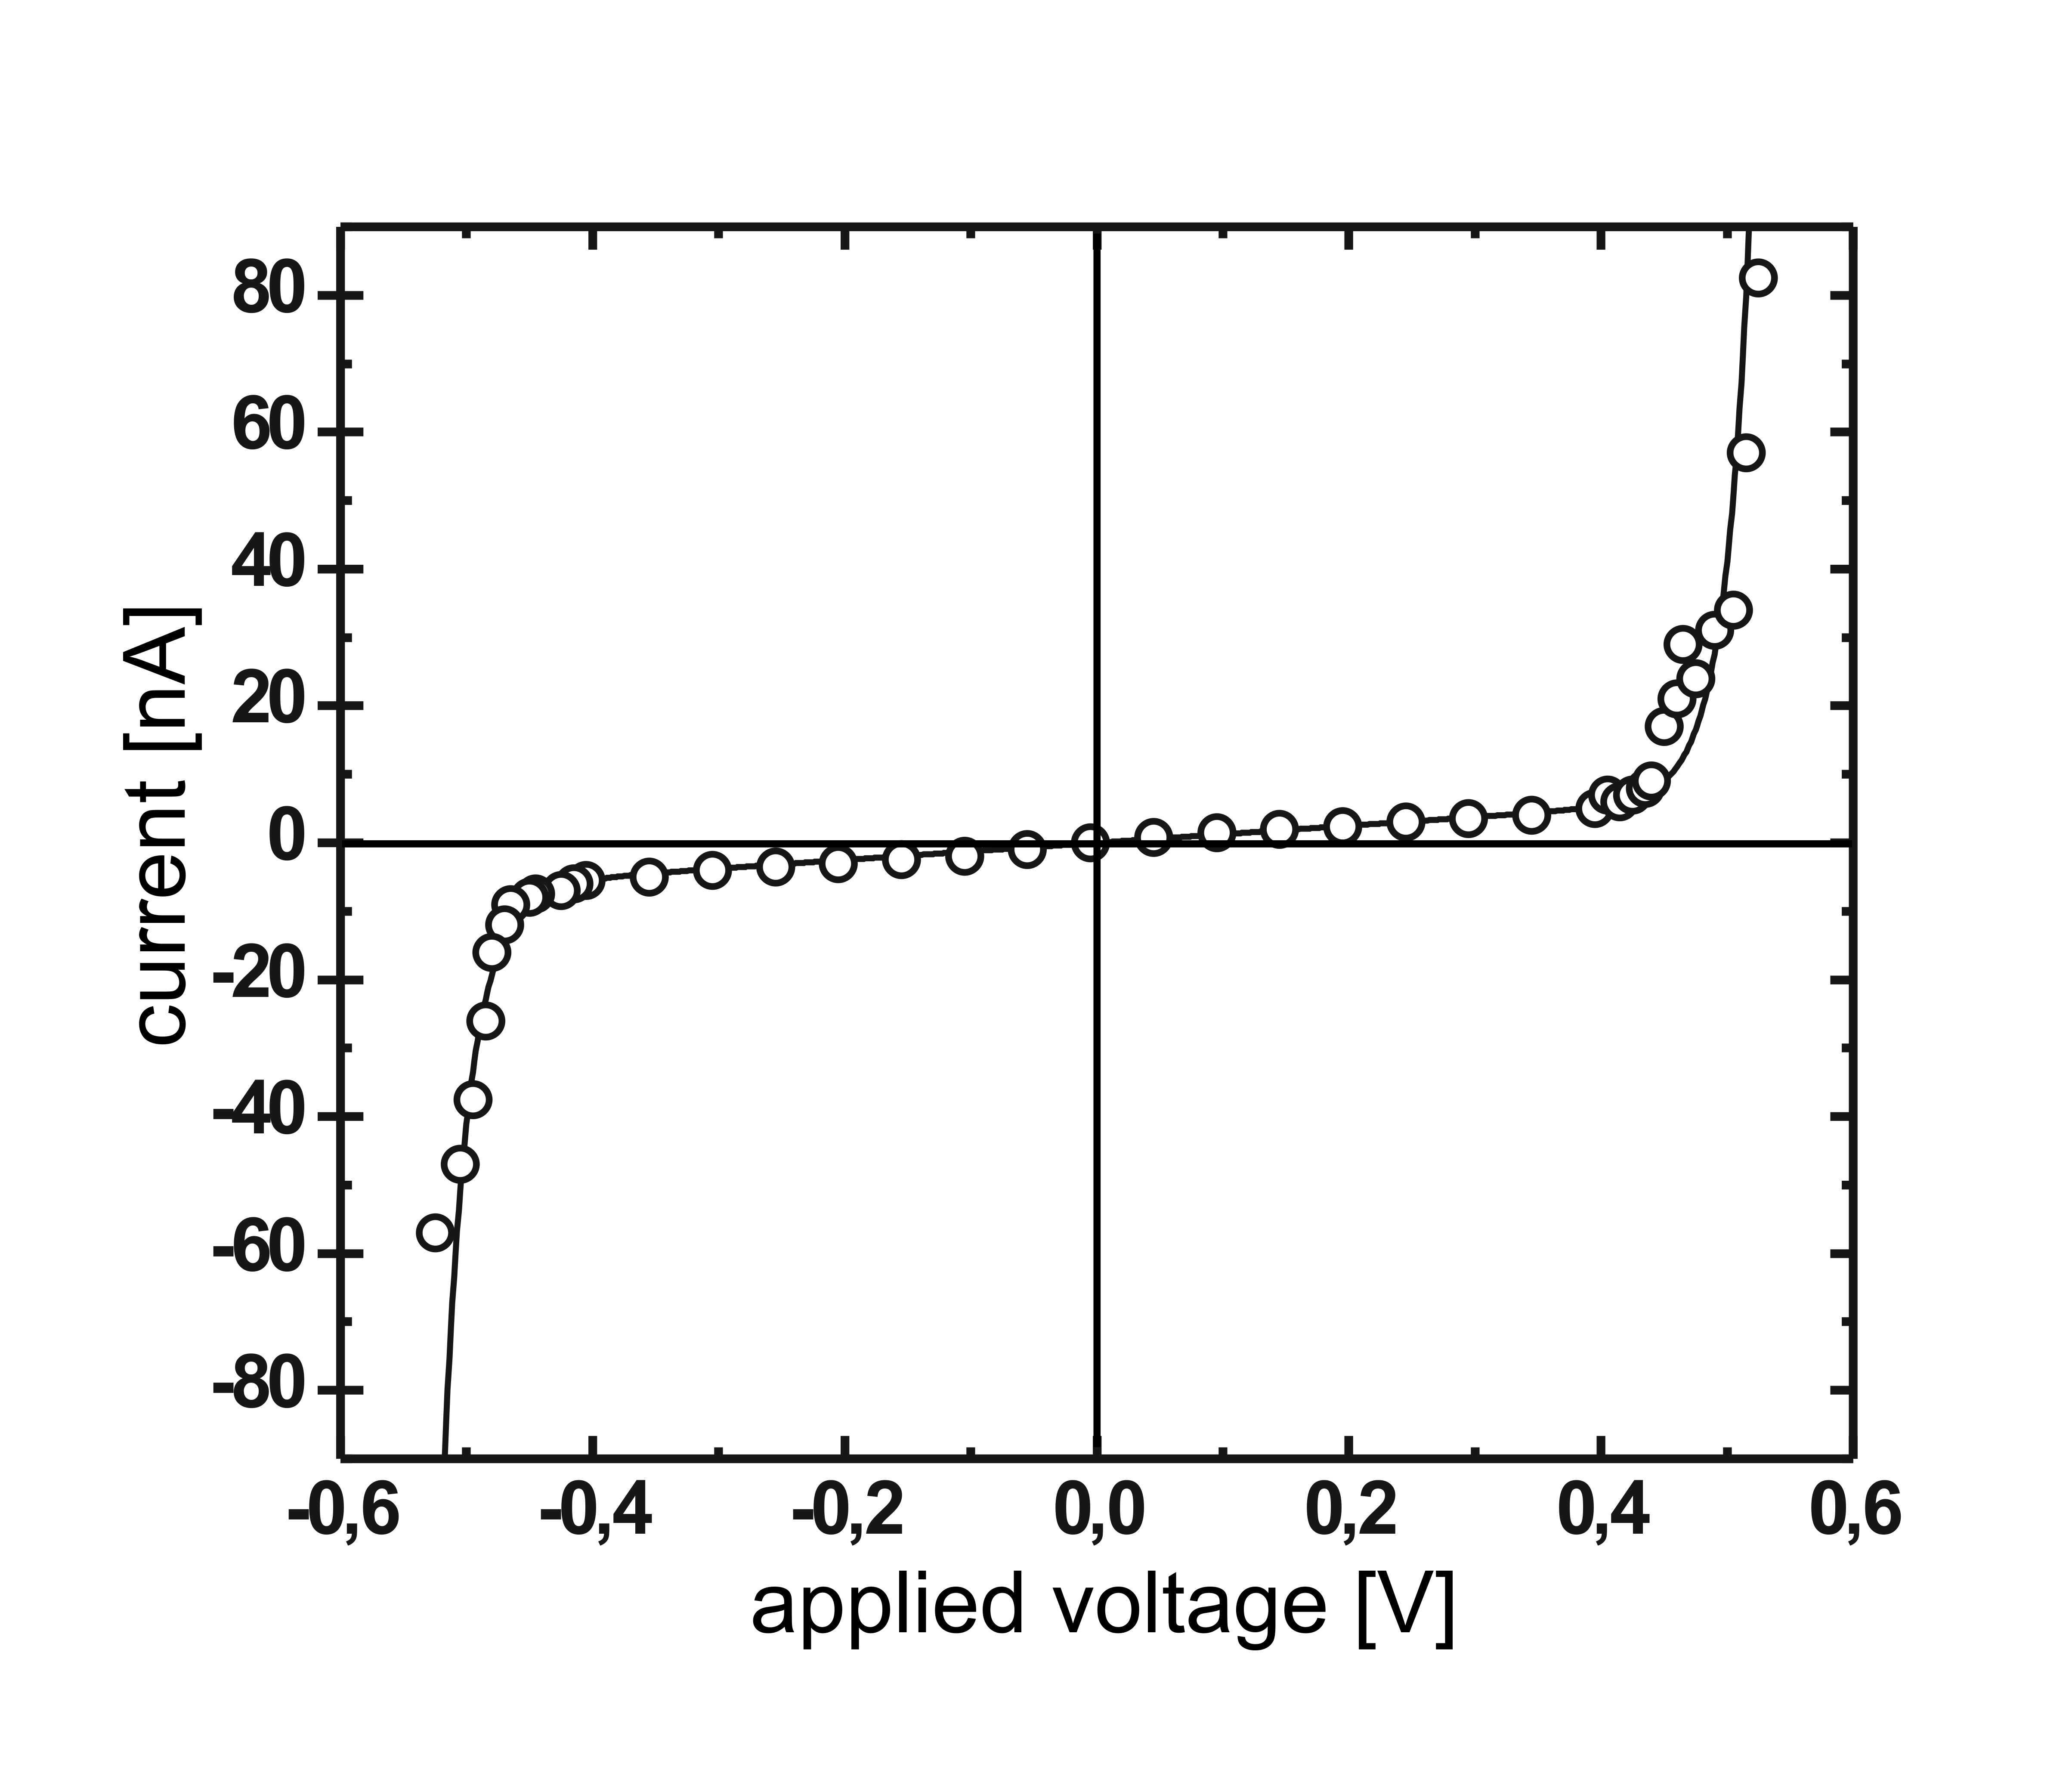
Along with the applied voltage, the width of the applied voltage pulse is also crucial in studying the current/voltage characteristic of a membrane. The result of such an experiment on a native membrane similar to the one described above is displayed in Fig. 9. In comparion with the previous experiment (pulse width of 10 ms), here the applied pulse is much shorter and is of 1 ms duration. We observe a clearly defined threshold voltage above which the current rises sharply. We interpret this as reversible electroporation due to electric-field induced formation of nano-scale liquid necks within the membrane [28, 29]. Also, it is known from studies on cells that pore formation is favoured when the electric pulses are relative short and typically below 1 ms [30]. The rate of creation of (transient) nano-pores due to the applied electric field is believed to scale as , where is the applied voltage [29]. Accordingly, the solid curve has the form
| (3) |
where accounts for impurity-induced ohmic conductance. For the constant , we obtain , which is a reasonable value for bilayer membranes [29]. The sharp rise of the current at the critical voltage of about 500 mV shows that the membrane can be used as a voltage stabilization device, similar to a Zener diode, without further manipulation.
IV coupling chemical oscillators via membranes
So far, we have considered the aqueous droplets merely as electrically conducting links between the membranes, which so far were the main players in the concept. Now we want to turn to more complex contents of the droplets themselves. More specifically, we will consider droplets acting as chemical oscillators, and investigate how they may be coupled to each other by the bilayer membranes separating them.
The most thoroughly studied oscillating chemical reaction is the so-called Belousov-Zhabotinski (BZ) reaction [31]. There are several formulations which have been used. Most of them contain an autocatalytic step decomposing bromate () as the main educt, with the help of an oxidizer, such as ions. The reduction of the to provides an optical indicator for this step, which can be enhanced by using the ferroin complex as a carrier for the Fe ions. The progress of the reaction is then accompanied by a color change from deep red to light blue. The product, , acts as a catalyst, or ’promotor’ in this first step. A second step involving malonic acid is coupled to this system, which by re-oxidizing the to produces bromine ions. The latter react with the promotor to yield as the final product. The bromine thus scavenges the promotor of the autocatalytic step, and is therefore considered as the ’inhibitor’.
After having been almost unrecognized after its discovery for many years, the BZ reaction has later become one of the paradigm systems for dynamical systems and self-organization. In spatially extended settings, the BZ reaction gives rise to complex propagating wave patterns, which are reminiscent of spatio-temporal patterns known from other catalytic systems driven far off thermal equilibrium [32, 33]. In small containers, however, where diffusive coupling across the container is strong, they behave like single homogeneous oscillators. It then suggests itself to consider larger ensembles of coupled BZ oscillators as analogous to, e.g., systems of firing neurons.
It has been shown before that systems like that can be nicely realized by using aqueous droplets containing the BZ educts as the oscillators, and coupling them via an oil phase separating the droplets [34]. Both the promotor and the inhibitor are sufficiently hydrophobic to enter the oil phase easily, such that they can diffuse from one droplet to the other if they are sufficiently close. The delicate balance of promotive and inhibitory coupling gives rise to a wealth of oscillation patterns [35]. They strongly differ from the wave-like patterns which are well-known from continuous systems, and are as yet not fully understood. For the concept we are considering here, it is of great interest whether we can distinguish coupling through the bulk oil phase from coupling through a bilayer membrane, and to investigate what types of coupling can be achieved solely via the latter.
We prepared emulsions consisting of droplets containing the BZ educts in aqueous solution, suspended in an oil phase consisting of squalane, with mono-olein at concentrations well above the critical micelle concentration (CMC). The mono-olein serves two purposes. First,it forms dense surfactant layers at the oil/water interface and readily form bilayer membranes, as shown above. Second, the C=C double bond in the mono-olein molecule acts as an efficient scavenger for bromine, since the latter rapidly reacts with this site. The oil phase is thus expected to efficiently suppress coupling between neighboring droplets. As soon as a bilayer has formed, however, coupling is expected to commence rapidly. Most of the mono-olein molecules forming the membrane have been exposed to the reaction products of the BZ system before and will thus be brominated already when the membrane forms. But even if the latter was formed with fresh mono-olein, it would be readily saturated with bromine given its minute thickness, and thus would let further bromine compounds pass easily.
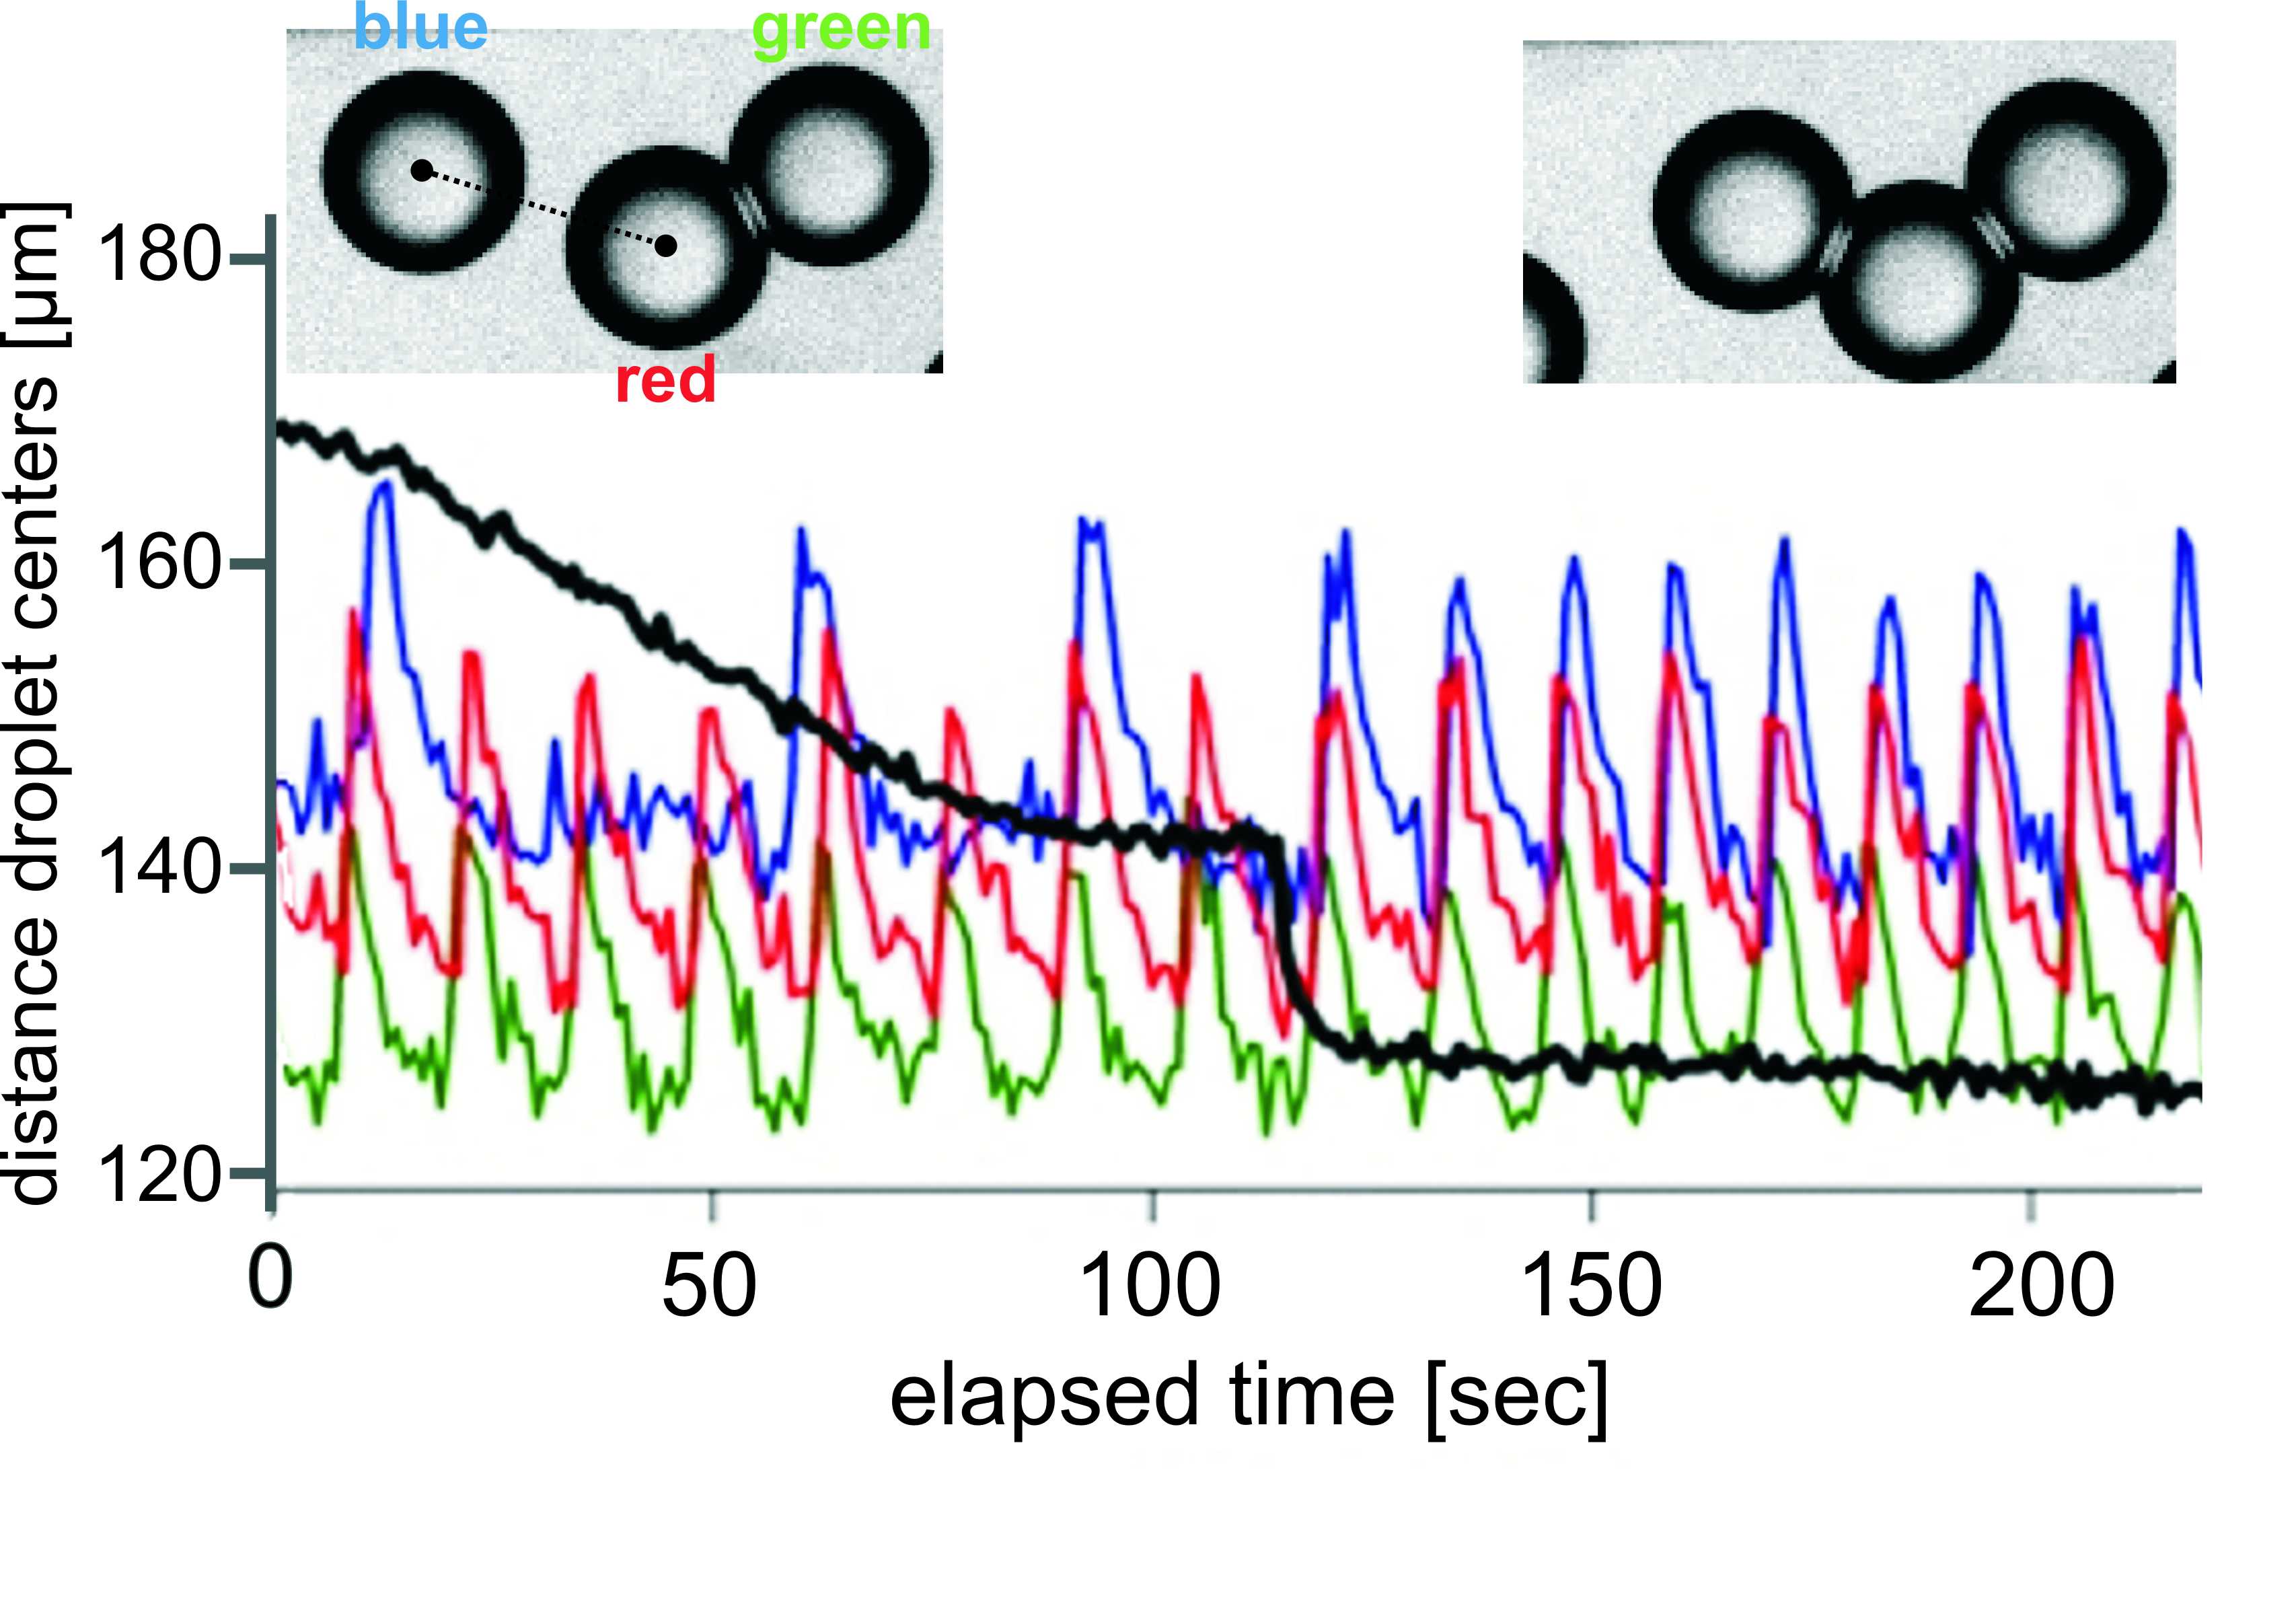
In order to demonstrate membrane-specific coupling, we have observed the oscillation behavior of BZ droplets while they were diffusively moving relative to each other, finally forming bilayer membranes. Fig. 10 shows the transmittance traces of three droplets, exhibiting the spike pattern characteristic of the BZ oscillation. The auto-catalytic reaction step which reduces the strongly absorbing to the almost clear solute leads to a steep increase of the transmittance. This is followed by a smooth decrease due to the gradual re-oxidation of the involving the malonic acid. Initially, only the two droplets whose transmittance traces are shown in red and green are connected by a bilayer membrane. This was known from the direct observation of the membrane forming process. The third droplet, the transmittance trace of which is shown in blue, had some distance to the first pair, with about 50 microns surface separation from the ’red’ droplet. A large oil volume fraction was used in this sample, such that the droplets could diffuse freely for some distance. Clearly, the red and green transmittance traces are phase locked, while the blue trace follows its own pace, showing no sign of influence from the other two for the first seconds shown. The black curve represents the distance of the centers of the ’red’ and ’blue’ droplets, as determined from fitting circles to their images. It shows how the ’blue’ droplet gradually drifts towards the ’red’. At around 100 seconds, the surfaces of the droplets have come so close that the drift is stopped due to the diverging hydrodynamic resistance of the flat sphere-to-sphere contact. At about 113 seconds, the droplet centers are rapidly pulled together, which we interpret as the formation of the bilayer membrane (cf. Fig. 3).
In order to verify this interpretation, we can estimate the contact angle forming at the three phase contact line, from the height of the jump in the droplet center distance. If is the radius of the droplet after the membrane has formed, i.e., the radius of an ideal sphere fitted to the free droplet surface, it is easily shown that the volume of the flattened droplet is given by
| (4) |
where is defined as above. If is the distance of the sphere centers after membrane formation, we furthermore have . Denoting by the radius of the droplets before membrane formation, we finally obtain using volume conservation
| (5) |
From the height of the jump in the black curve in Fig. 10, we obtain and thus degrees, in reasonable agreement with the value found above.
Here we are particularly interested in the change in coupling induced by the membrane formation. Clearly, we see that after the jump in the black curve, all three transmittance traces are firmly coupled. It seems that due to the presence of the mono-olein double bonds in the oil phase, an efficient transport of bromine as a messenger through the oil phase is prevented effectively. Transport through the mono-olein bilayer membrane, however, is obviously still possible.
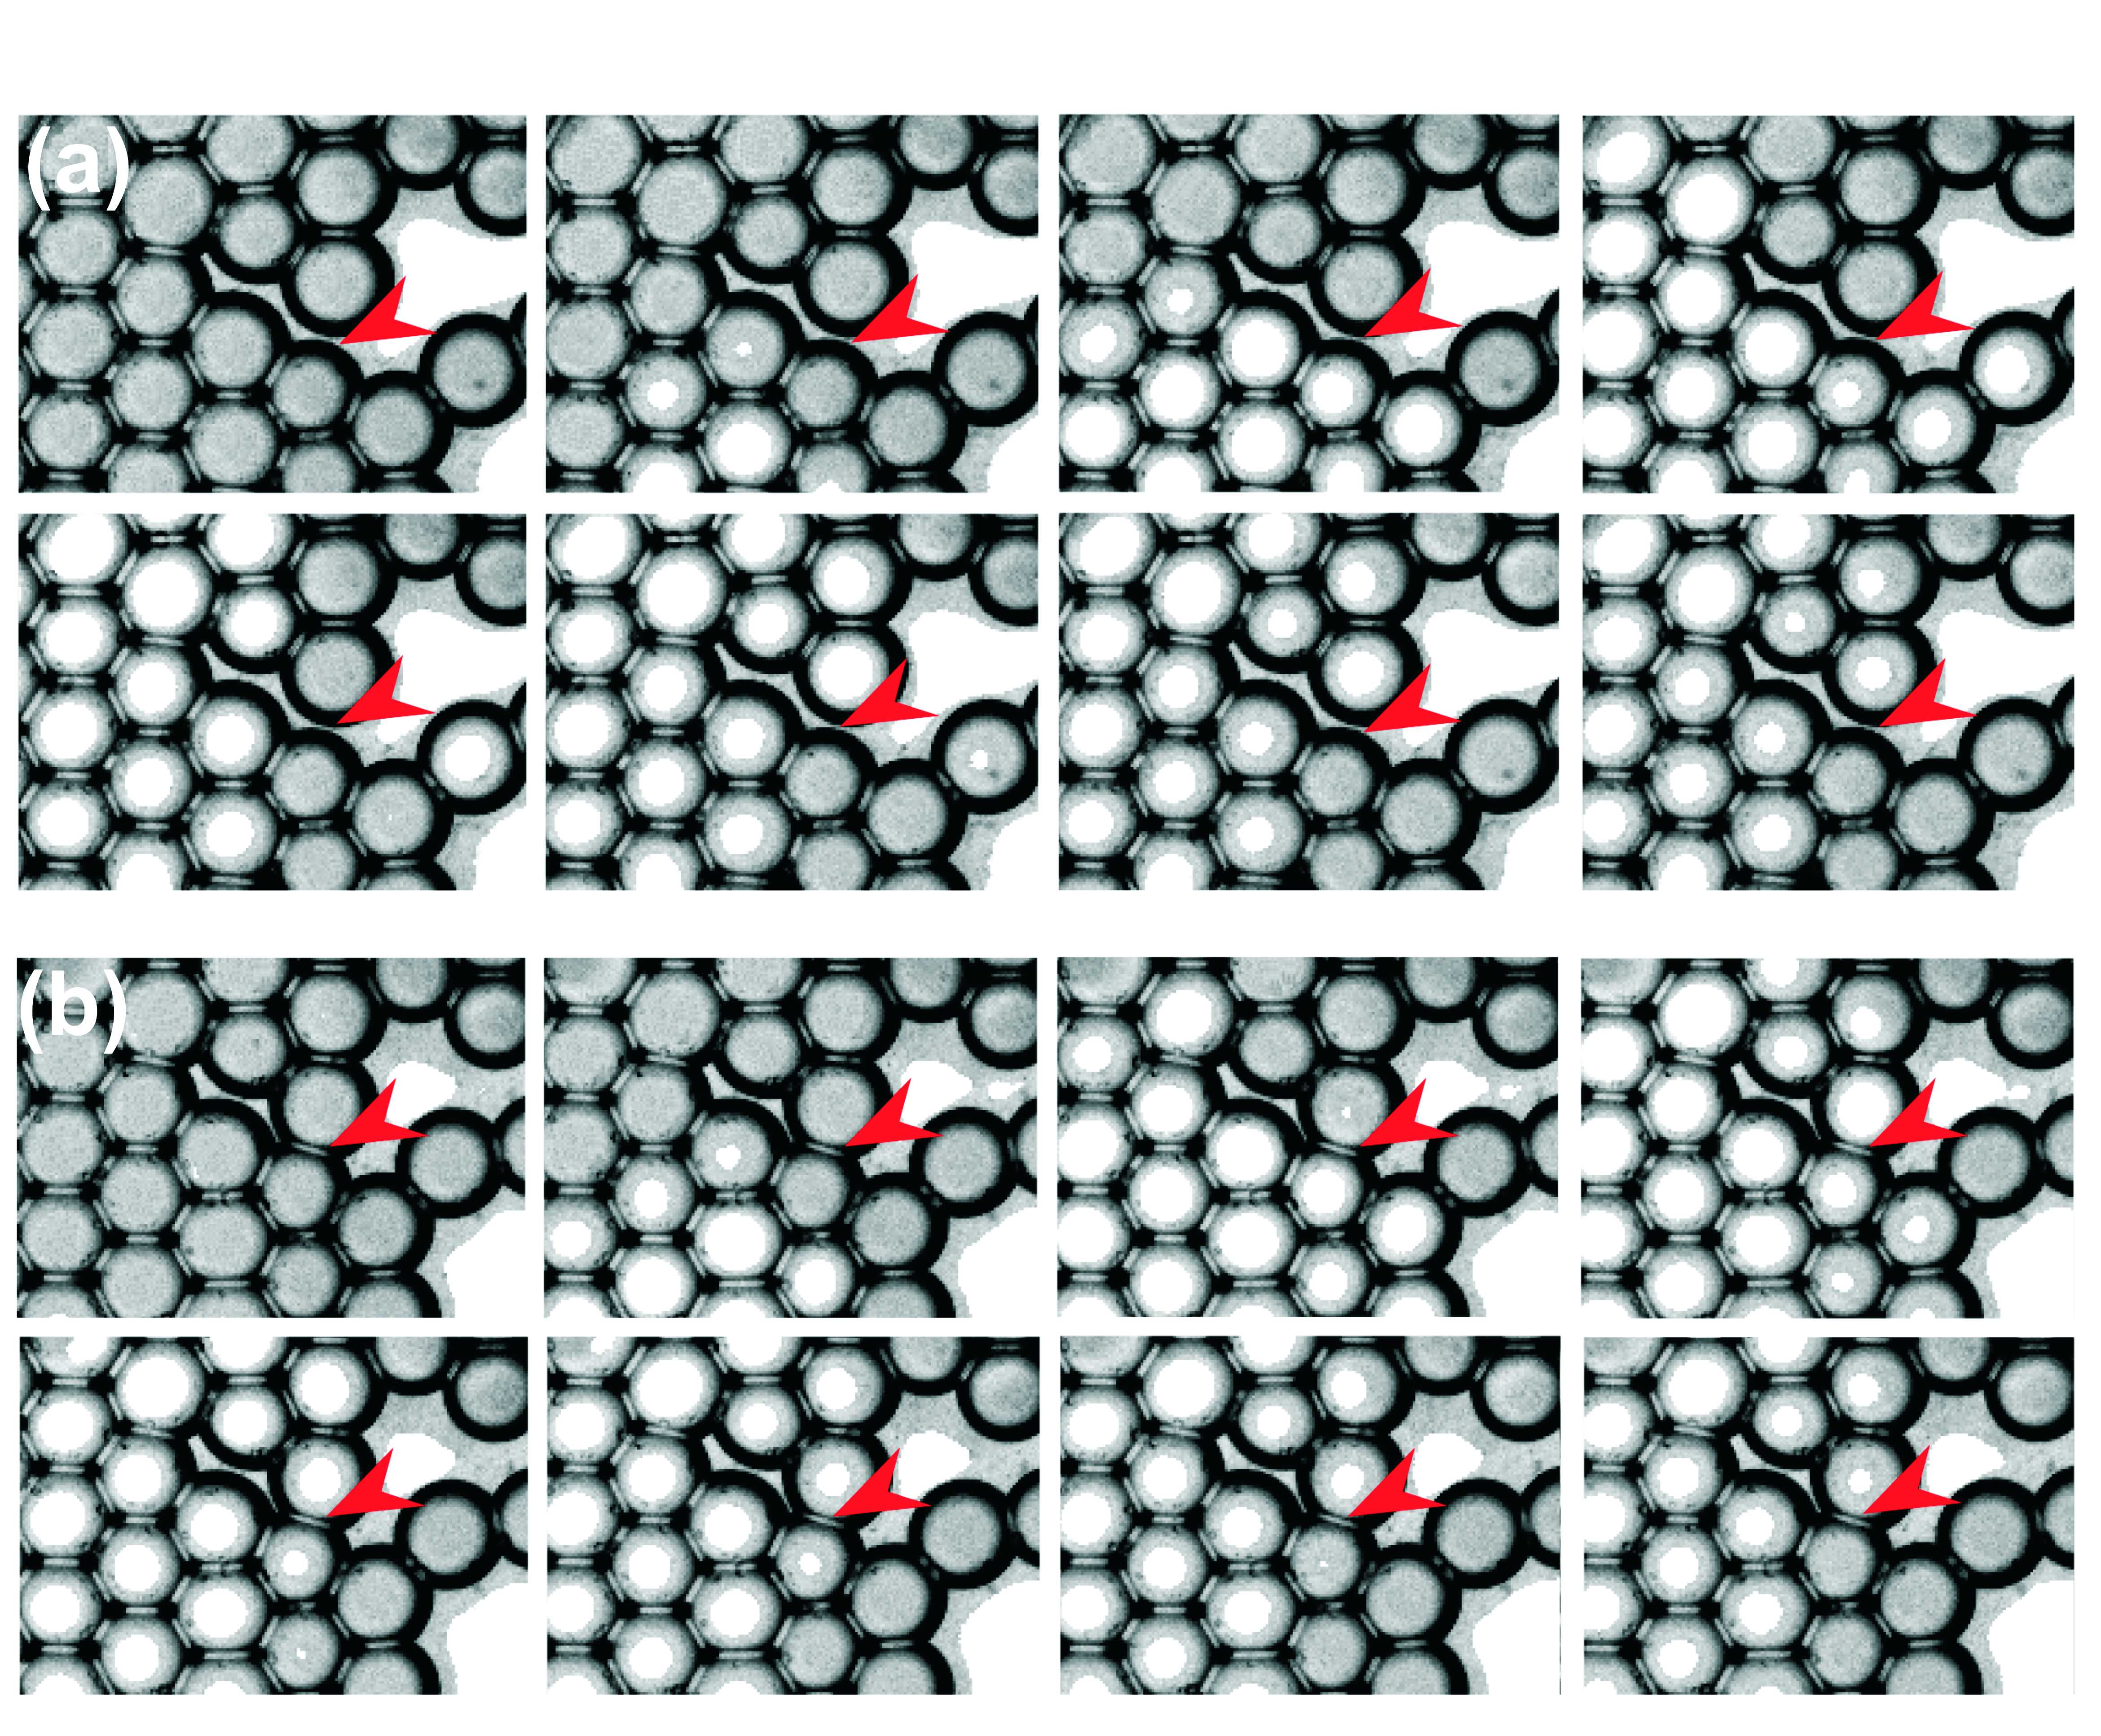
The strong variation in coupling strength by membrane formation can be seen most impressively in excitatory waves propagating in rafts of BZ droplets with a yet incomplete network of bilayer membrane contacts. Fig. 11 shows snapshots of such a wave of excitation (i.e., of a sudden increase in transmittance) which propagates from bottom to top in a moderately dense raft of droplets. The top and bottom row each shows a time lapse representation of a single excitation wave. The red arrow points to a droplet/droplet contact which in the top row has not yet formed a membrane, but in the bottom row it has. A close inspection shows that in the top row, the wave travels around the point of the red arrow. In the bottom row, however, it passes this contact without noticeable hesitation.
V conclusions
Self assembled surfactant bilayer networks in microfluidic channels may be provide a crucial first step towards complex dynamical functions comprising nanoscale or molecular units. More specifically, native surfactant bilayers already offer a range of different electrical behaviour that can be exploited to create wet circuitry. The stability of these objects in micro-fluidic systems is quite encouraging, both in static and in dynamic settings. Their employment as externally controlled scaffolds for synthetic functional molecular units thus appears feasible. The peculiar permeation properties of bilayer membranes for messenger molecules, such as occur in systems of chemical oscillators, furthermore suggests the development of multi-functional, self-assembling dynamic nanoscale systems which open up novel types of soft matter technology, which is conceptually influenced by the physical building principles of living matter, but relies on simple components apt to synthesis and thorough control.
Clearly, there is still a long way to go before emulsion-based self-assembled functional systems superior to conventional top-down devices can be produced. This does not only concern the problem of length scales (which appears favorably addressable, as discussed above), but also the question of how to direct many different droplet contents and membrane compounds into the desired patterns. First steps have been undertaken, but the majority of an exciting pathway is still ahead.
Acknowledgements
This work has been supported by the Deutsche Forschungsgemeinschaft within the Collaborative Research Center on ’Nanoscale Photonic Imaging’ (SFB 755).
References
- [1] H. S. Bennett, J. Res. Natl. Inst. Stand. Technol. 112 (2007) 25
- [2] G. E. Moore, Electronics 38 (1965) 114
- [3] G. M. Altschuler, K. R. Willison J. R. Soc. Interface 5 (2008) 1391
- [4] E. Ben-Jacob, Phil. Trans. R. Soc. Lond. A 361 (2003) 1283
- [5] D. G. Kurth, P. Lehmann, M. Schütte, Proc. Natl. Acad. Sci. USA 97 (2000) 5704
- [6] A. P. Alivisatos et al., Adv. Mat. 10 (1999) 1297
- [7] J.-M. Lehn, Science 295 (2002) 2400
- [8] Ch. M. Drain, Proc. Nat. Acad. Sci. 99 (2002) 5178
- [9] C. Solans et al., Modern aspects of emulsion science (1998) 367
- [10] P. Garstecki et al., Appl. Phys. Lett. 85 (2004) 2649
- [11] M. Seo et al., Langmuir 21 (2005) 4773
- [12] M. J. Fuerstman, P. Garstecki, G. M. Whitesides, Science 315 (2007) 828
- [13] G. M. Whitesides, Nature 442 (2006) 368
- [14] H. Song, D. L. Chen, R. F. Ismagilov, Angew. Chem. 45 (2006) 7336
- [15] O. S. Andersen, Biophys. J. 41 (1983) 119
- [16] W. Drenckhan et al., Coll. Surf. A 263 (2005) 52
- [17] C. Priest, S. Herminghaus, R. Seemann, Appl. Phys. Lett. 88 (2006) 024106
- [18] K. Landfester, Angew. Chem. Int. Ed. 48 (2009) 4488
- [19] E. Surenjav, C. Priest, S. Herminghaus, R. Seemann, Lab Chip 9 (2009) 325
- [20] E. Surenjav, S. Herminghaus, C. Priest, R. Seemann, Appl. Phys. Lett. 95 (2009) 154104
- [21] M. A. Holden, D. Needham, H. Bayley, J. Am. Chem. Soc. 129 (2007) 8650
- [22] A. J. Heron, J. R. Thompson, A. E. Mason, M. I. Wallace, J. Am. Chem. Soc. 129 (2007) 16042
- [23] V. Chokkalingam, S. Herminghaus, R. Seemann, Appl. Phys. Lett. 93 (2008) 254101
- [24] E. B. Dussan, Annu. Rev. Fluid Mech. 11 (1979) 371
- [25] J. P. Dilger, R. Benz, J. Membrane Biol. 85 (1985) 181
- [26] W. L. Hwang, M. A. Holden, S. White, H. Bayley, J. Am. Chem. Soc. 129 (2007) 11854
- [27] S. B. Hladky, D. A. Haydon, Biochim. Biophys. Acta 75 (1972) 294
- [28] J. C. Weaver, IEEE Trans. Diel. Electr. Insul. 10 (2003) 754
- [29] Z. Vasilkoski, A. T. Esser, T. R. Gowrishankar, J. C. Weaver, Phys. Rev. E 74 (2006) 021904
- [30] T. D. Xie, T. Y. Tsong, Biophys. J. 63 (1992) 28
- [31] A. M. Zhabotinsky, Biofizika 9 (1964) 306
- [32] V. Grodetskii et al. Nature 370 (1994) 276
- [33] S. Nettesheim, A. von Oertzen, H. H. Rotermund, G. Ertl, J. Chem. Phys. 98 (1993) 9977
- [34] M. Toiya, V. K. Vanag, I. Epstein, Angew. Chem. Int. Ed. 47 (2008) 7753
- [35] M. Toiya et al., Phys. Chem. Lett. 1 (2010) 1241