Excitonic Rayleigh scattering spectra of metallic single-walled carbon nanotubes
Abstract
We have performed microscopic calculations of the Rayleigh scattering cross section for arbitrary metallic single-walled carbon nanotubes. The focus of our investigations lies on excitonic effects and their influence on the characteristic features in a Rayleigh scattering spectrum. Our approach is based on density matrix theory including tight-binding energies, the carrier-light coupling as well as the carrier-carrier interaction. Due to the refractive index contribution to the scattering cross section, we observe characteristic features in Rayleigh spectra, such as a strong deviation from the Lorentz peak shape and the larger oscillator strength of the lower-lying transition in the double-peaked structure, independently of the chiral angle and the diameter of the investigated nanotubes. We observe excitonic binding energies in the range of for metallic nanotubes with diameters of . The overlap of the excitonic transition with the close-by continuum has a significant influence on the peak shape and a minor influence on the peak intensity ratios. The presented results are in good agreement with recent experimental data.
I Introduction
Absorption, photoluminescence, and Raman scattering are standard spectroscopy methods to reveal optical properties of nanoscale objects.Reich et al. (2004); Jorio et al. (2008) In particular, they have been applied to characterize carbon nanotubes (CNTs) of different chiral angle, diameter, and family.Bachilo et al. (2002); Miyauchi et al. (2004); Telg et al. (2004) In 2004, Sfeir at al.Sfeir et al. (2004) introduced Rayleigh scattering as an additional powerful technique for identifying the optical finger print of individual single-walled CNTs. It allows the investigation of optical properties of individual CNTs, since the weak scattering signal is much easier to measure than e.g. the change in intensity due to the absorption. In combination with electron diffraction data, Rayleigh scattering spectroscopy has successfully been applied to determine the electronic structure of individual CNTs, in particular the predicted peak splitting in metallic tubes due to the trigonal warping effectSaito et al. (2000); Reich and Thomsen (2000) was proven experimentally.Sfeir et al. (2006)
Recently, excitonic effects in metallic nanotubes have been experimentally proved by measuring their Rayleigh spectra.Wang et al. (2007); Berciaud et al. (2010) Despite the large screening, metallic nanotubes were shown to exhibit binding energies around , which is small comparing to semiconducting nanotubes,Wang et al. (2005); Maultzsch et al. (2005) but still larger than the thermal energy at room temperature. The experimental data on excitonic Rayleigh scattering spectra has not yet been complemented by theoretical studies. In Refs. Malić et al., 2007; Malić et al., 2008a we studied free-particle Rayleigh scattering spectra of metallic and semiconducting CNTs showing characteristic features in Rayleigh scattering spectra, which distinguish them from corresponding absorption spectra. In this work, we address the question on how the formation of Coulomb-bound electron-hole pairs, i.e. excitons, influences these features. We perform investigations on (i) the excitonic transition and excitonic binding energy, (ii) the trigonal warping splitting as a function of the diameter and the chiral angle, (iii) the relative oscillator strength in the double-peaked spectra of metallic nanotubes, and (iv) the peak shape in Rayleigh spectra of metallic and semiconducting nanotubes. Finally, we compare our results with recent experimental data.Wu et al. (2007); Berciaud et al. (2010)
II Rayleigh scattering cross section
In our calculations, the Rayleigh scattering cross section is considered for incident light polarized along the nanotube axis accounting for the depolarization effect that strongly suppresses light polarized perpendicular to the nanotube axis.Ajiki and Ando (1993) Here, we briefly summarize the derivation of the Rayleigh scattering cross section: Nanotubes are regarded as long cylinders with diameters small compared to the wavelength of light. Starting from Maxwell equations, the expression for can be derived by solving the scalar wave equation in cylindrical coordinates,Bohren and Huffman (2004) and exploiting the limit of small nanotube radii. The scattering cross section is given by the ratio of the rate
| (1) |
at which energy passes through the scattering surface and the incident irradiance. The rate is determined by the radial component of the Poynting vector of the scattered field . By introducing vector cylindrical harmonicsBohren and Huffman (2004) and with a scalar function , the wave number , and the unit vector parallel to the cylinder axis the problem can be simplified, since these functions satisfy both the vectorial and the scalar wave equation. Once they are calculated, the electric and magnetic field and can be expanded in and . The scalar function is called a generating function for the vector harmonics and . Its choice depends on the investigated system, its symmetries and boundary conditions. For Rayleigh scattering from a cylinder, the scalar function has to satisfy the wave equation in cylindrical polar coordinates. An ansatz for the solution is with as Bessel functions of first and second kind of integral order and with . The quantum number satisfies the boundary conditions between the cylinder and the surrounding medium. Within the limit of small particles, i.e. for cylinders with a diameter much smaller than the wavelength of light ( with as the wave vector of light and as the radius of the cylinder), the scattering cross section per unit length can be expressed via the linear susceptibility as
| (2) |
where is the angular frequency of the light and the speed of light. In contrast to the scattering from a sphere, the cross section is proportional to instead of . This can be traced back to the scattered field , which is given asymptotically by far away from a cylinder, while for a sphere it is . The strength of the Rayleigh scattering is determined by the square of the absolute value of the optical susceptibility . In contrast to the absorption coefficientMalić et al. (2006) , Rayleigh scattering has also a contribution from the real part of and, hence, includes the influence of the resonant refractive index of optical transitions. This leads to important differences in the characteristics of Rayleigh and absorption spectra, which are discussed below.
III Density matrix approach
To obtain the Rayleigh scattering cross section, we need the optical susceptibility , which is the linear response function of the perturbed system. Within the approach for the light-matter interaction, it readsScully and Zubairy (1997)
| (3) |
with the externally driven current density and the vector potential . The current density depends on the Fourier transform of the microscopic polarization and the optical matrix element along the nanotube axis (here, z-axis)Malić et al. (2006); Hirtschulz et al. (2008)
| (4) |
The microscopic polarization is a measure for the transition probability between the two states and , where stand for the band index and for the wave vector. Our approach is formulated within the formalism of second quantization with and as annihilation and creation operators.Hirtschulz et al. (2008) As a result, the knowledge of allows the calculation of the current density , which is required to obtain the optical susceptibility . Finally, determines the Rayleigh scattering cross section , cp. Eq.(2).
The temporal dynamics of is determined within the Heisenberg equation of motion with the Hamilton operator
| (5) |
which determines the dynamics of a physical system. The first two terms describe the non-interacting carrier system in the presence of the external electromagnetic field. In this work, a semiclassical approach is applied, i.e. the charge carriers are treated quantum mechanically, while the field is considered to be classical. The carrier-field interaction reads with the optical matrix elements , the vector potential , the electron mass , and the elementary charge . The carrier-carrier interaction is given by with the Coulomb matrix elements . The single-particle energy required in the free carrier contribution is determined within the nearest-neighbor tight-binding (TB) approach.Reich et al. (2002)
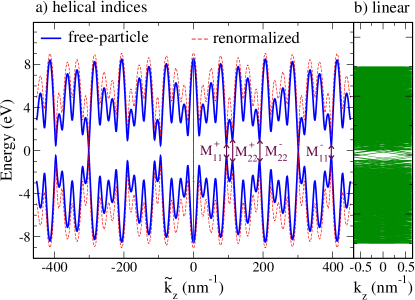
The periodic boundary conditions around the nanotube circumference are considered by restricting the allowed wave vectors to lines in the graphene Brillouin zone (zone-folding approximation).Reich et al. (2004) The two-dimensional wave vector decouples in a continuous component along the nanotube axis and a perpendicular quantized component with the diameter and the subband index . Since nanotubes are described by line groups containing a screw axis, two different sets of quantum numbers are possible: linear and helical quantum numbers.Damnjanović et al. (2003) The linear corresponds to the pure translational subgroup of the line group. Here, stands for the translational period along the tube axis. The linear momentum along the tube axis is a conserved quantity. However, the quasi-angular momentum (with as the number of hexagons in the nanotube unit cells) contains both pure rotations and screw axis operations. As a result, is not fully conserved and Umklapp rules need to be taken into account, when the Brillouin zone or the point are crossed.Reich et al. (2004) In contrast, the helical angular momentum is a conserved quantity, since it corresponds to pure rotations of the nanotube. The number of helical subbands is considerably smaller compared to linear indices, see Fig. 1. The Brillouin zone, however, is larger with , where is the greatest common divisor of the chiral indices and . Figure 1 illustrates the two different sets of quantum numbers by plotting the band structure of the metallic nanotube. In this work, we have applied helical indices taking all subbands and the full Brillouin zone into account.
Note, that for nanotubes with small diameters hybridization effects might play an important role.Blase et al. (1994) Here, the zone-folded tight-binding wave functions can be inappropriate. In particular, these curvature effects have been shown to significantly contribute to the wide family spread in Kataura plots.Jiang et al. (2007) Furthermore, the nearest-neighbor tight-binding approach is known to be a good approximation for transitions close to the point, whereas it is often insufficient to model peak positions at higher energies. However, in our work we focus on characteristic peak shapes and relative peak intensities in Rayleigh scattering spectra for metallic and semiconducting nanotubes, where we expect hybridization effects to play a minor role.
The optical matrix element , cp. Fig.2, and the Coulomb matrix element with the screened Coulomb potential enter into the carrier-light Hamiltonian and the Coulomb Hamiltonian in Eq.(5), respectively. They are calculated analytically by applying the zone-folded tight-binding wave functions .Reich et al. (2004) Then, all necessary ingredients are available to determine the temporal evolution of the microscopic polarization yieldingHirtschulz et al. (2008); Malić et al. (2008b)
| (6) |
This Bloch equation is valid in the limiting case of linear optics, where the driving field is considered to be small resulting in negligible change in occupation in valence and conduction band.Haug and Koch (2004) The dynamics of a system is fully determined by the microscopic polarization . The Coulomb interaction is considered within the Hartree-Fock level.Hirtschulz et al. (2008); Malić et al. (2008b) The Rabi frequency
in Eq.(6) describes the Coulomb renormalized strength of the electron-light interaction. The term includes the renormalization due to the attractive electron-hole interactionHirtschulz et al. (2008); Malić et al. (2008b) . This term describes the formation of excitons. The strong Coulomb interaction in carbon nanotubes mixes the degenerate states at the and point resulting in a partial lifting of the degeneracy and the formation of bright and dark excitonic states.Jiang et al. (2007) In the following, our investigations focus on the optically active (bright) states.
The band gap energy
contains the renormalization due to the electron-electron coupling corresponding to the self-energy correction, see the red curve in Fig. 1. The Coulomb interaction is screened within the static limit of the Lindhard equation.Haug and Koch (2004) The Coulomb matrix elements are calculated within the tight-binding approximation by introducing a regularized Coulomb potential, which is parametrized by the Ohno potential.Zhao and Mazumdar (2004); Jiang et al. (2007) More details can be found in Ref. Malić et al., 2008b. A phenomenological parameter is included into Eq.(6), which determines the linewidth in the calculated spectra.Spataru et al. (2004) The parameter describes dephasing processes resulting e.g. from electron-phonon interaction. The influence of phonons and in particular the investigation of phonon sidebands due to the exciton-phonon coupling is beyond the scope of this work and will be in focus of future studies. However, there are simulations on intersubband transitions predicting weak phonon satellites. Butscher et al. (2004)
The presented approach is similar to the Bethe Salpeter methodJiang et al. (2007) within the Hartree Fock level. The advantage of the density matrix theory lies in particular in the description of the ultrafast relaxation dynamics of non-equilibrium charge carriers allowing a microscopic access to their time and momentum-resolved scattering dynamics.Malic et al. (2009)
IV Rayleigh scattering spectra
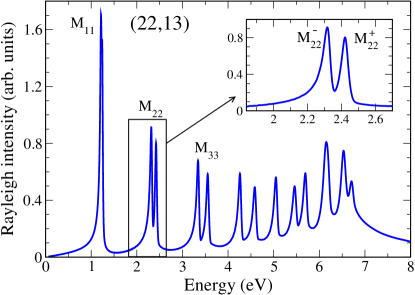
Figure 3 shows exemplary the excitonic Rayleigh scattering spectrum of the metallic nanotube. It is characterized by a series of well-pronounced peaks stemming from optical transitions between conduction and valence bands, cp. the arrows in Fig. 1. For light polarized along the nanotube axis, transitions are allowed between electronic states with due to symmetry-imposed selection rules. As a result, the absorption probability is particularly large for transitions between the first valence band to the first conduction band at a minimal energy , followed by the transition at , etc. The corresponding peaks in the spectrum of metallic tubes are denoted with , etc. Figure 3 illustrates several characteristic features of Rayleigh scattering spectra of metallic carbon nanotubes: (i) a pronounced double-peaked structure of the optical transitions due to the trigonal warping effect, (ii) stronger intensity of the lower-lying transitions, i.e. the oscillator strength of is larger than of , and (iii) an asymmetry towards lower energies corresponding to an enhanced cross section at the lower-energy wing.
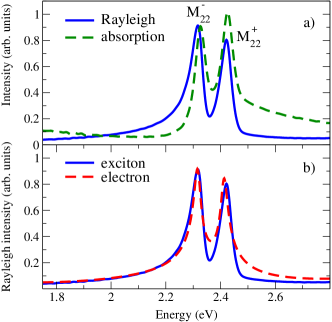
Figure 4a) shows a comparison between the Rayleigh scattering spectrum and the absorption spectrum of the exemplary metallic (22,13) nanotube. The largest difference is obtained with respect to the peak shape. The absorption peaks are Lorentzians reflecting the dependence of the absorption coefficient on . In contrast, the shape of Rayleigh peaks is more complicated showing deviations from the Lorentzian shape on both lower and higher energy side. This can be explained by the interference with the real part of the optical susceptibility, since the Rayleigh scattering cross section is given by , as discussed below in detail. Furthermore, the peaks are slightly red-shifted and the intensity ratio is reversed compared to the absorption spectrum.
Figure 4b) shows the difference between the excitonic and the corresponding free-particle Rayleigh spectrum of the nanotube. The figure illustrates the excitonic effects on Rayleigh scattering spectra: (i) a considerable blue-shift of the free-particle transition energies, as already shown for absorption spectraMalic et al. (2009); Hirtschulz et al. (2008); Malić et al. (2008b), (ii) the asymmetry towards lower energies remains unchanged, when excitonic effects are included, (iii) the intensity ratio of the double-peaked structure is slightly increased, and (iv) the cross section at the higher-energy side of transitions is reduced. In the following paragraphs, the observed characteristic features of excitonic Rayleigh scattering spectra are discussed in detail.
IV.1 Excitonic binding energies
Excitonic effects significantly influence optical properties of carbon nanotubes, as shown for absorption spectra in many previous reports.Spataru et al. (2004); Perebeinos et al. (2004); Chang et al. (2005); Capaz et al. (2006); Jiang et al. (2007); Deslippe et al. (2007); Hirtschulz et al. (2008); Malic et al. (2009) Excitonic binding energies in the range of 300-400 meV have been observed for semiconductingWang et al. (2005); Maultzsch et al. (2005) and in the range of 100 meV for metallic nanotubes.Wang et al. (2007) Our investigation on Rayleigh scattering spectra are in good agreement with these findings. We observe strong shifts due to the formation of bound electron-hole pairs. The binding energies are around 60-80 meV for investigated metallic nanotubes with . For semiconducting nanotubes, we observe excitonic binding energies in the range of 200-400 meV.
Our approach allows the investigation of a large variety of different carbon nanotubes. The calculation of the Kataura plot reveals the diameter and the chirality dependence of the excitonic transition and binding energy. As already reported in literature,Jiang et al. (2007) it exhibits main lines for each transition and a characteristic V-shaped structure reflecting the chirality dependence of the trigonal-warping splitting.
IV.2 Trigonal warping peaks splitting
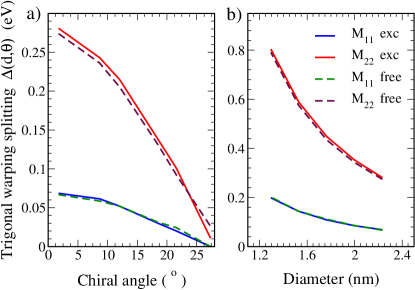
Trigonal warping describes the deviation of the equi-energy contours from circles in the Brillouin zone of graphene around the point.Saito et al. (2000); Reich and Thomsen (2000) Due to its trigonal shape, an energy splitting of Van-Hove singularities stemming from different sides with respect to the point appears. This strongly depends on the orientation of the triangle: The splitting is maximal for nanotubes with a small chiral angle and it vanishes for armchair tubes. Furthermore, the higher the transition energy, the larger is the trigonal warping effect, since the deviation from circles is larger. Figure 5 shows the peak splitting as a function of the chiral angle and the diameter for metallic nanotubes for both the excitonic and the free-particle picture. First, we observe that excitons do not influence the trigonal warping induced splitting. Second, we find that the splitting scales with diameter as at a constant chiral angle . The coefficient only depends on the order of the transition. The larger the diameter, the smaller is the transition energy and the weaker is the trigonal warping effect. For the dependence on the chiral angle , the scaling law is at a nearly constant diameter confirming that the splitting is maximal for zigzag nanotubes with and zero for armchair tubes with .
IV.3 Peak intensity ratio
The lower-lying transitions within the double-peaked structure of Rayleigh scattering spectra show a higher oscillator strength independently of the chiral angle and diameter, i.e. is always higher in intensity than . The intensity ratio increases with decreasing chiral angle. In the limiting case of armchair nanotubes, the ratio is exactly 1 due to vanishing splitting. The described behavior of peak intensity ratios is not significantly influenced by excitons.
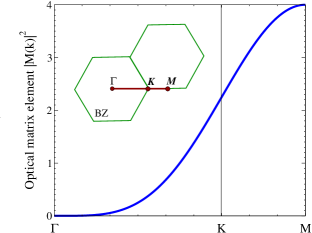
The relative intensities can be explained by the different behavior of the optical matrix element entering in along the two high-symmetry lines and in the graphene BZ.Malić et al. (2008a) The carrier-field interaction turns out to be higher on the side, cp. Fig. 2. As a result, the lower-lying transitions in the double-peaked structure stemming from the sideThomsen and Reich (2007) are amplified. Following this argumentation, the intensity ratio should increase with the order of transition. However, the dependence of the scattering cross section on cancels this effect, since the energetically higher transition is enhanced with respect to resulting in a decrease of the intensity ratio.
Another interesting observation is the inverse intensity ratio in absorption spectra, cp. Fig. 4a). This can be ascribed to the overlap of the peak with the Van-Hove singularity associated with . The high-energy tail of the Van-Hove singularity enhances the intensity of leading to an intensity ratio smaller than 1. In the case of Rayleigh scattering, the overlap with the continuum is smaller, since here the continuum is not characterized by a Van Hove singularity. As a result, the intensity ratio remains larger than 1 - as expected from the family behavior of the optical matrix element.
IV.4 Peak shape
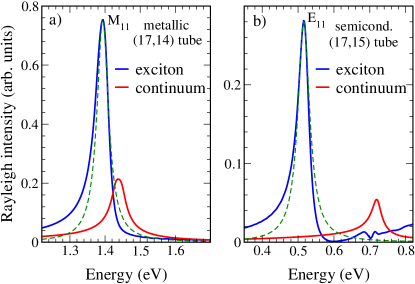
Figures 6 and 7 illustrate the characteristic peak shape of an exemplary metallic and a semiconducting nanotube in excitonic (solid blue lines) and free-particle (solid red lines) Rayleigh scattering and absorption spectra, respectively. For comparison, the figures also show a fit with a Lorentzian in the background (dashed green lines). Rayleigh peaks are shown to be asymmetric towards lower energies reflecting an enhanced cross section at the lower-energy wing, cp. Fig. 6. This can be traced back to the refractive part of the optical susceptibility. The latter exhibits a long tail on the low energy side of each transition, which adds up with the resonant response leading to the observed asymmetry. Both metallic and semiconducting nanotubes exhibit this characteristic asymmetry leading to a considerable broadening of the ”Lorentzian-like” Rayleigh peaksBerciaud et al. (2010) - in contrast to the corresponding peaks in the absorption spectra, cp. Fig. 7.
Furthermore, we observe an interesting feature on the high-energy side of metallic nanotubes. Here, two effects are competing: On the one side, the spectrally decaying refractive index leads to a reduction of the scattering cross section. On the other hand, due to the small binding energies there is an overlap between the excitonic transition and the continuum lifting up the intensity. As a result, the overall reduction is much smaller compared to semiconducting nanotubes, where the excitonic binding energy is large and the overlap with the continuum is negligibly small.
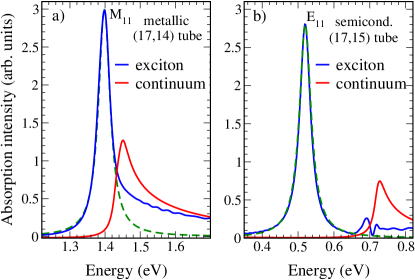
For comparison, Fig. 7 shows the peak shape in excitonic and free-particle absorption spectra for the same exemplary metallic and semiconducting nanotube as in Fig. 6. Since the absorption coefficient is determined only by the imaginary part of the optical susceptibility, the asymmetry to lower energies and the resulting broadening are not present in absorption spectra. The peaks are perfect Lorentzians (dashed line) reflecting the excitonic character of the transition. There is no interference with the refractive part of the response function resulting in narrow peaks with a width of 40 meV determined by the parameter entering Eq.(6). Note that the peak shape of metallic nanotubes exhibits a higher-energy shoulder due to the small excitonic binding energies and the resulting overlap with the continuum.Deslippe et al. (2007)
IV.5 Comparison to experiment
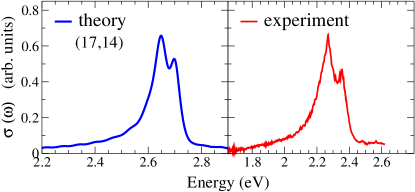
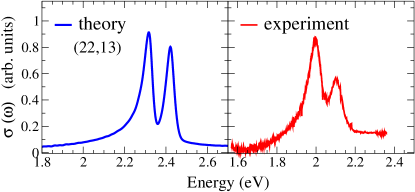
Figure 8 illustrates the good agreement of theoretical and experimental Rayleigh scattering spectra for two exemplary metallic tubes. Including excitonic effects even further improved the comparison with the experiment.Malić et al. (2008a); Wu et al. (2007) As predicted in theory, the experimentally observed Rayleigh spectra show a double-peaked structure with a clearly enhanced scattering intensity at the lower energy wing of transitions. Furthermore, the oscillator strength of the first peak in the double-peaked structure is found to be stronger in intensity. This agrees well with the experiment, where the intensity ratio is even more pronounced. The calculated transition energies, however, differ from the experimental results. They are blue-shifted by approximately compared to the experiment. This deviation can be traced back to the calculation of the band structure within the nearest-neighbor tight-binding approach, which is known to be a good description for transitions close to the point.Reich et al. (2004) For higher energies, however, a considerable blue-shift in comparison to third-nearest neighbor TB or first-principle calculations was observed.Reich et al. (2002) Extensions to third-nearest neighbor TB or extended TB calculationsPopov and Henrard (2004); Jiang et al. (2007) would further improve the comparison with experimental data.
V Conclusions
We have performed microscopic calculations of the Rayleigh scattering cross section including excitonic effects for arbitrary metallic
single-walled carbon
nanotubes. Our approach is based on the density matrix formalism combined with zone-folded tight-binding wave functions.
While the absorption coefficient is given only by the imaginary part of the optical susceptibility, the Rayleigh scattering cross section
also contains the influence of the real part corresponding to refractive index contribution. This leads to characteristic features in Rayleigh
scattering spectra, such as the strong deviation from the Lorentz peak shape exhibiting an enhanced cross section on the lower energy wing, and
the larger oscillator
strength of the lower-lying transition in the double-peaked structure independently of the chiral angle and the diameter of the investigated tubes.
We discuss the influence of excitonic effects on these characteristic features including a study on the trigonal warping splitting.
The
comparison with recent experimental data yields a good agreement with respect
to the characteristic peak shape and the peak intensity ratios.
We acknowledge the support from Sfb 658 and the ERC under grant number 210642. Furthermore, we thank T. F. Heinz (Columbia university) for fruitful discussions.
References
- Reich et al. (2004) S. Reich, C. Thomsen, and J. Maultzsch, Carbon Nanotubes: Basic Concepts and Physical Properties (Wiley-VCH, Berlin, 2004).
- Jorio et al. (2008) A. Jorio, M. Dresselhaus, and G. Dresselhaus, Carbon nanotubes: advanced topics in the synthesis, structure, properties and applications (Springer, 2008).
- Bachilo et al. (2002) S. M. Bachilo, M. S. Strano, C. Kittrell, R. H. Hauge, R. E. Smalley, and R. B. Weisman, Science 298, 2361 (2002).
- Miyauchi et al. (2004) Y. Miyauchi, S. Chiashi, Y. Murakami, Y. Hayashida, and S. Maruyama, Chem. Phys. Lett. 387, 198 (2004).
- Telg et al. (2004) H. Telg, J. Maultzsch, S. Reich, F. Hennrich, and C. Thomsen, Phys. Rev. Lett. 93, 177401 (2004).
- Sfeir et al. (2004) M. Y. Sfeir, F. Wang, L. Huang, C. Chuang, J. Hone, S. P. O’Brien, T. F. Heinz, and L. E. Brus, Science 306, 1540 (2004).
- Saito et al. (2000) R. Saito, G. Dresselhaus, and M. S. Dresselhaus, Phys. Rev. B 61, 2981 (2000).
- Reich and Thomsen (2000) S. Reich and C. Thomsen, Phys. Rev. B 62, 4273 (2000).
- Sfeir et al. (2006) M. Y. Sfeir, T. Beetz, F. Wang, L. Huang, C. M. H. Huang, M. Huang, J. Hone, S. O’Brien, J. A. Misewich, T. F. Heinz, et al., Science 312, 554 (2006).
- Wang et al. (2007) F. Wang, D. J. Cho, B. Kessler, J. Deslippe, P. J. Schuck, S. G. Louie, A. Zettl, T. F. Heinz, and Y. R. Shen, Phys. Rev. Lett. 99, 227401 (2007).
- Berciaud et al. (2010) S. Berciaud, C. Voisin, H. Yan, B. Chandra, R. Caldwell, Y. Shan, L. E. Brus, J. Hone, and T. F. Heinz, Phys. Rev. B 81 (2010).
- Wang et al. (2005) F. Wang, G. Dukovic, L. E. Brus, and T. F. Heinz, Science 308, 838 (2005).
- Maultzsch et al. (2005) J. Maultzsch, R. Pomraenke, S. Reich, E. Chang, D. Prezzi, A. Ruini, E. Molinari, M. S. Strano, C. Thomsen, and C. Lienau, Phys. Rev. B 72, 241402(R) (2005).
- Malić et al. (2007) E. Malić, M. Hirtschulz, F. Milde, Y. Wu, J. Maultzsch, T. F. Heinz, A. Knorr, and S. Reich, phys. status solidi (b) 244, 4240 (2007).
- Malić et al. (2008a) E. Malić, M. Hirtschulz, F. Milde, Y. Wu, J. Maultzsch, T. F. Heinz, A. Knorr, and S. Reich, Phys. Rev. B 77, 045432 (2008a).
- Wu et al. (2007) Y. Wu, J. Maultzsch, E. Knoesel, B. Chandra, M. Y. Huang, M. Y. Sfeir, L. E. Brus, J. Hone, and T. F. Heinz, Phys. Rev, Lett. 99, 027402 (2007).
- Ajiki and Ando (1993) H. Ajiki and T. Ando, J. Phys. Soc. Jpn. 62, 4267 (1993).
- Bohren and Huffman (2004) C. F. Bohren and D. R. Huffman, Absorption and Scattering of Light by Small Particles (Wiley-VCH, Weinheim, 2004).
- Malić et al. (2006) E. Malić, M. Hirtschulz, F. Milde, A. Knorr, and S. Reich, Phys. Rev. B 74, 195431 (2006).
- Scully and Zubairy (1997) M. O. Scully and M. S. Zubairy, Quantum Optics (Cambridge University Press, 1997).
- Hirtschulz et al. (2008) M. Hirtschulz, F. Milde, E. Malić, S. Butscher, C. Thomsen, S. Reich, and A. Knorr, Phys. Rev. B 77, 035403 (2008).
- Reich et al. (2002) S. Reich, J. Maultzsch, C. Thomsen, and P. Ordejón, Phys. Rev. B 66, 035412 (2002).
- Damnjanović et al. (2003) M. Damnjanović, I. Milosević, T. Vuković, and J. Maultzsch, J. Phys. A 36, 5707 (2003).
- Blase et al. (1994) X. Blase, L. X. Benedict, E. L. Shirley, and S. G. Louie, Phys. Rev. Lett. 72, 1878 (1994).
- Jiang et al. (2007) J. Jiang, R. Saito, G. G. Samsonidze, A. Jorio, S. G. Chou, G. Dresselhaus, and M. S. Dresselhaus, Phys. Rev. B 75, 035407 (2007).
- Malić et al. (2008b) E. Malić, M. Hirtschulz, F. Milde, J. Maultzsch, S. Reich, and A. Knorr, phys. status solidi (b) 245, 2155 (2008b).
- Haug and Koch (2004) H. Haug and S. W. Koch, Quantum Theory of the Optical and Electronic Properties of Semiconductors (World Scientific, 2004).
- Zhao and Mazumdar (2004) H. Zhao and S. Mazumdar, Phys. Rev. Lett. 93, 157402 (2004).
- Spataru et al. (2004) C. D. Spataru, S. Ismail-Beigi, L. X. Benedict, and S. G. Louie, Phys. Rev. Lett. 92, 077402 (2004).
- Butscher et al. (2004) S. Butscher, J. Forstner, I. Waldmuller, and A. Knorr, phys. status solidi (b) 241, R49 (2004).
- Malic et al. (2009) E. Malic, M. Hirtschulz, S. Reich, and A. Knorr, Phys. Status Solidi RRL 3, 196 (2009).
- Perebeinos et al. (2004) V. Perebeinos, J. Tersoff, and P. Avouris, Phys. Rev. Lett. 92, 257402 (2004).
- Chang et al. (2005) E. Chang, G. Bussi, A. Ruini, and E. Molinari, Phys. Rev. B 72, 195423 (2005).
- Capaz et al. (2006) R. B. Capaz, C. D. Spataru, S. Ismail-Beigi, and S. G. Louie, Phys. Rev. B 74, 121401 (2006).
- Deslippe et al. (2007) J. Deslippe, C. D. Spataru, D. Prendergast, and S. G. Louie, Nano Lett. 7, 1626 (2007).
- Thomsen and Reich (2007) C. Thomsen and S. Reich, Raman Scattering in Carbon Nanotubes in Light Scattering in Solids IX, ed. by M. Cardona and R. Merlin (Springer, Berlin, 2007).
- Popov and Henrard (2004) V. N. Popov and L. Henrard, Phys. Rev. B 70, 115407 (2004).