Observation of lattice softening at in the FeSe0.5Te0.5 superconductor
Abstract
Polycrystalline samples of FeSe0.5Te0.5 were synthesized using a conventional solid-state reaction method. The onset of bulk superconductivity transition was confirmed by SQUID magnetometry at 12.5 K. 57Fe Mössbauer spectra in transmission geometry were recorded at temperatures between 6.0 and 320 K. Both the isomer shift and the total absorption started to drop about , indicating a softening of the lattice. The drop is estimated to correspond to at least 60 K from the original Debye temperature K. Seebeck measurements indicate that the samples are -type conductors at low temperatures with a cross-over to -type conductivity around 135 K. The zero Seebeck coefficient is seen below K.
keywords:
A. Pnictide superconductors D. Lattice softening E. 57Fe Mössbauer spectroscopy E. Hyperfine interactions1 INTRODUCTION
Superconductivity above 20 K in iron pnictides was reported two years ago.[1] Since then the number of iron-pnictide phases has grown considerably, but the highest critical temperature has remained below 60 K. However, the value falls short only of that of the high- superconductive cuprates. Nonetheless, Fe as a natural constituent in superconductive materials is fascinating and somewhat unexpected. In none of these iron-pnictide phases does iron order magnetically in the superconductive state, though some non-superconductive parent phases exhibit antiferromagnetic spin-density waves.[2] Some of the superconductive iron phases have simple structures, e.g. the chalcogenide phase FeSe.[3] Like the high- cuprate superconductors Fe-based phases also have layered structures, in which the superconducting charge carriers reside at edge-shared Fe ( Group 15 or 16 element) tetrahedra. The geometry is important for both types of superconductive phases. Cuprate superconductors with puckered CuO2 layers have generally lower values than those with flat ones, whereas for the Fe-based superconductors the highest values occur when the tetrahedra are closest to the regular shape.[4] In a recent work which incorporates also FeSe the distance between the atom and the nearest Fe layer seems to be a crucial geometrical parameter for determining the value.[5] However, the actual mechanism behind the superconductivity transition is not known yet.
The presence of Fe has opened the possibility to perform 57Fe-Mössbauer-spectroscopy measurements and thereby to determine the spin and valence state of the Fe atoms. Various spectra from superconductive samples have established that the spin state of Fe is zero or close to zero.[6, 7] This is true at least within the characteristic time-scale of ns of the 57Fe transition. However, presence of antiferromagnetic fluctuations has been suggested[8, 9] but may be difficult to be detected by Mössbauer spectroscopy. A recent high-pressure experiment on the LaFeAsO phase showed that there is a strong connection between the spin-density-wave type magnetism of the non-superconducting state and the seemingly zero-Fe-spin spectra of the superconducting state.[10]
In this work we report findings of the Mössbauer and Seebeck measurements performed on both sides of the critical temperature of FeSe0.5Te0.5 to record possible changes in the hyperfine parameters upon passing .
2 Experimental
Samples of the FeSe0.5Te0.5 phase were synthesized from stoichiometric ratios of high-purity Se (99.99%), Fe (99.9%) and Te (99.8%) powders. The powders were sealed under vacuum in a quartz tube and fired for 20 h at 600 ∘C. After an intermediate grinding the samples were fired again at 650 ∘C for 20 h and furnace-cooled down to 300 K.
Bulk superconductivity was confirmed by measuring the diamagnetic signal from approximately 20 mg of the sample with a superconducting quantum interference device (SQUID: Quantum Design, MPMS-XL) in both the zero field-cooled and field-cooled (10 Oe) regimes.
X-ray diffraction patterns were measured in an ordinary geometry using Cu radiation (PanAnalytical X’Pert Pro MPD diffractometer) to check the sample purity. Rietveld analysis was done to confirm the tetragonal P4/nmm structure of superconductive -FeSe phase.
The Mössbauer measurements were carried out using a 25 mCi 57Co: source (Cyclotron Co, purchased in April 2009) at fixed temperatures between 6.0 and 320 K, in transmission geometry with a maximum Doppler velocity of 3.0 mm/s. Additional measurements using maximum Doppler velocities of 8 and 10 mm/s were done to check the presence of magnetic impurities. Cooling of the sample was achieved with an Oxford CF506 continuous-flow cryostat with liq. N2 and liq. He as cooling agents. With the amount of He allocated for the measurements spectra from 6.0 to 30 K could be collected, leaving the interval of 30 - 77 K uncovered. The two main components of the spectra were fitted using the chemical isomer shift relative to -Fe (), the relative intensity (), the quadrupole coupling constant (), and the resonance line width () which was constrained to be equal for all components. A weak magnetic component due to magnetite was observed, but was left unfitted in most spectra as the most intensive lines were outside the -mm/s velocity range.
Seebeck measurements were done (using a self-made equipment) upon heating the sample from 4.0 to 300 K in steps of K. A sintered sample specimen was ground into shape of a thin parallelepiped of mm3 and inserted between two Cu sample holders using Ag paste. A resistor hidden inside one of the Cu holders was heated to achieve a temperature gradient up to K over the sample. Additional Seebeck data in applied fields of 0 and 8 T were collected using a physical-property measurement system (Quantum Design, PPMS) equipped with a self-made sample puck. The same sample as above was used.
3 Results and Discussion
Figure 1 shows the X-ray diffraction pattern for the FeSe0.5Te0.5 sample. It is readily indexed by the PbO-type tetragonal structure of space group P4/nmm (isostructural with FeSe). Impurity peaks assigned mainly to hexagonal Te-substituted -FeSe[6] and/or Fe7Se8 are observed. Additionally, presence of Fe3O4, confirmed by SQUID and Mössbauer spectroscopy measurements, is seen.
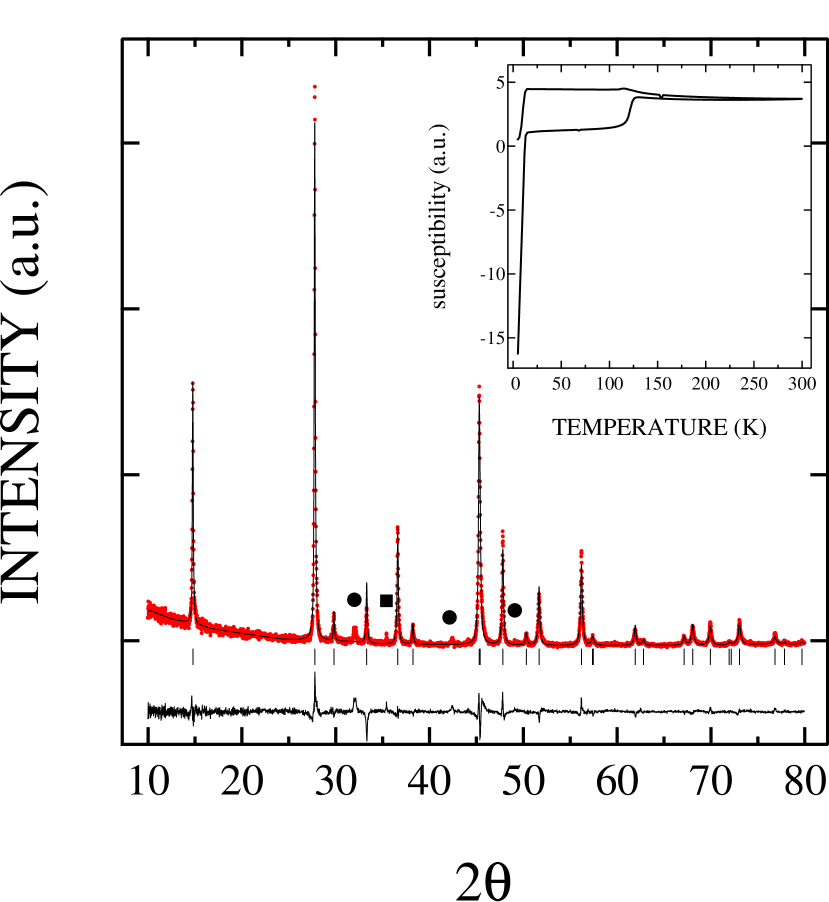
The magnetization-versus-temperature data obtained by SQUID measurements in the field-cooled and zero-field-cooled regimes confirm onset of bulk superconductivity at 12.5 K for the FeSe0.5Te0.5 sample, see the inset in Fig. 1. The positive background is due to the presence of magnetic impurity phases, i.e. Fe3O4. The Verwey transition[11] of Fe3O4 at K is also seen in the susceptibility data.
The Seebeck data are shown in Fig. 2.

The negative sign indicates that the sample is an -type conductor. Below the transition into the superconducting state the Seebeck coefficient becomes zero at 10.6 K. Above K positive values for the Seebeck coefficient are obtained. Using an external field of 8 T the low-temperature Seebeck data are clearly shifted by K towards lower temperatures. The shift is in accord with the rather high second critical field . Similar results were reported in Ref. [12] for samples of Fe1+xTe1-ySey.
Mössbauer spectra obtained from FeSe0.5Te0.5 at selected temperatures are shown in Fig. 3. Components due to two phases are readily observed. The paramagnetic main component covering 88% of the spectral intensity is due to FeSe0.5Te0.5 (Component 1). It has an isomer shift of mm/s at 300 K and a quadrupole splitting of mm/s, i.e. similar to the values obtained for FeSe,[6] but was somewhat larger, reflecting a higher deformation of the coordination tetrahedron around Fe upon introducing Te.[13]
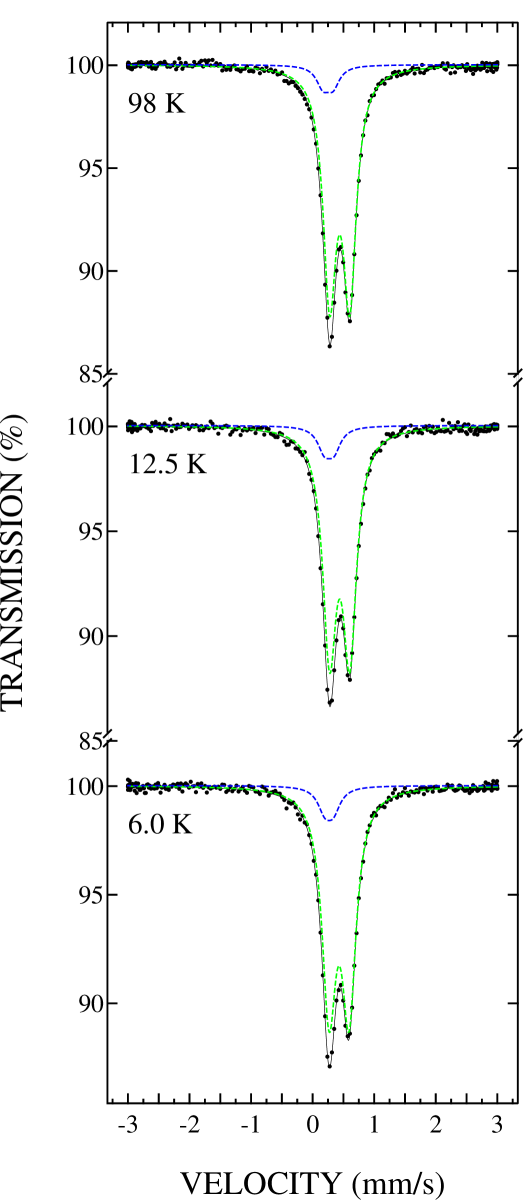
Another paramagnetic component (Component 2) with mm/s covers % of the spectral intensity. It has a quadrupole splitting of 0.16 mm/s. In the XRD pattern for a FeSe sample peak positions due to -FeSe/Fe7Se8 impurities are observed.[6] When comparing the pattern with that of the present FeSe0.5Te0.5 sample almost identical impurity peaks are observed, indicating that Component 2 is due to Te-substituted Fe7Se8 or -FeSe. Fe7Se8 is magnetically ordered at room-temperature, but the absence of magnetic order is in accord with the fact that Te substitution is detrimental for the magnetic order in the Fe-Se system. [14] In a high-velocity spectrum (not shown) % of Fe3O4 can be discerned. No other magnetic phases were observed.
As Component 2 interferes with Component 1 we tried the following three fitting schemes when analyzing the spectra of the most interesting region (6-100 K): (i) Releasing all fit parameters of Components 1 and 2, (ii) Fixing the peak height and quadrupole coupling constant of Component 2 to an average of the K region and (iii) Fixing the isomer shift and quadrupole coupling constant of Component 2 to an average value of the K region. The general features as presented below for Component 1 did not depend on the choice of scheme. Fitting scheme (iii) gave the ”purest” behavior, as no specific temperature evolution was expected for the impurity component, except that its peak height should vary as a function of the temperature, which was violated by scheme (ii). In the end, we decided to present the results as obtained according to scheme (i), in order to avoid excessive fixing of fit parameters.
The isomer shift () of Component 1 in FeSe0.5Te0.5 is plotted against temperature in Fig. 4.

The shift obtained from the fitting includes contributions from both the chemical shift and the second-order Doppler shift, which is known to increase convexely upon decreasing temperature, due to gradual depopulation of the excited phonon states.[15] However, it should be constant at low temperatures, because of the quantum mechanical zero-point motion. The chemical shift should not depend on temperature. An ordinary convex temperature evolution is indeed traced down to where a distinct drop is observed. The drop indicates that the Debye temperature () is decreasing, that is the lattice undergoes a softening. The actual size of the drop can only be estimated, as there is no leveling-off visible at 6 K. The temperature dependence for is given by:[16]
| (1) |
where is the velocity of light, the Boltzmann constant, the mass of the 57Fe atom, and the temperature-independent part, i.e the chemical shift. A fit with Eq. 1 to the data of Fig. 4 yields K and mm/s. By fixing at the values 0.43 mm/s and setting K the softening of the lattice is readily visualized: The drop in the second-order Doppler shift of at least mm/s corresponds to a drop of K in the Debye temperature (the lower curve in Fig. 4).
The drop in is also visible in the total absorption () for Component 1, given as the component intensity times the line width , as shown in Fig. 5. The drop in absorption begins slightly above . A softening of the lattice will decrease the recoil-free fraction and hence the absorption will also decrease.

A part of the leveling-off of the absorption could be due to the fact that the sample is rather thick, but that cannot explain the actual drop. Because of possible sample-thickness corrections the absorption data can only be used for qualitatively estimating and the drop at . The standard expression for the recoil-free fraction is given by:[17]
| (2) |
where the recoil energy eV for the 14.4 keV quantum of 57Fe. The absorption data of Fig. 5 should be proportional to the recoil-free fraction in the absorber, i.e. , where is a parameter depending on the sample thickness, signal-to-noise ratio for the detected quanta etc. Thus:
| (3) |
Eq. 3 is plotted together with the experimental data against temperature in Fig. 6. The data below 77 K where parameter is no longer constant are omitted in Fig 6 because of the leveling-off of absorption data. The slope of the curve strongly depends on the Debye temperature. The best fit was obtained for K, which is much lower than the estimate based on the second-order Doppler shift. In fact, due to possible ”hidden” temperature-dependence in parameter , the K is likely to be more reliable.

At low temperatures Eq. 2 for the recoil-free fraction can be approximated with:
| (4) |
Upon inserting the estimated K in Eq. 4 the recoil-free fraction before the drop is estimated at . About the absorption (shown in Fig. 5) drops from 5.63 to 5.45, which corresponds to a drop in from 0.881 to 0.853. Upon inserting the latter into Eq. 4 we get K, resulting in a drop of K in . If the 460-K estimate is used the recoil-free factors before and after the drop are 0.93 and 0.90, respectively and the corresponding drop in is 140 K.
The quadrupole splitting of Component 1 (not shown) increases from mm/s to 0.33 mm/s as temperature is decreased below 100 K. A leveling-off at 0.33 mm/s, possible followed by a tiny drop of 0.01 mm/s around is observed. A small relaxation in the position of Fe or Se/Te atoms is all that is needed to cause a change in . The quantity depends on the nearest-neighbor distance () as . That is, it is extremely sensitive to movements of the atoms. The movements need not to be commensurable, as the Mössbauer-resonant nuclei act as a local probes.
We have also synthesized samples of the -FeSe phase and observed a parallel drop in about its K.[19] We recently reported drops in both the isomer shift and the absorption below K for the superconducting LiFeAs phase.[18] In this phase the drops were preceded by a lattice stiffening, giving the low-temperature absorption and isomer-shift curves concave shapes. Generally some change in the lattice stiffness, upon passing , might indicate that the BCS mechanism of phonon-mediated coupling between the superconducting charge carriers are active. However, the present lattice softening could be the result of other mechanisms as well. In particular, antiferromagnetic fluctuations about have been observed in some of the iron-based pnictide and chalcogenide phases by inelastic neutron scattering, cf. Refs. [8, 20]. A possible connection between such fluctuations and the lattice softening was in fact suggested recently.[21] At the same time inelastic X-ray-scattering experiments point towards the importance of phonons in these phases.[22, 23]
4 CONCLUSIONS
57Fe Mössbauer measurements of the FeSe0.5Te0.5 phase reveal a paramagnetic quadrupole doublet with an isomer shift compatible with zero spin Fe2+. Upon decreasing the temperature below K a softening of the lattice occurs. The softening corresponds to about 60 K decrease in the Debye temperature from its original value of K as determined by the isomer-shift vs. temperature data.
5 ACKNOWLEDGMENTS
Mr M. Lehtimäki and Mr T. Tynell are acknowledged for their help with performing the XRD and Seebeck characterizations. Prof. P. Paturi of Wihuri research center is acknowledged for her contribution to the in-field Seebeck measurements. Mr S. Fröjdö is acknowledged for his assistance with the sample synthesis. This work was partially supported by Tekes (No 1726/31/07) and Academy of Finland (No. 126528).
References
- [1] Y. Kamihara, T. Watanabe, M. Hirano, and H. Hosono, J. Am. Chem. Soc. 130 (2008) 3296.
- [2] M. Ishikado, R. Kajimoto, S. Shamoto, M. Arai, A. Iyo, K. Miyazawa, P.M. Shirage, H. Kito, H. Eisaki, S.W. Kim, H. Hosono, T. Guidi, R. Bewley, and S.M. Bennington J. Phys. Soc. Jpn. 78 (2009) 043705.
- [3] F.C. Hsu, J.Y. Luo, K.W. Yeh, T.K. Chen, T.W. Huang, P.M. Wu, Y.C. Lee, Y.L. Huang, Y.Y. Chu, D.C. Yan, and M.K. Wu, Proc. Natl. Acad. Sci. USA 105 (2008) 14262.
- [4] C.-H. Lee, A. Iyo, H. Eisaki, H. Kito, M.T. Fernandez-Diaz, T. Ito, K. Kihou, H. Matsuhata, M. Braden, and K. Yamada, J. Phys. Soc. Jpn. 77 (2008) 083704.
- [5] H. Okabe, N. Takeshita, K. Horigane, T. Muranaka, and J. Akimitsu, cond-mat.str-el arXiv:1002.1832v2.
- [6] A. Błachowski, K. Ruebenbauer, J. Żukrowski, J. Przewoźnik, K. Wojciechowski, and Z.M. Stadnik, J. Alloys Comp. 494 (2009) 1.
- [7] S. Kitao, Y. Kobayashi, S. Higashitaniguchi, M. Saito, Y. Kamihara, M. Hirano, T. Mitsui, H. Hosono, and M. Seto, J. Phys. Soc. Jpn. 77 (2008) 103706.
- [8] A.D. Christainson, E. A. Goremychkin, R. Osborn, S. Rosenkranz, M.D. Lumsden, C.D. Malliakas, I.S. Todorov, H. Claus, D.Y. Chung, M.G. Kanatzidis, R.I Bewley, and T. Guidi, Nature 456 (2008) 930.
- [9] S. Iikubo, M. Fujita, S. Niitaka, and H. Takagi, J. Phys. Soc. Jpn. 78 (2009) 103704.
- [10] T. Kawakami, T. Kamatani, H. Okada, H. Takahashi, S. Nasu, Y. Kamihara, M. Hirano, and H. Hosono, J. Phys. Soc. Jpn. 78 (2009) 123703.
- [11] E.J.W Verwey, Nature (London) 144 (1939) 327.
- [12] I.Pallecchi, G. Lamura, M. Tropeano, M. Putti, R. Viennois, E. Giannini, and D. Van der Marel, Phys. Rev. B 80 (2009) 214511.
- [13] M. Tegel, C. Löhnert, and D. Johrendt, Solid State Commun. 150 (2010) 383.
- [14] P. Terzeff, Physica 103B (1981) 158.
- [15] N.N. Greenwood and T.C. Gibb in Mössbauer Spectroscopy (Chapman & Hall, London 1971), pp. 50-53.
- [16] S. Nasu and Y. Murakami, Phys. Stat. Sol. (b) 46 (1971) 711.
- [17] N.N. Greenwood and T.C. Gibb in Mössbauer Spectroscopy (Chapman & Hall, London 1971), pp. 10-11.
- [18] W. B. Gao, J. Lindén, X. C. Wang, C. Q. Jin, T. Tohyama, M. Karppinen, and H. Yamauchi, Solid State Commun. 150 (2010) 1525.
- [19] J. Lindén, J.-P. Libäck, M. Karppinen, and H. Yamauchi, unpublished.
- [20] Jinsheng Wen, Guangyong Xu, Zhijun Xu, Zhi Wei Lin, Qiang Li, Ying Chen, Songxue Chi, Genda Gu, and J.M. Tranquada, Phys. Rev. B 81 (2010) 100513R.
- [21] Taner Yildirim, Physica C 469 (2009) 425.
- [22] Chul-Ho Lee, K. Kihou, K. Horigane, S. Tsutsui, T. Fukuda, H. Eisaki, A. Iyo, H. Yamaguchi, A.Q.R. Baron, M. Braden, and K. Yamada, J. Phys. Soc. Jpn. 79 (2010) 014714.
- [23] D. Reznik, K. Lokshin, D. C. Mitchell, D. Parshall, W. Dmowski, D. Lamago, R. Heid, K.-P. Bohnen, A. S. Sefat, M. A. McGuire, B. C. Sales, D. G. Mandrus, A. Subedi, D. J. Singh, A. Alatas, M. H. Upton, A. H. Said, A. Cunsolo, Yu. Shvyd’ko, and T. Egami Phys. Rev. B 80 (2009) 214534.