Constraining the Outburst Properties of the SMBH in Fornax A through X-ray, Infrared, and Radio Observations
Abstract
Combined Spitzer, Chandra, XMM-Newton, and VLA observations of the giant radio galaxy NGC 1316 (Fornax A) show a radio jet and X-ray cavities from AGN outbursts most likely triggered by a merger with a late-type galaxy at least 0.4 Gyr ago. We detect a weak nucleus with an SED typical of a low-luminosity AGN with a bolometric luminosity of ergs s-1. We examine the Spitzer IRAC and MIPS images of NGC 1316. We find that the dust emission is strongest in regions with little or no radio emission and that the particularly large infrared luminosity relative to the galaxy’s K-band luminosity implies an external origin for the dust. The inferred dust mass implies that the merger spiral galaxy had a stellar mass of M⊙ and a gas mass of M⊙. X-ray cavities in the Chandra and XMM-Newton images likely result from the expansion of relativistic plasma ejected by the AGN. The soft (0.5-2.0 keV) Chandra images show a small (1.6 kpc) cavity coincident with the radio jet, while the XMM-Newton image shows two large X-ray cavities lying 320 (34.8 kpc) east and west of the nucleus, each approximately 230 (25 kpc) in radius. Current radio observations do not show emission within these cavities. The radio lobes lie at radii of (93.3 kpc) and (101 kpc), more distant from the nucleus than the detected X-ray cavities. The relative morphology of the large scale 1.4 GHz and X-ray emission suggests they were products of two distinct outbursts, an earlier one creating the radio lobes and a later one producing the X-ray cavities. Alternatively, if a single outburst created both the X-ray cavities and the radio lobes, this would require that the radio morphology is not fully defined by the 1.4 GHz emission. For the more likely two outburst scenario, we use the buoyancy rise times to estimate an age for the more recent outburst that created them of 0.1 Gyr and the work done by the expanding plasma to create the X-ray cavities to estimate the outburst’s energy to be ergs. The present size and location of the radio lobes implies that the outburst that created them happened Gyr ago and released ergs.
Subject headings:
galaxies: active — galaxies: individual (NGC 1316) — galaxies: structure — infrared: galaxies — radio continuum: galaxies — X-rays: galaxies1. Introduction
NGC 1316 (Fornax A) is one of the nearest and brightest radio galaxies with radio lobes spanning 33 (Ekers et al. 1983). It lies on the outskirts of the Fornax cluster at a distance of 22.71.8 Mpc, based on a distance modulus of 31.660.17 (Tonry et al. 2001).111We adopt and therefore revise the Tonry et al. (2001) distance which used . This gives a scale of kpc-1 at the distance of NGC 1316. Early optical observations of NGC 1316 (Evans 1949) revealed dust lanes in the nuclear region, leading Shklovskii (1963) to hypothesize that radio lobes might be powered by accretion of interstellar gas onto the nucleus. More extensive optical observations led Schweizer (1980) to classify NGC 1316 as a D-type galaxy (Morgan 1958) with an elliptical-like spheroid embedded in a large envelope.
Schweizer further suggested that NGC 1316’s disturbed morphology may be due to one or more low-mass gas-rich mergers, occurring over the last 2 Gyr. Mackie & Fabbiano (1998) concluded, from more recent optical observations, in combination with ROSAT data, that NGC 1316 had undergone either a major merger more than 1 Gyr ago or a merger with a low-mass gas-rich galaxy about 0.5 Gyr ago. NGC 1316 exhibits other signs of at least one merger, including loops of H filaments resembling tidal tails with projected lengths as large as 10 (65.4 kpc) and a gas disk rotating much faster than the stellar spheroid and at an angle to it, indicating a likely external origin (Xilouris et al. 2004, Schweizer 1980). Goudfrooij et al. (2001) used globular clusters to date any major mergers to between 1.5 and 4 Gyr ago, but the age and type of merger (or mergers) still remain uncertain.
Multiwavelength observations can set constraints on the merger event. Radio emission, from the radio jet and lobes, is expected to be powered by accretion onto the central supermassive black hole (SMBH), which can be enhanced by the infall of material from a merger. The expanding radio plasma can create cavities in the surrounding hot gas, which are seen as decrements in the X-ray emission. By measuring the work done by the expanding radio plasma (McNamara et al. 2000, Churazov et al. 2002), we can constrain the energy produced by the SMBH. Also, since the X-ray cavities rise buoyantly, their distance from the nucleus constrains the age of the outburst. We can set mass-related constraints on the merger galaxy by examining NGC 1316 for dust. As an early-type galaxy, NGC 1316 is expected to be dust poor. Mid-infrared observations permit us to measure the amount of dust present, which, if higher than expected for a galaxy of its size and type, indicates an external origin for the dust.
In this paper, we report our analysis of the surface brightness distribution of NGC 1316 in the mid-IR with the Infrared Array Camera (IRAC) and the Multiband Imaging Photometer for Spitzer (MIPS) of the Spitzer and the resulting determination of the warm dust morphology. We describe our analysis of the X-ray emission imaged both by Chandra and XMM-Newton. Observations and data reduction are described in §2, and imaging and modeling results are given in §3. We compare the features seen in the infrared and X-ray with the radio emission in the nuclear, inner jet, and extended emission regions in §4 and examine the constraints these observations place on the mass of the merger progenitor, the outburst and merger ages, and the outburst energies in §5. Finally, we summarize the results in §6. Images have north to the top and east to the left. Angles are given counter-clockwise from west, unless otherwise stated.
2. Observations and Data Reduction
2.1. Spitzer Observations
IRAC (Fazio et al. 2004) observations of NGC 1316 were obtained on 2004 July 19 and 22 as part of the SIRTF Nearby Galaxy Survey (SINGS) Legacy program (Kennicutt et al. 2003; Spitzer PID 159) in all four bands. The two visits to NGC 1316 consisted of similar s integrations covering the galaxy, its companion NGC 1317, and the nearby field.
For our analysis, we retrieved the Basic Calibrated Data (BCD) version S14.0 pipeline products from the Spitzer archive. We corrected the IRAC BCD frames for residual images arising from prior, unrelated observations of bright sources by making object-masked, median-stacked coadds of all science frames not containing significant extended emission from NGC 1316 or NGC 1317. These single-visit coadds were then subtracted from the individual BCDs of the corresponding visit to remove the residual images. For the 8.0 m observation, light scattered from the galaxy nucleus along the detector array rows was fit and subtracted from the BCD frames using custom software as in Ashby et al. (2009). We then coadded the modified 30 s BCD frames from both observations using version 4.1.2 of IRACproc (Schuster et al. 2006) to mosaics having 12 pixels, i.e., the native IRAC pixel size.
The SINGS program also obtained MIPS observations of NGC 1316 (Rieke et al. 2004) on 2004 December 5 and 7. We obtained a combined 24 m mosaic and coverage map of NGC 1316 from the SINGS website222http://data.spitzer.caltech.edu/popular/sings.
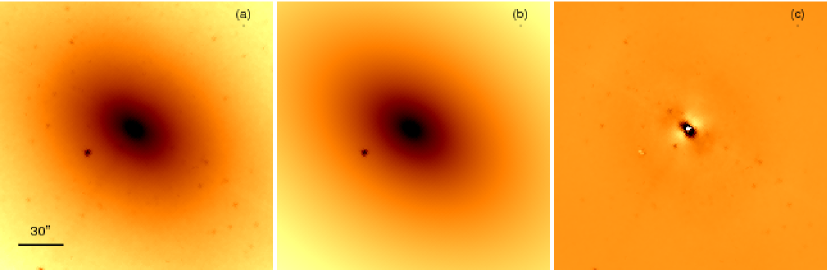
A region centered on the galaxy was selected for analysis in each IRAC and MIPS mosaic. The resulting 3.6 m image, which is very similar to the 4.5 m image, is presented in Figure 1a. The corresponding images for 5.8 m, 8.0 m, and 24 m are shown in the top row of Figure 2. Uncertainty maps were created by adding pixel-pixel rms noise and shot noise in quadrature.
2.2. Chandra Observations
NGC 1316 was observed for 30 ks on 2001 April 17 (ObsID 2022) with the Chandra Advanced CCD Imaging Spectrometer Spectroscopy Array (ACIS-S; Weisskopf et al. 2000). This observation was previously studied by Kim & Fabbiano (2003). We reprocessed this observation applying the latest CTI and time-dependent gain calibrations (see Vikhlinin et al. 2005 for more details). We applied the standard filtering by grade, excluded bad/hot pixels and columns, and removed cosmic ray ‘afterglows’. We removed time intervals with background flaring, resulting in an effective exposure time of 23.853 ks. The background files (see Markevitch et al. 2000 for details) were processed in exactly the same manner as the observations.
2.3. XMM-Newton Observations
XMM-Newton observed NGC 1316 for 107.3 ks on 2005 August 11-12 (ObsID 0302780101). Here we examine the Metal Oxide Semi-conductor CCD (MOS; Jansen et al. 2001) observation. We filtered the data to remove periods of background flaring, resulting in a reduced exposure time of 62.0 ks for MOS1 and 56.3 ks for MOS2. The events were further filtered to retain only events with energies between 0.5 and 7.0 keV and patterns between 0 and 12.
2.4. Radio, Optical, and CO Observations
NGC 1316 was observed with the () at 4.89 GHz in the AB array configuration on 2002 June 1. We used the Astronomical Image Processing System (AIPS; version 31DEC09) package to generate a map with a resolution of (Figure 3c). We also obtained a 20 cm VLA map from the NASA/IPAC Extragalactic Database (NED) (Fomalont et al. 1989).
The Hubble Advanced Camera for Surveys (ACS) observed NGC 1316 on 2003 March 04 through the F555W filter for 6.98 ks (PropID 9409). The WFPC2 instrument on Hubble observed it through the F814W filter on 1996 April 07 for 1.86 ks (PropID 5990). 12CO(2-1) intensities at 230 GHz were obtained from C. Horellou and J. H. Black, who observed NGC 1316 with the 15 m Swedish-ESO Submillimeter Telescope (SEST) in 1999 and 2001 with a resolution of 22 (Horellou et al. 2001).
3. Data Analysis
3.1. Spitzer Analysis
To measure dust and nuclear emission, we first had to remove the stellar component from the Spitzer images. To accomplish this, we modeled the 3.6 m emission, where the flux from the stars is the greatest of all four IRAC bands, with a two-dimensional Sérsic model (Sérsic 1968) for the stellar contribution. To determine the galaxy model, as well as emission from the nucleus, we used the software package GALFIT (Peng et al. 2002), which is a parametric surface brightness fitting code using minimization. We iteratively determined the center for the Sérsic profiles based on the 3.6 m emission and the position of the central point source based on the 8 m emission. After confirming that the 4.5 m emission results in similar parameters, as expected, since this band is also dominated by stellar emission, we held the Sérsic index, effective radius, axis ratio, position angle, and central position fixed at the 3.6 m fitted values for subsequent fits to the 4.5 m, 5.8 m, 8.0 m, and 24 m images. The remaining free parameters were the normalizations of the Sérsic model, central point source, and the foreground star 35 southeast of the nucleus, as well as a sky model, consisting of a constant offset and gradients in the two array directions. The point response function (PRF) in each band was input to GALFIT in order to fit the emission from the nucleus and foreground star. Masks were used to exclude foreground stars and the bulk of the emission from the neighboring galaxy NGC 1317. The fitted model parameters are given in Table 1. The fitted Sérsic index of agrees well with indices of 5.8 and 5.9 determined by Côté et al. (2007) from Hubble ACS images of NGC 1316.
Figure 1a shows the 3.6 m mosaic. Figure 1b shows the best fitting model obtained from GALFIT of a central point source, foreground point source, and a Sérsic model. Since the residual emission, shown in Figure 1c, is on the order of the noise (), outside the nuclear region, our Sérsic model is a good stellar emission model for this galaxy. Since the 4.5 m image and residuals are similar to those at 3.6 m, they are not shown.
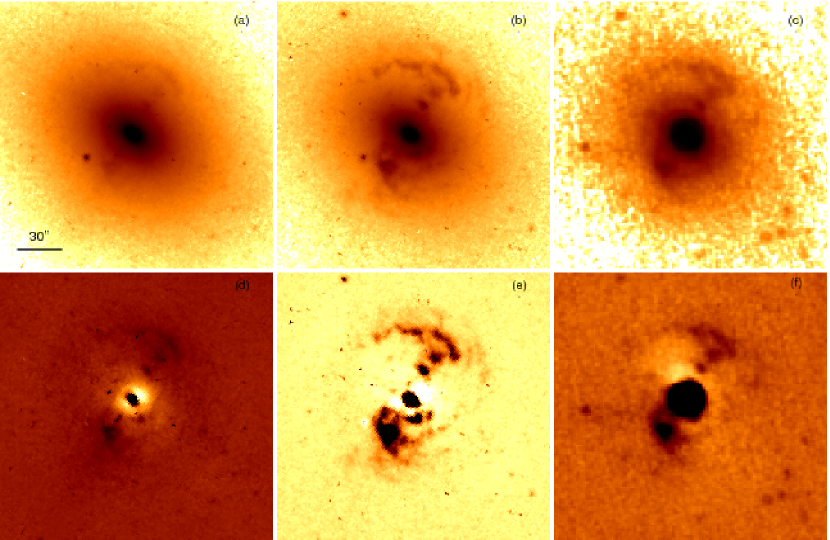
Figure 2 presents the 5.8 m, 8.0 m, and 24 m images (top row) and residuals after the modeled Sérsic profile has been subtracted (bottom row). The 8.0 m image and contours of its nonstellar emission were previously shown in Temi et al. (2005). The non-axially symmetric, non-stellar component is visible in the top row (a-c) and quite striking in the bottom row (d-f). As we discuss in §4 and §5.1, most of this component is due to dust. In addition to the nucleus, there is a region approximately 118 (1.3 kpc) in radius of dust emission 29 (3.1 kpc) southeast of the nucleus. There is also dust emission extending 44 (4.8 kpc) towards the northwest, ending in a clumpy arc that extends over a 90∘ angle and containing two knots 218 (2.4 kpc) and 320 (3.5 kpc) from the nucleus.
| Band | Sérsic Integrated Flux | Sky | Nuclear Flux | Nuclear Luminosity |
|---|---|---|---|---|
| (m) | (mJy) | DC Offset | (mJy) | ( ergs s-1) |
| 3.6 | -0.10 | |||
| 4.5 | 0.57 | |||
| 5.8 | -0.05 | |||
| 8.0 | 0.11 | |||
| 24 | -0.20 |
Note. — The Sérsic model index (), effective radius (), axis ratio (), and position angle (234.0∘∘ east of north) were all fitted only at 3.6 m and were held constant for the fits made in the other bands. The central position of the Sérsic profiles and the position of the nucleus were determined iteratively using the 3.6 m and 8 m images to be (, -37∘12288) and (, -37∘12287) respectively. Note that the Sérsic index determined matches well with the ones obtained by Côté et al. (2007). Luminosities in each photometric band given here are in ergs s-1, determined from the luminosity density . The uncertainty in the luminosities is the result of both the uncertainty in the flux measurement and in the distance to NGC 1316.
3.2. Chandra Analysis
We analyzed Chandra observations of NGC 1316 to determine the brightness and morphology of emission due to hot gas and a central nuclear source. We created an image of the soft X-ray emission between 0.5 and 2 keV using the ACIS-S3 CCD. We removed point sources, which we detected using WAVDETECT (Freeman & Vinay 2002). We then created an exposure map that accounts for all position dependent, but energy independent, efficiency variations across the focal plane (e.g., overall chip geometry, dead pixels or rows, variation of telescope pointing direction). Finally, we made a flat-fielded image by subtracting both the blank-field background and the read-out background and then dividing by the exposure map. We also created an image of the hard X-ray emission between 2 and 7 keV. The resulting images, shown in Figures 3d and 3f, have 1 and 05 pixels respectively and have been smoothed with a 5 Gaussian.
3.3. XMM-Newton Analysis
We analyzed the XMM-Newton image to examine features of
the extended X-ray emission which were not in the smaller Chandra field of
view. We created new exposure maps and images, to remove
the contribution from the MOS1 CCD with higher background, and
we removed point sources. The extended
X-ray emission, described in §4.3, includes a pair of cavities 320
(34.8 kpc) to the west and southeast of the nucleus. We reprojected
blank sky background files for each of the MOS
CCDs333http://xmm.vilspa.esa.es/external/xmm_sw_cal/
background/blank_sky.shtml
to the coordinates of our event file and scaled them appropriately,
prior to subtracting the combined background file from the
image. We then divided by the exposure map to create an
exposure-corrected image with 4 pixels (Figure 4).
4. Multiwavelength Comparison of Features
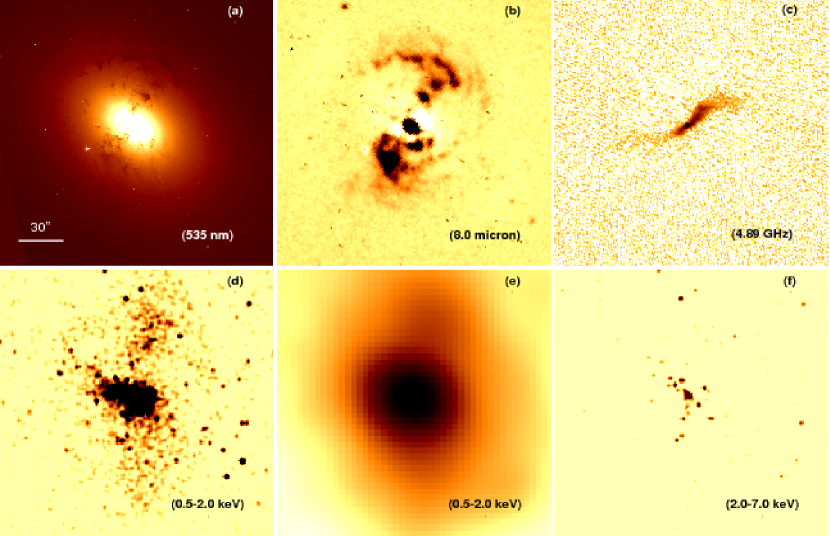
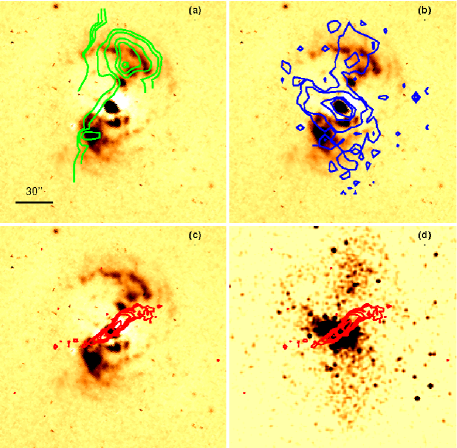
Figure 3 shows NGC 1316 in visible (555 nm), non-stellar infrared (8.0 m), radio (4.89 GHz), Chandra soft (0.5-2.0 keV), XMM-Newton soft (0.5-2.0 keV), and Chandra hard (2.0-7.0 keV) emission. For the 8.0 m image, we subtracted the stellar emission, as modeled by a Sérsic profile. In Figure 5, we show the relative locations of the X-ray, IR, radio, and CO emission. Below, we discuss the nucleus, the jet, and the extended non-stellar emission.
4.1. Nuclear Emission
The nucleus is detected in the radio, UV, X-ray, and IR bands. We obtained radio and UV nuclear fluxes from the literature (Geldzahler & Fomalont 1984, Fabbiano et al. 1994). We measured the X-ray spectrum in a 1 radius circle around the nucleus, using a 1-2 annulus to subtract the background thermal emission. We fit the nuclear spectra with an absorbed power law with both a variable and an held constant at the Galactic value of cm-2 (Kalberla et al. 2005). The variable fit had a similar power law index to the constant fit and a column density not significantly larger than the Galactic absorption. Therefore, we used the constant spectral fit whose best-fit power law index was (90% confidence), which is within the range typically observed for active galactic nuclei (AGN). We converted measured soft (0.5-2.0 keV) and hard (2.0-7.0 keV) X-ray fluxes to luminosities of ergs s-1 and ergs s-1. We measured the X-ray nuclear broadband (0.3-8 keV) flux to be ergs s-1 cm-2. Our flux corresponds to a broadband (0.3-8.0 keV) luminosity of ergs s-1. We also measured the nuclear flux in the F814W Hubble image in a radius aperture to be ergs s-1 cm-2, which we consider an upper limit because of the stellar contribution. Since the F555W image is saturated in the central region, we do not measure the nuclear flux through this filter.
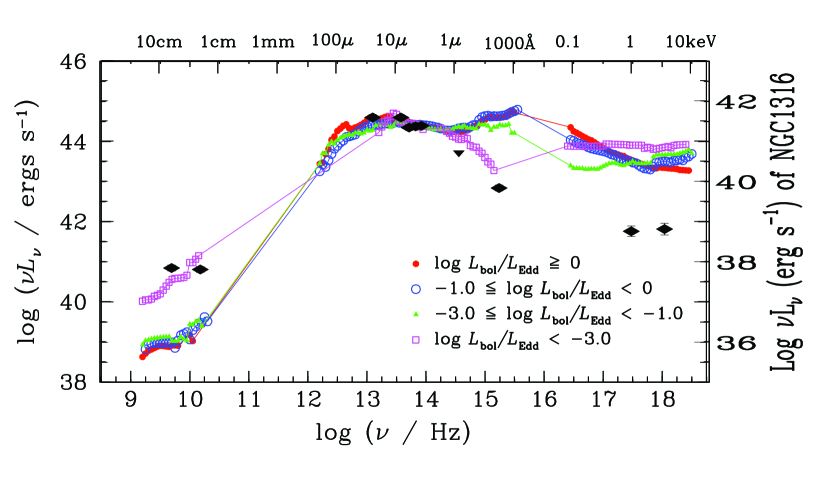
The nucleus is detected in all five Spitzer bands. Fluxes and luminosities, , in each photometric band from the GALFIT model are given in Table 1. We note that the nuclear fluxes were derived from fitting, but that the point source is not directly visible in the IRAC images. To confirm that the galaxy does contain a point-like nucleus, we used the 3.6 m emission as a stellar model, which was then color corrected and scaled to correct for differences in the apertures and zero point magnitudes between the IRAC bands. The resulting non-stellar images are very similar to those in the bottom row of Figure 2. The IR color of NGC 1316’s nucleus falls outside, but within , of the region defined by the mid-IR AGN color selection criteria of Stern et al. (2005) and within the selection region defined by Lacy et al. (2004). We note however that these IRAC selection criteria were developed for Seyfert galaxies and quasars that are significantly more luminous than NGC 1316. Indeed, the spectral energy distribution (SED) of the NGC 1316 AGN (Figure 6) is similar to those of other low luminosity AGN (LLAGN) (Ho 1999) in that it lacks the big blue bump found in powerful, optically bright AGN and instead appears to show only a single big red bump and has a larger radio to optical ratio than that of the higher luminosity AGN (Ho 2008). The comparison spectra plotted in this figure are from Figure 7 of Ho (2008) where the purple squares are the LLAGN. Smith et al. (2007) cited the AGN of NGC 1316 as having the typical peculiar PAH spectrum of LLAGN, which has low ratios of (7.7 m)/(11.3 m).
We used the supermassive black hole mass of M⊙ (Nowak et al. 2008) to determine the Eddington luminosity for the AGN to be ergs s-1. We interpolated the SED between the observed photometric points from 109 Hz to 1018 Hz and derived a bolometric luminosity of ergs s-1, corresponding to a bolometric correction of 6.2 for the 8.0 m IRAC band. The AGN therefore has a low Eddington ratio of . We also calculated the Bondi accretion rate to be M⊙ yr-1 (Bondi 1952), based on the black hole mass (Nowak et al. 2008), the 0.77 keV gas temperature (Isobe et al. 2006), and a central gas density of 0.4 cm-3 derived from a model (Cavaliere & Fusco-Femiano 1976) fit to the central 200 (21.7 kpc) region using Chandra data (a 320 pc, , cm-3) (Jones et al. 2010).
| Band | Flux | 1 Unc. | Luminosity | 1 Unc. | |
|---|---|---|---|---|---|
| (m) | (mJy) | (mJy) | ( ergs s-1) | ( ergs s-1) | |
| 3.6 | 1.05 | 0.35 | 5.94 | 1.98 | |
| 4.5 | 0.66 | 0.22 | 2.98 | 0.99 | |
| 5.8 | 0.58 | 0.19 | 2.07 | 0.69 | |
| 8.0 | 0.39 | 0.13 | 0.97 | 0.32 | |
| 24 | 0.81 | 0.27 | 0.69 | 0.23 |
Note. — Fluxes, given in mJy, are 3 upper limits and were obtained using an aperture defined by the radio emission northwest of the nucleus applied to each Spitzer image. The galaxy flux was removed using the Sérsic model determined from fitting the Spitzer images with GALFIT. Luminosities in each photometric band given here are in ergs s-1, determined from the luminosity density .
4.2. Inner Jet
The 4.89 GHz radio emission on small scales (Figure 3c)
has previously been extensively described by Geldzahler & Fomalont (1984). The northwest jet
extends 05 (3.3 kpc) from the nucleus and does not
decrease significantly in brightness over the initial 15 (1.6 kpc).
In contrast, the weaker southeast counterjet decreases
immediately in brightness away from the nucleus.
Unlike the jet in M87
(Shi et al. 2007, Forman et al. 2007) which is clearly detected
in all four IRAC bands, the NGC 1316 radio jet is not
detected in any IRAC band or at 24 m. We used an aperture
defined by the region of radio emission to the northwest of
the nucleus to derive upper limits on the IR emission from the
jet, which are given in Table 2.
Extended aperture corrections were derived and
applied.444IRAC: Extended Source Calibration
http://ssc.spitzer.caltech.edu/irac/iracinstrumenthandbook/33
We also calculated the expected fluxes assuming
a synchrotron model with a typical spectral index of 0.55 from
the radio flux of 29 mJy within the aperture. The expected
fluxes range from 0.38 mJy to 0.14 mJy, which are below
the limits measurable with the present data.
The soft X-ray image (Figure 3d and 3e and contours on Figure 5b) does not show emission from the jet. The resolved northwest radio jet coincides with a region of low X-ray emission, most likely a small X-ray cavity created by the expansion of the radio plasma, previously described by Kim & Fabbiano (2003). As illustrated in Figure 5c, the dust emission is faint at the position of the radio jet. The bend in the northwestern jet is located just south of the first IR knot, along the northwestern dust protrusion.
4.3. Extended Non-Stellar Emission
Temi et al. (2005) found that the morphology of the 8.0 m non-stellar emission was similar to that of the 15 m emission detected by the Infrared Space Observatory (ISO) (Xilouris et al. 2004). They concluded that, while much of the excess emission at 8.0 m was likely due to PAH emission at 7.7 m, warm, small dust grains also contributed. The similarity of the features at 5.8 m and 24 m supports this interpretation. The extended non-stellar emission has significant structure at all wavelengths as shown in Figure 3 and Figure 5:
- •
- •
-
•
The strongest X-ray emission outside the nucleus (Figure 5b with soft X-ray contours overlaid on the 8.0 m non-stellar emission) extends northeast of the nucleus along the major axis of NGC 1316 into a region absent of infrared dust emission. We tested whether the dusty features seen in the infrared and the coincident cold gas result in soft X-ray absorption, but found no indication thereof, although the data is not sufficient to make a conclusive statement.
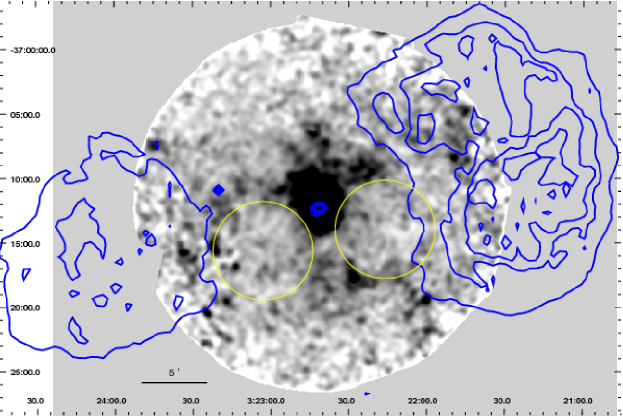
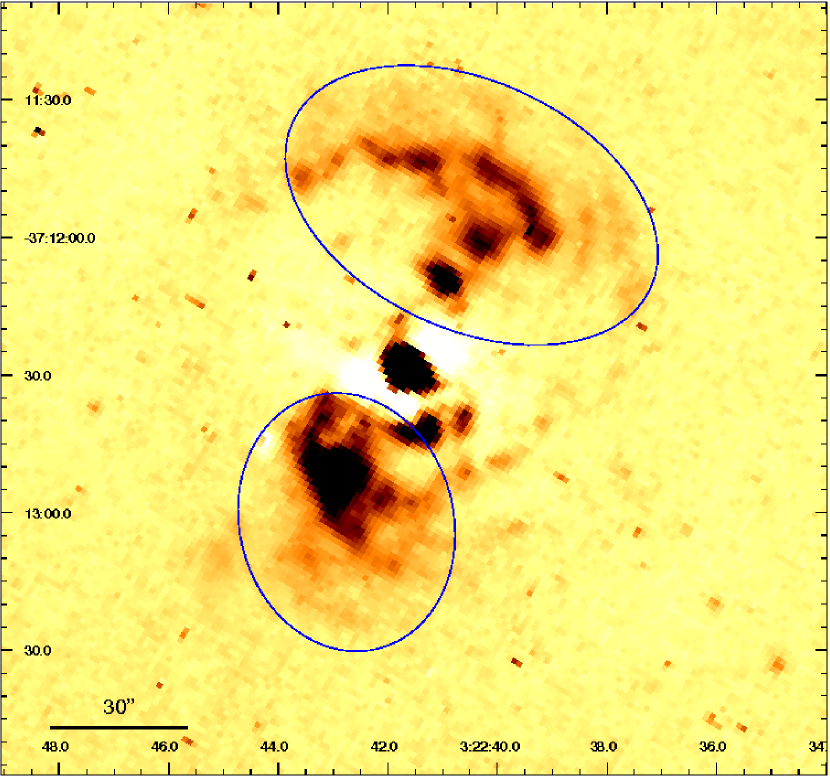
In the galaxy core, the soft Chandra image and the XMM-Newton image show a roughly north-south elongation approximately 125 (8.2 kpc) in each direction (Figures 3d, 3e), which does not follow the distribution of the stars. Instead, this emission is roughly perpendicular to the major axis of NGC 1316 and may be from hot gas that was moved by the outburst. The larger XMM-Newton field of view (Figure 4) shows further filamentary emission north of the nucleus and a pair of X-ray cavities. These cavities, likely created by the expansion of radio plasma, are marked with yellow circles of 230 (25 kpc) radii. The western cavity is centered at (, -37∘1400) and the southeastern cavity is centered at (, -37∘1540). Each cavity lies 320 (34.8 kpc in the plane of the sky) from the nucleus. There are three regions of enhanced emission along the edges of these cavities, approximately located at (, -37∘1742), (, -37∘0935), and (, -37∘1133), which are likely due to increased gas density as the hot ISM is compressed by the expanding cavities. No radio emission is detected in these X-ray cavities, a situation previously seen in Abell 4059 (Heinz et al. 2002), M87 (Forman et al. 2007), and the Perseus cluster (Fabian et al. 2006). While the centers of the radio lobes line up with the AGN, there are indications that this system may be experiencing some sloshing of the hot gas. Specifically, the X-ray cavities are centered 15 and 32 south of the nucleus and Ekers et al. (1983) found low-level radio emission between the lobes south of the nucleus.

To quantitatively measure the significance of the cavities seen in the XMM-Newton image, we plot in Figure 7 the azimuthal surface brightness of the soft (0.5-2.0 keV) exposure-corrected background-subtracted XMM-Newton image (Figure 4) taken in an annulus extending from 180 (19.6 kpc) to 375 (40.8 kpc) from the nucleus after the image was smoothed with a 282 Gaussian. The azimuthal profile shows that the regions between 80-140∘, (i.e. southeast of the nucleus), and between 220-280∘, (i.e. to the west), have significantly lower surface brightness than the rest of the annulus. These regions coincide with the cavities identified (yellow circles) in Figure 4. The bright regions north of the nucleus and along the cavity edges in Figure 4 coincide with the significantly brighter regions in the azimuthal plot (Figure 7). The three regions of enhanced X-ray emission along the cavity edges are noted in Figure 7.
We tested whether the variations in azimuthal surface brightness could be the result of abundance or gas density variations. The maximum surface brightness change would require a factor of 2.3 difference in elemental abundance (i.e. the lower surface brightness region would have an elemental abundance 40% that of the brighter regions). While such an abundance gradient would be relatively long lived against diffusion, even if it proceeds as fast as predicted for heavy ions in a fully ionized plasma (Sarazin 1988, Spitzer 1956), such a distribution of metals mimicking cavity structures seems particularly contrived. An alternative explanation for the surface brightness variations is for the isobaric gas to have a density in the regions of lower surface brightness 0.66 times that of the gas to the north and south of the nucleus. Such a difference in density requires either that the lower surface brightness gas is at least 1.5 times hotter than the surrounding gas or that the regions of lower surface brightness would be filled with a relativistic plasma. No indication of emission from a hot plasma is seen in the harder X-ray band (2.0-7.0 keV). Therefore, we expect the regions of lower surface brightness to be cavities filled with a currently undetected relativistic plasma, a morphology seen in other galaxies and galaxy clusters and known as ghost cavities (Heinz et al. 2002). Emission from ghost cavities are generally detected in low-frequency radio data (e.g. Giacintucci et al. 2009).
5. Multiwavelength View of the Consequences of the Merger Event
NGC 1316 exhibits signs of a recent merger, including nuclear activity and a disturbed morphology seen in the optical and infrared dust distribution as well as the tidal tails first noted by Schweizer (1980). Each wavelength provides different insights into the merger event and the resulting structure of NGC 1316. Below, we discuss the distribution of the infrared-emitting dust and estimate the mass of the galaxy that collided with NGC 1316 from the measured dust mass. We also use the morphology of the large scale radio and X-ray emission (Figure 4) to constrain the recent outburst history of the central SMBH.
5.1. Dust Distribution
To measure the dust emission in the Spitzer bands, we performed aperture photometry on the infrared images after subtracting a Sérsic model of the stellar emission. Elliptical apertures (Figure 8) were chosen to include dust features seen at 8.0 m. For the southeastern region, we used an ellipse with a major axis of 568, a minor axis of 466, and a position angle of 284∘ (east of north) centered at (, -37∘13021). For the northwestern region, we used an ellipse with a major axis of 86, a minor axis of 54, and a position angle of 245∘ centered at (, -37∘11530). The counts in each aperture were background subtracted and converted to fluxes, after an extended aperture correction was applied. Columns 2-3 of Table 3 list the flux in each aperture. The next two columns give the total fluxes and their uncertainties with and without the nuclear point source (nuclear fluxes given in Table 1). The uncertainties have two components: the uncertainty in the Sérsic model and the uncertainty in the photometric accuracy of Spitzer images (Reach et al. 2005, Engelbracht et al. 2007).
| Band | SE Knot | NW Knot+Arc | Total | Total | |
|---|---|---|---|---|---|
| of | with | ||||
| -37∘13021 | -37∘11530 | knots | nucleus11Nuclear fluxes are given in Table 1 | ||
| (m) | (mJy) | (mJy) | (mJy) | (mJy) | |
| 5.8 | 4.160.43 | 6.470.70 | 10.60.8 | 17.40.9 | |
| 8.0 | 18.80.6 | 13.80.5 | 32.60.8 | 49.20.9 |
Note. — Fluxes (cols 2-3) were obtained using elliptical apertures (Figure 8) for the southeast and northwest region on each Spitzer image once a Sérsic model had been subtracted.
Draine et al. (2007) modeled the integrated IRAC, MIPS, and IRAS fluxes of the SINGS galaxy sample with a two-component dust model and determined dust masses. They estimate their models are accurate to 10%. To test whether the dust mass determined for NGC 1316 by Draine et al. (2007) is located within the regions visible in Figure 8, we compared our photometry from the two regions of dust emission and the nucleus to their dust model predictions. We convolved the predicted Draine et al. (2007) dust flux SED for NGC 1316 (their Figure 14) through the appropriate response functions to calculate the expected fluxes in the Spitzer band passes. Our 5.8 m and 8.0 m total fluxes for the dust regions and nucleus of mJy and mJy are consistent with the Draine et al. (2007) model values of mJy and mJy, which are the emission for the entire galaxy. The agreement leads us to conclude that the dust mass estimated by Draine et al. (2007) is contained in the non-stellar IR emission regions described in §3.1 and in the nuclear region.
5.2. Dust Mass and Merger Progenitor Mass
In the following, we show that the dust observed in NGC 1316 is not native to the galaxy and use the dust mass to estimate the mass of the merger galaxy. The clumpy morphology of the dust is significantly different from the smooth elliptical distribution of the stars, so the NGC 1316 stars could not have expelled the dust. In addition, Tang et al. (2009) found for nearby ellipticals that most of the non-stellar 8.0 m emission is confined to the nuclear region. This also demonstrates that the morphology of the dust emission in NGC 1316 is unusual. Temi et al. (2009) found a correlation between the K-band and 24 m luminosities of elliptical galaxies. NGC 1316 has a particularly large 24 m luminosity for its K-band luminosity, about an order of magnitude greater than predicted by the Temi et al. (2009) correlation. While Temi et al. (2009) did not find a correlation between K-band luminosity and either 70 m or 160 m luminosity, NGC 1316’s integrated luminosities at these wavelengths of ergs s-1 and ergs s-1 (Dale et al. 2007) are also more than an order of magnitude greater than found for the galaxies in the Temi et al. (2009) sample. The large infrared luminosities of NGC 1316 demonstrate an external origin for the dusty emission.
In the following, we estimate the mass of dust in NGC 1316 as well as the dust mass expected to be in an elliptical galaxy the size of NGC 1316. Muñoz-Mateos et al. (2009) provided a formula (A8) for calculating the dust mass of a galaxy from its 24 m, 70 m, and 160 m fluxes and its distance. We calculated that NGC 1316 has a total dust mass of M⊙, using the integrated MIPS fluxes from Dale et al. (2007). While emission from the dust is clearly observed, the large uncertainty on the dust mass results from the uncertainties in the distance to NGC 1316 ( Mpc) and in the integrated MIPS fluxes ( Jy at 24 m, Jy at 70 m, and Jy at 160 m). We revised the Draine et al. (2007) dust mass for NGC 1316, which was found on the basis of SED fitting, for our assumed distance of 22.7 Mpc to be M⊙, which is consistent with our dust mass. We used the fluxes for the sample of elliptical galaxies in Temi et al. (2009), along with their B-V colors (de Vaucouleurs et al. 1991) and the color-dependent mass-to-light ratios of Bell et al. (2003), to calculate the stellar and dust masses of the sample. We found that elliptical galaxies typically have dust-to-stellar mass ratios between . Using these ratios, we estimate that NGC 1316 with its stellar mass of M⊙ (based on B-V=0.87 (de Vaucouleurs et al. 1991), K = 5.587 (Jarrett et al. 2003), and the relations of Bell et al. (2003)) had an intrinsic dust mass of M⊙, % of the measured dust mass. We conclude that nearly all of the dust currently present in NGC 1316 was contributed by a merger galaxy.
We can constrain the galaxy type and the stellar and gas mass of the merger galaxy from its estimated dust mass of M⊙. The merger galaxy had to be a late type galaxy as its stellar mass, were it a typical elliptical, would have been roughly 200 times the present stellar mass of NGC 1316. We calculated the stellar masses of the spiral galaxies in the SINGS sample using NED colors and the color-dependent stellar ratios of Bell et al. (2003). Using the dust masses from Draine et al. (2007), we found dust-to-stellar mass ratios between for Sa-Sm galaxies with Sc galaxies having the largest ratios. From these ratios and the merger galaxy dust mass, we estimate that the merger galaxy had a stellar mass in the range of M⊙, approximately 10% of NGC 1316’s current stellar mass. Assuming typical galaxy colors (Trimble 2000), we calculated the corresponding to be L⊙ using the ratios of Bell et al. (2003). We estimate the corresponding cold gas masses based on gas-mass-to-light ratios of Bettoni et al. (2003) to be M⊙. Kennicutt et al. (2003) found an upper limit on the mass of neutral hydrogen in NGC 1316 of M⊙, and Horellou et al. (2001) estimate that NGC 1316 has M⊙ of molecular hydrogen gas, resulting in a total cold gas mass of less than M⊙. Since the merger galaxy’s estimated cold gas mass of M⊙ is larger than NGC 1316’s present cold gas mass, some cold gas may have been ionized due to mixing with hot gas or used in star formation in the merger process.
5.3. Outburst Ages
The morphologies of the large scale GHz radio emission and the large X-ray cavities in NGC 1316 suggest two possible interpretations of the recent outburst history of the NGC 1316 AGN. Based on the relative location of the X-ray cavities and the radio lobes, we can conclude that either the 1.4 GHz radio features do not fully define the extent of the radio lobes created in conjunction with the X-ray cavities in the course of a single outburst or there were at least two outbursts, one resulting in the radio lobes and a more recent one creating the X-ray cavities seen in the XMM-Newton image. In the two outburst scenario, we expect the X-ray cavities, which lie at a smaller radius, to result from the more recent outburst, as they would otherwise have been disrupted by the expanding radio lobes.
Cavity ages can be estimated by assuming that the bubbles that create them rise buoyantly in the gaseous atmosphere (e.g. Churazov et al. 2001). Assuming an approximate buoyancy velocity of 0.6 cs, where cs is the sound speed (Churazov et al. 2001), we estimate a buoyancy speed of 270 km s-1 in the 0.77 keV medium (Isobe et al. 2006). The X-ray cavities are located 320 from the nucleus and Wade (1961) measured the separation of the radio lobes to be 33. If we assume the lobe expansion is in the plane of the sky, for NGC 1316’s distance of 22.7 Mpc, the X-ray cavities and the radio lobes are at 35 kpc and 108 kpc from the nucleus respectively. These distances correspond to buoyancy rise times of 0.1 Gyr for the X-ray cavities and 0.4 Gyr for the radio lobes. The age of 0.4 Gyr appears large for radio lobes still emitting at 1.4 GHz, but matches the estimate of the synchrotron age calculated by Ekers et al. (1983). Further, if the lobe is continuously or intermittently connected to the nuclear power supply, fresh injection of electrons or re-energization of existing electron populations could, in principle, supply sufficient high energy electrons so that the lobe is visible at GHz frequencies even after several hundred million years. Finally, Iyomoto et al. (1998) estimated that the nucleus of NGC 1316 was active 0.1 Gyr ago, which agrees with our estimate of the age of the X-ray cavities.
Mackie & Fabbiano (1998) estimated a single merger with a low-mass gas-rich galaxy 0.5 Gyr ago could be responsible for the optical tidal tail morphology. Such a merger could have provided the material to power the AGN outbursts. A gas-rich merger galaxy would contribute blue young stars, which require about a Gyr to become red and dead. The B-V color of NGC 1316 of 0.87 (de Vaucouleurs et al. 1991) is slightly bluer than the typical B-V color of 0.91 for elliptical galaxies (Trimble 2000), which suggests that NGC 1316 may still contain a small population of early type stars. NGC 1316’s color therefore supports a merger within the last Gyr. We also can set a lower limit on the merger age by estimating the free-fall time of the northwestern dust component. We revised the Arnaboldi et al. (1998) total mass within 45 of the nucleus to be M⊙ and used this along with the excess velocity of 70 km s-1 for the northwestern clump of molecular gas (Horellou et al. 2001) to estimate a free-fall time for the northwestern dust and molecular gas feature. The estimated free-fall time of 22 Myr is a lower limit on the age of the merger, since the clump likely also has a tangential velocity component and was likely deposited at greater radii by the merger.
5.4. Outburst Energies
Churazov et al. (2002) described the energy deposition required to inflate a bubble adiabatically, and thereby create a cavity, as the enthalpy of that bubble, which for relativistic gas is . To estimate the energy of the outburst responsible for the X-ray cavities, we used the more clearly defined western X-ray cavity, whose shape we approximate as a sphere of 230 (25 kpc) centered 320 (34.8 kpc) from the nucleus. To measure the pressure, we assume an isothermal gas at 0.77 keV (Isobe et al. 2006) and solar abundance and derived the density from the surface brightness. We model the density as a model (Cavaliere & Fusco-Femiano 1976), whose parameters we derive by fitting the surface brightness profile of the exposure-corrected XMM-Newton image in a region not containing the cavities. This method provides a lower limit on the total outburst energy, since it estimates the kinetic energy released in the outburst. Assuming solar abundance, we estimate the kinetic outburst energy is ergs, for equal-sized bubbles created in the plane of the sky on each side of the nucleus. If the abundance is half solar, then the gas density and outburst energy both increase by 40 %. Based on the energy needed to create the X-ray cavities and adopting a mass-energy conversion efficiency of , we estimate the mass of material that would have been accreted onto the SMBH to be:
| (1) |
where is the total energy output.
Deep X-ray observations are not available for a similar analysis in the regions defined by the radio lobes, and we expect complications due to inverse Compton X-ray emission coincident with the potential cavities (Feigelson et al. 1995). However, if we extrapolate the gas density model to the radio lobes assuming they lie in the plane of the sky and use the 20 cm observation to determine the location and size of the lobes, we can estimate the energy required to evacuate cavities the present size of the lobes and thereby estimate the energy of the outburst required to create them. We approximated the lobes as 24 (78.3 kpc) diameter spheres centered at 143 (93.3 kpc) (west) and 156 (101.4 kpc) (east) from the nucleus. We extrapolated the gas density model derived from the XMM-Newton surface brightness to the radii of the radio lobes and combined the derived pressure there with the expected cavity volumes created through adiabatic bubble expansion to estimate the required energy of ergs. The mass accreted onto the SMBH to produce this energy would be M⊙.
5.5. Comparison of the Cen A and Fornax A Jets
Centaurus A (NGC 5128) and NGC 1316 (Fornax A) are both nearby elliptical galaxies, which have recently undergone a merger event that has produced strong nuclear activity. They each host a 108 M⊙ black hole that are low luminosity AGNs and have dust lanes roughly perpendicular to their radio lobes (Marconi et al. 2006, Nowak et al. 2008). However, they differ significantly with regards to the observational characteristics of their jets. At a distance of 3.7 Mpc (Ferrarese et al. 2007), Cen A has a 1.5 kpc radio and X-ray emitting jet that extends from the nucleus to the northeast radio lobe (Feigelson et al. 1981, Kraft et al. 2002, Hardcastle et al. 2003). In contrast, NGC 1316’s 3 kpc radio jet does not extend to the large radio lobes and coincides not with an X-ray jet, but with a soft X-ray cavity. This phenomenological contrast suggests that, while the jet of Cen A is dissipative (Nulsen et al. 2010), NGC 1316’s jet is not or that the NGC 1316 jet has shut off on larger scales.
6. Conclusions
We detected considerably more dust emission for NGC 1316 than expected in an early type galaxy with its K-band luminosity and observed evidence of recent AGN outbursts in the form of X-ray cavities and radio lobes. We presented Spitzer images of the infrared dust emission, including the first image of dust emission at 5.8 m. We determined that the dust has a clumpy morphology, mostly confined to two regions, one 288 (3.1 kpc) southeast of the nucleus and a 439 (4.8 kpc) protrusion ending in an arc northwest of the nucleus. Molecular emission is detected from these regions. The resolved radio jet is not detected by Spitzer, and it does not coincide with regions of dust emission. Since the dust must be almost entirely external in origin, we use the dust mass to constrain the type and mass of the merger galaxy. We calculated a present dust mass of M⊙ based on the integrated MIPS fluxes, which agrees with the dust mass of M⊙ predicted by the model of Draine et al. (2007). We estimate the merger galaxy was a late type galaxy with a stellar mass of M⊙ and a gas mass of M⊙, some of which was likely ionized or used to form stars in the merger event.
We constrained the age and energy of the merger and outburst events based on the X-ray and radio emission. The XMM-Newton image shows a pair of X-ray cavities to the west and southeast of the nucleus, likely created by the expansion of radio plasma, which are closer to the nucleus than the 1.4 GHz radio lobes. The relative locations of these cavities and the radio lobes suggests that either the 1.4 GHz radio emission does not show the full extent of the radio emission from the outburst or that there have been at least two AGN outbursts. We calculate buoyant rise times for the X-ray cavities of 0.1 Gyr and for the radio lobes of 0.4 Gyr, assuming expansion in the plane of the sky at 0.6 cs, which agrees with the synchrotron age estimated by Ekers et al. (1983). Since the age of the radio lobes is close to the 0.5 Gyr age estimated by Mackie & Fabbiano (1998) for the merger, the outburst was likely triggered by the accretion of material onto the SMBH from this merger. Finally, we constrained the kinetic energy of the outbursts based on the energy required to create the XMM-Newton cavities and the radio lobes bubbles. We estimate the outburst that created the X-ray cavities had a kinetic energy of ergs and that the creation of the radio lobes required times more power.
References
- Arnaboldi et al. (1998) Arnaboldi, M., Freeman, K. C., Gerhard, O., Matthias, M., Kudritzki, R. P., Méndez, R. H., Capaccioli, M., & Ford, H. 1998, ApJ, 507, 759
- Ashby et al. (2009) Ashby, M. L. N., et al. 2009, ApJ, 701, 428
- Bell et al. (2003) Bell, E. F., McIntosh, D. H., Katz, N., & Weinberg, M.D. 2003, ApJS, 149, 289
- Bettoni et al. (2003) Bettoni, D. Galletta, G. & García-Burillo, S. 2003, A&A, 405, 5
- Bondi (1952) Bondi, H. 1952, MNRAS, 112, 195
- Cavaliere & Fusco-Femiano (1976) Cavaliere, A. & Fusco-Femiano, R. 1976, A&A, 49, 137
- Churazov et al. (2001) Churazov, E., Brüggen, M., Kaiser, C. R., Böhringer, H., & Forman, W. 2001, ApJ, 554, 261
- Churazov et al. (2002) Churazov, E., Sunyaev, R., Forman, W., & Böhringer, H. 2002, MNRAS, 332, 729
- Côté et al. (2007) Côté, P. et al. 2007, ApJ, 671, 1456
- Dale et al. (2007) Dale, D. A. et al., 2001, ApJ, 655, 863
- de Vaucouleurs et al. (1991) de Vaucouleurs, G., de Vaucouleurs, A., Corwin Jr., H. G., Buta, R. J., Paturel, G., & Fouque, P. 1991, Third Reference Catalogue of Bright Galaxies, (New York: Springer-Verlag)
- Draine et al. (2007) Draine, B. T., et al. 2007, ApJ, 663, 866
- Ekers et al. (1983) Ekers, R. D., Gross, W. M., Wellington, K. J., Bosma, A., Smith, R. M., &Schweizer, F. 1983, A&A, 127, 361
- Engelbracht et al. (2007) Engelbracht, C. W. et al. 2007, PASP, 119, 994
- Evans (1949) Evans, D. S. 1949, MNRAS, 109, 94
- Fabbiano et al. (1994) Fabbiano, G., Fassnacht, C., & Trinchieri, G., 1994, ApJ, 434, 67
- Fabian et al. (2006) Fabian, A. C., Sanders, J. S., Taylor, G. B., Allen, S. W., Crawford, C. S., Johnstone, R. M., & Iwasawa, K. 2006, MNRAS, 366, 417
- Fazio et al. (2004) Fazio, G. G. et al. 2004, ApJS, 154, 10
- Feigelson et al. (1995) Feigelson, E. D., Laurent-Muehleisen, S. A., Kollgaard, R. I., & Fomalont, E. B., 1995, ApJ, 449, L149
- Feigelson et al. (1981) Feigelson, E. D., Schreier, E. J., Delvaille, J. P., Giacconi, R., GRindlay, J. E., & Lightman, A. P. 1981, ApJ, 251, 31
- Ferrarese et al. (2007) Ferrarese, L., Mould, J.R., Stetson, P. B., Tonry, J. L., Blakeslee, J. P., & Ajhar, E. A. 2007, ApJ, 6564, 186
- Fomalont et al. (1989) Fomalont, E. B., Ebneter, K. A., Van Bruegel, W. J. M., & Ekers, R. D. 1989, ApJ, 346, L17
- Forman et al. (2007) Forman, W. et al. 2007, ApJ, 665, 1057
- Freeman & Vinay (2002) Freeman, P. & Vinay, K. 2002, ApJS, 138, 185
- Geldzahler & Fomalont (1984) Geldzahler, B. J. & Fomalont, E. B. 1984, AJ, 89, 1650
- Giacintucci et al. (2009) Giacintucci, S., Vrtilek, J. M., O’Sullivan, E., Raychaudhury, S., David, L. P., Venturi, T., Athreya, R., & Gitti, M. astro-ph 0909.0291
- Goudfrooij et al. (2001) Goudfrooij, P., Alonso, M. V., Maraston, C., & Minniti, D. 2001, MNRAS, 328, 237
- Hardcastle et al. (2003) Hardcastle, M. J., Worrall, D. M., Kraft, R. P., Forman, W. R., Jones, C., & Murray, S. S. 2003, ApJ, 593, 169
- Heinz et al. (2002) Heinz, S., Choi, Y.-Y., Reynolds, C. S., & Begelman, M. C. 2002, ApJ, 569, L79
- Ho (1999) Ho, L. C., 1999, ApJ, 516, 672
- Ho (2008) Ho, L. C., 2008, ARA&A, 46, 475
- Horellou et al. (2001) Horellou, C., Black, J. H., van Gorkom, J. H., Combes, F., van der Hulst, J. M., & Charmandaris, V. 2001, A&A, 376, 837
- Isobe et al. (2006) Isobe, N., Makishima, K., Tashiro, M., Itoh, K., Iyomoto, N., Takahashi, I., & Kaneda, H. 2006, ApJ, 645, 256
- Iyomoto et al. (1998) Iyomoto, N., Makishima, K., Tashiro, M., Inoue, S., Kaneda, H., Matsumoto, Y., & Mizuno, T. 1998, ApJ, 503, L31
- Jansen et al. (2001) Jansen, F. et al. 2001, A&A, 365, L1
- Jarrett et al. (2003) Jarrett, T. H., Chester, T., Cutri R., Schneider, S. E., & Huchra, J. P. 2003, AJ, 125, 525
- Jones et al. (2010) Jones, C. et al. in preparation
- Kalberla et al. (2005) Kalberla, P. M., Burton, W. B., Hartmann, D., Arnal, E. M., Bajaja, E., Morras, R., & Pöppel, W. G. L. 2005, å, 440, 775
- Kennicutt et al. (2003) Kennicutt, R. C., et al. 2003, PASP, 115, 928
- Kim & Fabbiano (2003) Kim, D. W. & Fabbiano, G. 2003, ApJ, 586, 826
- Kraft et al. (2002) Kraft, R. P., Forman, W. R., Jones, C., Murray, S. S., Hardcastle, M. J., & Worrall, D. M. 2002, ApJ, 569, 54
- Lacy et al. (2004) Lacy, M., et al. 2004, ApJS, 154, 166
- Mackie & Fabbiano (1998) Mackie, G., & Fabbiano, G. 1998, AJ, 115, 514
- Marconi et al. (2006) Marconi, A., Pastorini, G., Pacini, F., Axon, D. J., Capetti, A., Macchetto, D., Koekemoer, A. M., & Schreier, E. J. 2006, A&A, 448, 921
- Markevitch et al. (2000) Markevitch, M. et al., 2000, ApJ, 541, 542
- McNamara et al. (2000) McNamara, B. R. et al., 2000 ApJ, 534, L135
- Morgan (1958) Morgan, W. W. 1958, PASP, 70, 364
- Muñoz-Mateos et al. (2009) Muñoz-Mateos, J. C. et al., 2009, ApJ, 701, 1965
- Nowak et al. (2008) Nowak, N. Saglia, R. P., Thomas, J., Bender, R., Davies, R. I., & Gebhardt, K. 2008, MNRAS, 391, 1629
- Nulsen et al. (2010) Nulsen, P. et al. in preparation
- Peng et al. (2002) Peng, C. Y., Ho, L. C., Impey, C. D., & Rix, H. 2002, AJ, 124, 266
- Reach et al. (2005) Reach, W. T. et al. 2005, PASP, 117, 978
- Rieke et al. (2004) Rieke, G. H. et al. 2004, ApJS, 154, 25
- Sarazin (1988) Sarazin, C. L. 1988, X-ray Emission from Clusters of Galaxies, (New York: Cambridge University Press)
- Schuster et al. (2006) Schuster, M. T., Marengo, M. & Patten, B. M. 2006, SPIE, 6270, 65
- Schweizer (1980) Schweizer, F. 1980, ApJ, 237, 303
- Sérsic (1968) Sérsic, J. L. 1968, Atlas de Galaxias Australes (Córdoba: Obs. Astron.)
- Shi et al. (2007) Shi, Y., Rieke, G. H., Hines, D. C., Gordon, K. D., & Egami, E. 2007, ApJ, 655, 781
- Shklovskii (1963) Shklovskii, I. S. 1963, SvA, 6, 465
- Smith et al. (2007) Smith, J. D. T. et al. 2007, ApJ, 656, 770
- Spitzer (1956) Spitzer, L. Jr. 1956, Physics of Fully Ionized Gases (New York: Interscience)
- Stern et al. (2005) Stern D., et al. 2005, ApJ, 631, 163
- Tang et al. (2009) Tang, Y., Gu, Q.-S., Huang, J.-S., & Wang, Y.-P. 2009, MNRAS, 397, 1966
- Temi et al. (2009) Temi, P., Brighenti, F., & Matthews, W. G., 2009, ApJ, 695, 1
- Temi et al. (2005) Temi, P., Matthews, W. G., & Brighenti, F., 2005, ApJ, 622, 235
- Tonry et al. (2001) Tonry, J. L, Dressler, A., Blakeslee, J. P., Ajhar, E. A., Fletcher, A. B., Luppino, G. A., Metzger M. R., & Moore, C. B. 2001, ApJ, 546, 681
- Trimble (2000) Trimble, V. 2000, in Allen’s Astrophysical Quantities, ed. A.N. Cox (New York: Springer-Verlag), 569
- Vikhlinin et al. (2005) Vikhlinin, A., Markevitch, M., Murray, S. S., Jones, C., Forman, W., & Van Speybroeck, L. 2005, ApJ, 628, 655
- Wade (1961) Wade, C. M., 1961, Pub. NRAO, 1, 99
- Weisskopf et al. (2000) Weisskopf, M. C., Tananbaum, H. D., Van Speybroeck, L. P., & O’Dell, S. L. 2000, SPIE, 4012, 2
- Xilouris et al. (2004) Xilouris, E. M., Madden, S. C., Galliano, F., Vigroux, L., & Sauvage, M. 2004, A&A, 416, 41