A panchromatic study of BLAST counterparts: total star-formation rate, morphology, AGN fraction and stellar mass
Abstract
We carry out a multi-wavelength study of individual galaxies detected by the Balloon-borne Large Aperture Submillimeter Telescope (BLAST) and identified at other wavelengths, using data spanning the radio to the ultraviolet (UV). We develop a Monte Carlo method to account for flux boosting, source blending, and correlations among bands, which we use to derive deboosted far-infrared (FIR) luminosities for our sample. We estimate total star-formation rates for BLAST counterparts with by combining their FIR and UV luminosities. Star formation is heavily obscured at L☉, , but the contribution from unobscured starlight cannot be neglected at L☉, . We assess that about 20% of the galaxies in our sample show indication of a type-1 active galactic nucleus (AGN), but their submillimeter emission is mainly due to star formation in the host galaxy. We compute stellar masses for a subset of 92 BLAST counterparts; these are relatively massive objects, with a median mass of M☉, which seem to link the 24 m and SCUBA populations, in terms of both stellar mass and star-formation activity. The bulk of the BLAST counterparts at appear to be run-of-the-mill star-forming galaxies, typically spiral in shape, with intermediate stellar masses and practically constant specific star-formation rates. On the other hand, the high- tail of the BLAST counterparts significantly overlaps with the SCUBA population, in terms of both star-formation rates and stellar masses, with observed trends of specific star-formation rate that support strong evolution and downsizing.
1 Introduction
The physical processes associated with the evolution of the Universe have left an imprint in the extragalactic background light. The far-infrared (FIR) portion of the background is associated with forming galaxies in which the ultraviolet (UV) photons emitted by new born stars are absorbed and re-radiated by dust in the IR. Roughly half of the energy content of the starlight integrated over the age of the Universe is stored in the Cosmic Infrared Background (CIB), glowing with a broad peak at around 200 m (Puget et al., 1996; Fixsen et al., 1998; Dwek et al., 1998). The tight connection between star formation and FIR luminosity provides a route to understanding the history of star formation in the Universe, by means of studying the CIB at wavelengths close to its peak (Gispert et al., 2000; Rowan-Robinson, 2001; Chary & Elbaz, 2001; Hauser & Dwek, 2001).
The first leg on this route is to identify the sources contributing to the CIB. Ground-based surveys with the Submillimetre Common-User Bolometer Array (SCUBA) have revealed the existence of a population of distant, highly dust-obscured galaxies, similar to the Ultra Luminous Infrared Galaxies (ULIRGs) detected by IRAS (Smail et al., 1997; Hughes et al., 1998; Barger et al., 1998), which make up all the background at 850 m (Blain et al., 1999). However, at these wavelengths the energy in the CIB is only one-thirtieth of the value at its peak, and the SCUBA population only contributes 20–30% to the CIB at its peak (Coppin et al., 2006; Dye et al., 2007).
Recent progress has been made through new observations obtained at 24, 70, and 160 m by the MIPS instrument aboard the Spitzer Space Telescope (Rieke et al., 2004), and at 250, 350 and 500 m by the Balloon-borne Large Aperture Submillimeter Telescope (BLAST, Devlin et al., 2004; Pascale et al., 2008), a forerunner of the SPIRE instrument (Griffin et al., 2010) on the Herschel Space Observatory (Pilbratt et al., 2010). These wavelengths bracket the CIB peak; several authors have shown through stacking analyses that 24 m-selected galaxies resolve the CIB background, both on the short-wavelength side of the peak (Dole et al., 2006) and on its long-wavelength side (Devlin et al., 2009; Marsden et al., 2009).
Sources identified at 24 m are mostly unresolved in the FIR, and have a redshift distribution with median of 0.9 (Pascale et al., 2009). A detailed multiwavelength study of these sources is the necessary next step. Starting from a catalog of BLAST sources, Dye et al. (2009, hereafter D09) have identified counterparts in 24 m and radio catalogs (BLAST IDs). These tend to be relatively nearby sources (median of 0.6, inter-quartile range of 0.2–1.0), with a median dust temperature of 26 K and a median bolometric FIR luminosity of L☉, which contribute 20% to the CIB at 250 m. Identified BLAST sources typically lie at lower redshifts and have lower rest-frame dust temperatures compared to submillimeter (submm) sources detected in surveys conducted with SCUBA (Chapman et al., 2005; Pope et al., 2005). However, D09 also note that the of BLAST sources without identified counterparts probably lie at higher redshifts on average. Finally, D09 illustrate how the apparent increase in dust temperature and FIR luminosity with redshift occurs as a result of selection effects.
We also note that three other multi-wavelength studies of fainter BLAST sources discovered in the deepest part of the map have been undertaken. Dunlop et al. (2010) concentrate on 250 m radio-identified sources within GOODS-S (Dickinson et al., 2003, see Section 2.1) where the deepest ancillary data coincide. Chapin et al. (2010) use overlapping BLAST 250–500 m and LABOCA 870 m (Weiß et al., 2009) data in the larger Extended Chandra Deep-Field South (ECDFS) to constrain the Rayleigh-Jeans tail more accurately than was possible in D09. Finally, Ivison et al. (2010) study the FIR/radio correlation for a catalog of BLAST 250 m-selected galaxies in the ECDFS; this sample is deeper than the D09 one, and yet slightly shallower than the selection in Dunlop et al. (2010). There is little overlap between the sources used in these studies and the shallower/wider-area sample from D09.
The basis of our present study is the D09 sample as its brighter, and lower-redshift objects were most easily followed-up in the optical and UV. However, we first extend the submm analysis of D09 by accounting for flux boosting, source blending and correlations among BLAST bands that inevitably arise in IR surveys as a consequence of finite instrumental angular resolution and source confusion (Coppin et al., 2005). We then identify counterparts to the BLAST IDs in the near- and far- UV GALEX maps, in order to quantify the total dust-obscured and unobscured star formation, as described by several authors (Bell, 2003; Hirashita et al., 2003; Iglesias-Páramo et al., 2006; Buat et al., 2007). We also extend the analysis of Eales et al. (2009, hereafter E09) to combine spectroscopic data of BLAST IDs with optical, near-IR (NIR) and mid-IR (MIR) photometry in order to place firmer constraints on source redshifts, morphology, AGN fraction, and stellar masses.
We are able to assign spectroscopic and photometric redshifts to 62% of the BLAST IDs. We use this information to estimate the rest-frame total FIR luminosity from the combined BLAST and MIPS photometry. We compare our FIR luminosities with those obtained from MIPS photometry only, finding a significant discrepancy for high luminosity sources ( L☉) at . The BLAST and SPIRE wavebands are therefore fundamental in constraining the peak of hidden star formation at high redshift (see also e.g. Schulz et al., 2010; Elbaz et al., 2010).
In addition, UV counterparts are found for about 60% of the BLAST IDs. This allows us to estimate the fraction of UV photons that manage to escape the dust shroud, which is then combined with FIR data to build an estimator of the total star-formation rate (SFRtot) ongoing in these sources. Recent observations at the same wavelengths (Rodighiero et al., 2010) delineate the UV contribution as marginal at all redshifts. We find that star formation is heavily obscured at L☉, , but unobscured starlight plays an important role in low redshift, low FIR luminosity sources (, L☉), in agreement with Buat et al. (2010).
We reanalyze the optical spectroscopy data from the AAOmega survey presented in E09 to obtain H equivalent widths and [NII]/H line ratios. This spectral analysis, combined with a qualitative study of the radio, MIR and optical emission, allows us to assess whether or not a BLAST galaxy is hosting an active nucleus: roughly 20% of the objects in our sample show evidence of AGN presence. Recent observations of FIR-selected samples (Wiebe et al., 2009; Coppin et al., 2010; Muzzin et al., 2010; Hatziminaoglou et al., 2010; Shao et al., 2010; Elbaz et al., 2010) show that the submm emission of such objects is mainly due to star formation ongoing in the host galaxy, rather than due to the AGN. Therefore we do not to explicitly exclude AGN from our analysis, unlike other authors (Bell, 2003; Iglesias-Páramo et al., 2006; Buat et al., 2007), but rather flag them as such. Visual examination of BLAST IDs in UV, optical and MIR images (see Appendix A) is used to derive a broad morphological classification of these objects: at low redshift we find predominantly spirals, whereas most of the BLAST sources identified at high redshift are compact and show AGN signatures. This is probably a selection bias, as the fraction of submm sources identified at other wavelengths gradually decreases with (see D09), and the farthest objects can often be identified only if they are particularly bright in the radio or in the optical, frequently an indication of AGN presence. As a matter of fact, the analysis carried out by Dunlop et al. (2010) shows that a deep survey at 250 m not only contains low- spirals, but also extreme dust-enshrouded starburst galaxies at . Our analysis tends to miss the latter because they are typically extremely faint in the optical/UV, unless they also host an AGN.
Finally, stellar masses () are estimated using the method detailed in Dye (2008), in order to study whether or not specific star-formation rates (SSFR SFR/) depend on stellar mass and . The SSFR plays an important role as it measures the time scale of recent star formation in a galaxy, as compared to the star-formation rate integrated over the galaxy’s history. Several studies (Santini et al., 2009; Rodighiero et al., 2010, and references therein) report that the SSFR increases with redshift at all masses, whereas the dependence of SSFR on mass is one of the most debated questions. In particular, we aim to understand whether or not sources selected at wavelengths longward of 200 m are experiencing a major episode of star formation, forming stars more actively than in their recent past and building up a substantial fraction of their final stellar mass. We highlight a dichotomy in the BLAST population: sources at appear to be run-of-the-mill star-forming galaxies with intermediate stellar masses (median M☉) and approximately constant SSFRs, whereas the high- tail of the BLAST counterparts significantly encroaches on the SCUBA population detected in the SHADES survey (Dye et al., 2008), in terms of both stellar masses and SSFRs. This is expected since there is good overlap between fainter BLAST sources and 870 m-selected galaxies (Dunlop et al., 2010; Chapin et al., 2010), but it is also important to establish an additional link with a shallower BLAST sample, using a methodology equivalent to that of SHADES. In addition, since the more massive BLAST galaxies at intermediate redshifts () seem to form stars more vividly than the equally massive and aged 24 m sources detected in the GOODS survey, we suggest that the BLAST counterparts may act as linking population between the 24 m-selected sources and the SCUBA starbursts.
The layout of this paper is as follows. In Section 2 we describe in detail the maps, images and catalogs used throughout this paper. Section 3 and Section 4 are concerned with luminosities and star-formation rates in the FIR and UV, respectively. In Section 5 we build a unified estimator of total star formation and discuss the first results. In Section 6 we estimate the AGN content of our sample, while in Section 7 we outline a broad morphological scheme for our sources. In Section 8 we compute the stellar masses and present the main results. Section 9 contains our conclusions. Throughout this paper we assume the standard concordance cosmology: (Hinshaw et al., 2009).
2 Data
This Section describes the data sets used for our analysis, spanning from the UV to the submillimeter.
2.1 Submillimeter data
We use data from the wide-area extragalactic survey of BLAST described by Devlin et al. (2009), and centered on the Great Observatory Origins Deep Survey-South (GOODS-S, Dickinson et al., 2003, which in turn is centered on the Chandra Deep-Field South, CDFS) region. The maps cover an area of 8.7 deg2 with a depth of 36, 31 and 20 mJy at 250, 350, and 500 m, respectively. We refer to this region as the BLAST GOODS South Wide (BGS-Wide). A smaller region of 0.8 deg2 (BGS-Deep) nested inside BGS-Wide has a depth of 11, 9 and 6 mJy at 250, 350, and 500 m, respectively. These depths account for the instrumental noise only, and do not include confusion. Marsden et al. (2009) estimate that fluctuations arising from unresolved sources are a factor two larger than instrumental noise at 500 m, in BGS-Deep. Catalogs of sources detected at each wavelength in BGS-Deep and BGS-Wide are presented by Devlin et al. (2009).
D09 combine these single-wavelength catalogs by selecting sources with a (instrumental only, no confusion noise) significance in at least one of the bands. They use this multi-band catalog to identify counterparts (BLAST primary IDs) in deep radio (ACTA and VLA, Norris et al., 2006; Miller et al., 2008) and 24 m (SWIRE and FIDEL, Lonsdale et al., 2004; Dickinson & FIDEL team, 2007; Magnelli et al., 2009) surveys. The BLAST primary IDs all have probability of being a chance alignment. They also compile a list of secondary IDs, with different counterparts associated to the same BLAST source as the primary ID, but with larger probability of being a chance alignment.
In this work we present an extended version of the D09 catalog of BLAST primary IDs which contains 227 BLAST sources. In the following sections we update this list to include UV data, recent redshifts, corrections for submm flux boosting and blending, morphology, AGN features, and star-formation rates (see Appendix B for data tables). The list of secondary IDs is extensively discussed in E09 and we do not investigate them further.
We emphasize again that the sample studied in this work comprises the subset of BLAST-selected bright sources for which optical spectroscopy/photometry is available, and/or for which we find a clear counterpart in the UV. Naturally, this is only a fraction of sources that would be in a purely BLAST-selected catalog, skewed towards lower redshifts and strong optical/UV fluxes.
2.2 Optical spectroscopy
A spectroscopic follow-up of the BLAST IDs was carried out with the AAOmega optical spectrograph at the Anglo-Australian Telescope. The BLAST spectroscopic redshift survey is discussed in E09, as well as the reduction of the spectral data; here we extend their analysis and results (see Sections 6, 7 and Tables 2, B1).
AAOmega (AAO, Sharp et al., 2006) consists of 392, 2″-wide fibers feeding light from targets within a 2∘ field-of-view; the configuration of diffraction gratings was chosen to yield a wavelength coverage from 370 to 880 nm, with spectral resolution . At redshifts lower than 1, this allows us to detect two or more of the following lines: [OII] 372.7, Calcium H and K, H,[OIII] 495.9 and 500.7, H, [NII] 658.3 and [SII] 671.6 and 673.1. At redshifts greater than 1, we only rely on broad emission lines, such as Lyman , SiIV 140.3, CIII] 190.9 and CIV 154.9.
We have produced two prioritized lists of targets. The first list comprises BLAST sources with primary radio or 24 m counterparts111If only the 24 m counterpart is present, we refine the position of the source by matching it with optical or IRAC 3.6 m coordinates.. Sources selected at 24 m are also included in the target list to use all the available fibers. The second list contains the secondary BLAST IDs, plus 24 m sources.
The net observing time for the list of primary targets was 7 hr, obtaining spectra for 669 sources (316 BLAST IDs, and 356 SWIRE sources). The list of secondary targets was observed for only 1 hr (due to poor weather), obtaining 335 spectra (77 BLAST IDs, and 258 SWIRE sources). Spectroscopic redshifts were consequently obtained by E09 for 212 BLAST IDs in the primary list, 193 of which have confidence level (c.l.), and for 11 BLAST IDs in the secondary list (all with c.l.).
It is important to clarify here that the two lists used for the AAO observations are not fully coincident with the D09 list discussed in the previous section and used in this work. However, a large overlap among sources in these lists is present and 82 sources from the D09 catalog of BLAST IDs have AAO redshifts, all with c.l. (see Table B1).
Using the available spectra we estimate H Equivalent Widths (EWs) and [NII]/H line ratios for 56 of these 82 sources. The remaining 26 sources either are at too high redshift for the H line to fall in our spectral coverage (), or have spectra with poor signal-to-noise ratio. We calculate the uncertainties on the EWs as quadrature sum of the measurement error, estimated with a bootstrapping technique applied to the individual spectra, and the Poisson noise, estimated following Vollmann & Eversberg (2006, Equation 7).
2.3 UV data
We identify near-UV (NUV) and far-UV (FUV) counterparts to BLAST IDs by searching for GALEX sources in the Deep Imaging Survey (DIS, Martin et al., 2005, data release GR–4/5) within 6″ of the radio or 24 m counterpart222If both counterparts are present, we use the arithmetic mean between the two sets of coordinates: [, ]., a separation just slightly larger than the GALEX PSF FWHM (Morrissey et al., 2007). This choice is justified by the presence of a few extended objects, unresolved by the submillimetric beam, that contribute to the same BLAST source (see Section 7). After visual inspection of the UV images, we have added one additional interacting system extending beyond 6″ from the BLAST ID (#2); in this case we integrate the UV magnitude from both the interacting objects, because they fall within the same BLAST beam. We estimate FUV and NUV magnitudes using the standard GALEX pipeline (Morrissey et al., 2007) for most IDs, whereas we perform aperture photometry on 13 extended objects. A magnitude is considered to be unreliable if the source is either confused or blended with a star.
We find that 144 BLAST IDs have a NUV counterpart (136 with reliable magnitude), and 113 have a FUV counterpart (107 with reliable magnitude). Three sources are outside the area covered by the DIS, and the remaining 80 BLAST IDs have no obvious counterpart. By comparing the flux estimates for objects detected in more than one GALEX tile (pointing), we find that the average uncertainty associated with the reproducibility of the measurement is 0.06 and 0.11 mag in NUV and FUV, respectively. For bright galaxies, these values are larger than the uncertainty in the calibration (0.03 and 0.05 mag in the NUV and FUV, respectively; Morrissey et al., 2007), and in the source extraction procedure ( mag). The uncertainty on a quoted UV magnitude is therefore the sum in quadrature of these three terms, and it lies in the range of 0.07–0.25 mag and 0.12–0.5 mag in NUV and FUV, respectively.
2.4 SWIRE 70 and 160 m MIPS maps
We use 70 and 160 m fluxes extracted from SWIRE maps (Lonsdale et al., 2004) at positions [, ] to constrain the SED of each BLAST source at wavelengths shorter than the emission peak (see Section 3.2). These maps overlap almost completely with BGS-Wide, and all the BLAST sources investigated in this work lie within them. The depth of the maps is 3.6 and 20.8 mJy at 70 and 160 m, respectively.
2.5 MIR/NIR/optical images and catalogs
In addition to the aforementioned UV GALEX images, we investigate BLAST source morphology using optical and IR images. The latter are 3.6, 4.5, 5.8, and 8 m IRAC (Fazio et al., 2004) images from the SWIRE survey. In the optical, we examine ()-band images, acquired with the 4m Cerro Tololo Inter-American Observatory (CTIO) as part of the SWIRE survey, and -band images from the COMBO–17 survey (Wolf et al., 2004, 2008). In Figure A1 we show cut-outs for a selection33footnotemark: 3 of BLAST IDs.
For the purpose of studying the morphology, AGN fraction and stellar mass, we have also matched, using a search radius of 3″ as in D09, the catalog of BLAST IDs to the following catalogs:
-
1.
the SWIRE band-merged catalog consisting of optical () and MIR IRAC fluxes444The lower limits for inclusion in the catalog are 7 (), 7 (), 41.8 () and 48.6 Jy () at 3.6, 4.5, 5.8 and 8 m, respectively. (Surace et al., 2005);
- 2.
-
3.
the Multi-wavelength Survey by Yale-Chile (MUSYC; Gawiser et al., 2006) catalog for NIR photometry (- and -band).
As a result of this analysis, out of 227 BLAST IDs:
-
•
205 (90%) have an IRAC counterpart from the SWIRE survey;
-
•
114 (50%) have an optical (SWIRE and/or COMBO–17), and either a NIR (MUSYC) or MIR (3.6 or 4.5 m, IRAC) counterpart555We note that the sky overlap among BGS, SWIRE, COMBO–17 and MUSYC is limited to a deg2 region.;
-
•
102 of the above 114 are detected in a minimum of 5 bands (optical, NIR and MIR);
-
•
52 of the above 102 have - and -band photometry from MUSYC.
We use the wealth of ancillary information for a variety of purposes: we refer to Sections 6, 7 and 8 for discussions on AGN fraction, morphology and stellar masses.
2.6 Redshifts
In addition to the 82 spectroscopic redshifts obtained with AAO for the BLAST primary IDs, we have found 5 additional spectroscopic redshifts by exploring the NASA/IPAC Extragalactic Database (NED) with a 1″ search radius around each ID. For the other sources, we use photometric redshifts from the MUSYC-EAZY (Taylor et al., 2009), COMBO–17 (Wolf et al., 2004, 2008, only sources with ) and Rowan-Robinson et al. (2008, RR08) catalogs, using again a 1″ search radius. We carefully inspect each individual alignment by taking into account the imaging data in Figure A1, the UV photometry, the SED in the FIR/submm, and any additional information available from NED. In cases of BLAST IDs with more than one associated photometric redshift, priority is given in the order: EAZY, COMBO–17, and RR08. We have thereby acquired 53 additional photometric redshifts, of which 20 are from EAZY, 6 from COMBO–17 and 27 from RR08.
We have succeeded in assigning 140 redshifts out of 227 () objects in our sample. The redshifts are listed in Table B1, along with their provenance. Figure 1 shows the redshift distribution of the whole BLAST ID catalog, and of the UV subset used in Section 5 for discussion of the total star-formation rates. The number of sources with redshift is doubled with respect to the robust sample of D09666The robustness of a source is assessed by D09 based solely on the goodness of the SED fit., but the median redshift is roughly halved. This apparent pronounced discrepancy, limited to the bin, amounts to 40 sources and is due to the combination of two selection effects. First, roughly 15 sources in D09 with (mostly from RR08) do not make it into the robust sample, mainly because the photometric redshift is intrinsically unreliable or, in a handful of cases, because the BLAST source has been spuriously identified with the counterpart. Second, 27 other sources with redshifts estimated in this work have no redshift in D09, because they have neither sky coverage from COMBO–17 nor from RR08; of these 27, 21 are from AAO, and 24 have . Therefore the apparent excess of low- sources with respect to D09 partly reflects the inclusion of the AAO spectroscopic redshifts (naturally skewed towards low-) and partly lies in the intrinsic robustness in D09 of either the photometric redshift or the counterpart itself.
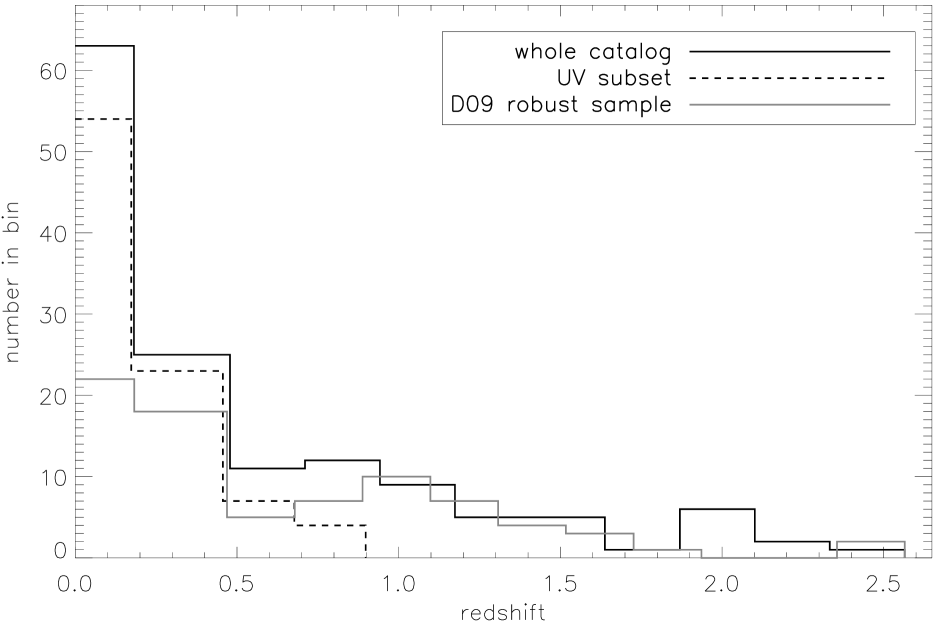
It is worth noting here that this study misses a large fraction of the high- BLAST sources that are known to constitute an important part of the BLAST population (Devlin et al., 2009; Marsden et al., 2009; Pascale et al., 2009). This is again due to the combination of two factors. First, of the BLAST IDs presented in this paper do not have a redshift estimate; using information about the UV identification rate (similarly to D09), we can argue that more than half of the sources without a redshift estimate lie at . In fact, 90 out of 99 (91%) sources at (and 96 out of 115, 83%, sources at ) have a GALEX counterpart; now, of the 87 sources with no redshift estimate, 57 (66%) do not have a GALEX counterpart. Under the assumption that the UV identification rate is a reasonable (if coarse) estimator of redshift, arguably more than half of the sources without a redshift estimate lie at and roughly half lie at . Secondly, D09 starts with a catalog composed of bright, sources with flux densities mJy at 250 m, mJy at 350 m, and mJy at 500 m; Dunlop et al. (2010) and Chapin et al. (2010) clearly show the necessity of digging deeper into the BLAST maps, with the aid of the deepest available multi-wavelength data, in order to identify the faintest, high- BLAST galaxies. Of course, this is done at the expense of the size of the submm sample, which inevitably drops to a few tens of sources.
Nonetheless, the present study is still unique in terms of size of the sample, wavelength coverage, depth and quality of the ancillary data. Indeed, IRAS sources have been studied at many wavelengths (e.g. Della Valle et al., 2006; Mazzei et al., 2007), but with little knowledge of the details of the cold dust emission from which the FIR star-formation rate estimates come. Some improvements have been made with the SCUBA Local Universe and Galaxy Survey (SLUGS; Dunne et al., 2000; Vlahakis et al., 2005), but still with limited ability to estimate the bolometric FIR luminosity. The results in this paper probably will not be immediately replaced by deeper surveys undertaken by Herschel; in fact, even the much more sensitive observations carried out with SPIRE will have to face the lack of deeper ancillary data. This is especially true in the optical/NIR, where most of the submm galaxies are much too faint to be detected by instruments like AAOmega, and in the radio, where the identification rate of the faintest sources drops drastically, even when using the deepest available data (VLA).
3 FIR luminosities and SFRs
3.1 Deboosting the BLAST fluxes
The sources in the BLAST catalog used by D09 to identify counterparts in the radio and 24 m were detected directly from the maps of BGS-Deep and BGS-Wide. While the details of the catalog are discussed there, it is useful to summarize here the procedure to clarify what are the potential biases.
First, a catalog of BLAST sources with detection significance higher than 3 is made at each wavelength, independently. Each entry in the catalog is then positionally matched across the three bands, with the requirement of a 5 detection in at least one band. The significance here is relative to instrumental noise, and does not include confusion noise. A new position is assigned to the source by averaging its positions in the original single-wavelength catalogs, with weights estimated by taking into account the beam sizes and the signal-to-noise ratios (SNRs) of the detections at each wavelength. This combined catalog is then used to identify counterparts in the radio and at 24 m, and a new flux density is measured from the 70 to 500 m maps at the accurate position of the counterpart.
The BLAST differential source counts fall very rapidly with flux density (approximately following , Patanchon et al., 2009), thus Eddington bias as well as source confusion will cause the fluxes to be boosted. This effect has to be estimated to properly compute the FIR luminosity of each source. Coppin et al. (2005) have proposed a Bayesian approach that can be applied to estimate the most likely flux distribution when the noise properties of the detection and the underlying source distribution are known. Their method is derived under the assumption that the flux density comes from just one source, plus noise. This cannot be applied to BLAST sources because of blending: the measured flux density can either come from just one source, or more likely from several sources blended together by the beam, which then appear as one single source of larger flux density.

We have developed a different method to account for boosting of BLAST fluxes, which is entirely based on Monte Carlo simulations. We generate 100 noise-less sky maps using the BLAST measured count models (Patanchon et al., 2009), and no clustering. Noise is added to each simulated map to a realistic level for the BGS-Deep and BGS-Wide regions. Sources are then retrieved with the same method used on the real maps (Devlin et al., 2009). Considering all the input components within a FWHM beam distance from each retrieved source, we stipulate that the input component with largest flux density is the actual counterpart777We know that this assumption is always verified in BGS-Wide but less so in BGS-Deep, where, in 21% of the cases, the second brightest component contributes to more than 50% of the retrieved flux (see E09, Appendix B). (ID). The source flux density is then remeasured at the position of the ID. Finally, we compare this flux density with that of the input source. By repeating this for each source detected in each simulation, we generate distributions of input/output SNR, where the relevant noise is the instrumental noise at the position of the ID. These simulations are similar to those used in Chapin et al. (2010) to study the effects of confusion for their deeper sample.
Figure 2 shows the result of this analysis. In each bin we display the median of the distribution of input SNR (labeled SNRID) corresponding to the measured SNR. The error bars define the first and third interquartiles. To obtain the deboosted flux density likelihood, it suffices to multiply the -axis by the corresponding instrumental noise. It is clear from this figure that sources in the BGS-Wide region are only moderately affected by boosting. The situation is substantially different for BGS-Deep, and the effect of boosting increases with wavelength, as expected, due to the telescope PSF becoming larger. At the longest BLAST wavelength, the fluxes are severely affected by boosting: a source detected even with a 10 significance level has a deboosted flux only about half of what is measured directly from the map. By comparing the deboosted values for BGS-Wide at 250 and 350 m, we notice that the longer wavelength appears to be slightly less biased. This arises from the fact that the two PSFs are not very different in size (36 and 42″, respectively), but the 250 m PSF has larger sidelobes (Truch et al., 2009).
3.2 SED fitting and FIR luminosities
In order to estimate the rest-frame FIR luminosity () of each BLAST source in our sample, we perform SED fitting using the MIPS flux densities (70 and 160 m only) and the deboosted BLAST flux densities; the model template is a modified blackbody spectrum (with spectral index , Hildebrand, 1983), with a power law replacing the Wien part of the spectrum, to account for the variability of dust-temperatures within a galaxy (we choose , Blain et al., 2003; Viero et al., 2010). Pascale et al. (2009) have shown that the estimated FIR luminosities depend weakly on the choice of , whereas the estimated dust temperatures are more sensitive to the template used. Since our analysis does not employ temperature measurements, the value of we adopt is not critical. We also note here that the SED template chosen is the one that best performs in fitting the spectrum of two often-used IR-luminous local galaxies, Arp 220 and M82; by sampling their SEDs at the five observed wavelengths in question, the nominal FIR luminosities and dust temperatures are correctly retrieved (within uncertainties) not only at , but also when their spectra are redshifted up to .
The way each BLAST flux density is deboosted depends on its SNR. If this is larger than 15, no correction is applied. If the measured flux density is smaller than twice the square root of the sum in quadrature of instrumental and confusion noise (as reported in Marsden et al., 2009), the detection is treated as an upper limit. In all other cases, the above deboosting distributions are used. For sources in BGS-Deep the deboosting likelihood distribution is well approximated by a Gaussian function, but this is less true in BGS-Wide (especially at low SNR). Therefore, we use the sampled distribution for sources in BGS-Wide, and a Gaussian approximation in BGS-Deep.
The portion of noise arising from confusion is highly correlated among bands. The Pearson coefficients of the correlation matrix are listed in Table 1, and have been estimated from the (beam-convolved) BGS-Deep and BGS-Wide maps. As expected, the correlation effects are more important for sources in BGS-Deep, and we do take this into account in the SED fitting algorithm, whereas no correlations among bands are considered for sources in BGS-Wide. This turns out to be convenient, as in BGS-Deep the distributions are Gaussian, and a correlation analysis is relatively straightforward. This would not be the case for the sources in BGS-Wide.
| Band | Pearson correlation matrix | |||||
|---|---|---|---|---|---|---|
| BGS-Deep | BGS-Wide | |||||
| [m] | 250 m | 350 m | 500 m | 250 m | 350 m | 500 m |
| 250 | 1 | 0.68 | 0.66 | 1 | 0.26 | 0.29 |
| 350 | 1 | 0.69 | 1 | 0.29 | ||
| 500 | 1 | 1 | ||||
MIPS fluxes at 70 and 160 m were also used in the fitting routine to constrain the SED at wavelengths shorter than the emission peak. Deboosting these bands is beyond the scope of this paper, and it is less necessary because the source counts are shallower than the BLAST ones (see Frayer et al., 2009; Béthermin et al., 2010). The SED fitting procedure copes with the size of the photometric bands (color-correction), and the instrumental plus photometric uncertainties (Truch et al., 2009). Correlations are properly taken into account via a Monte Carlo procedure.
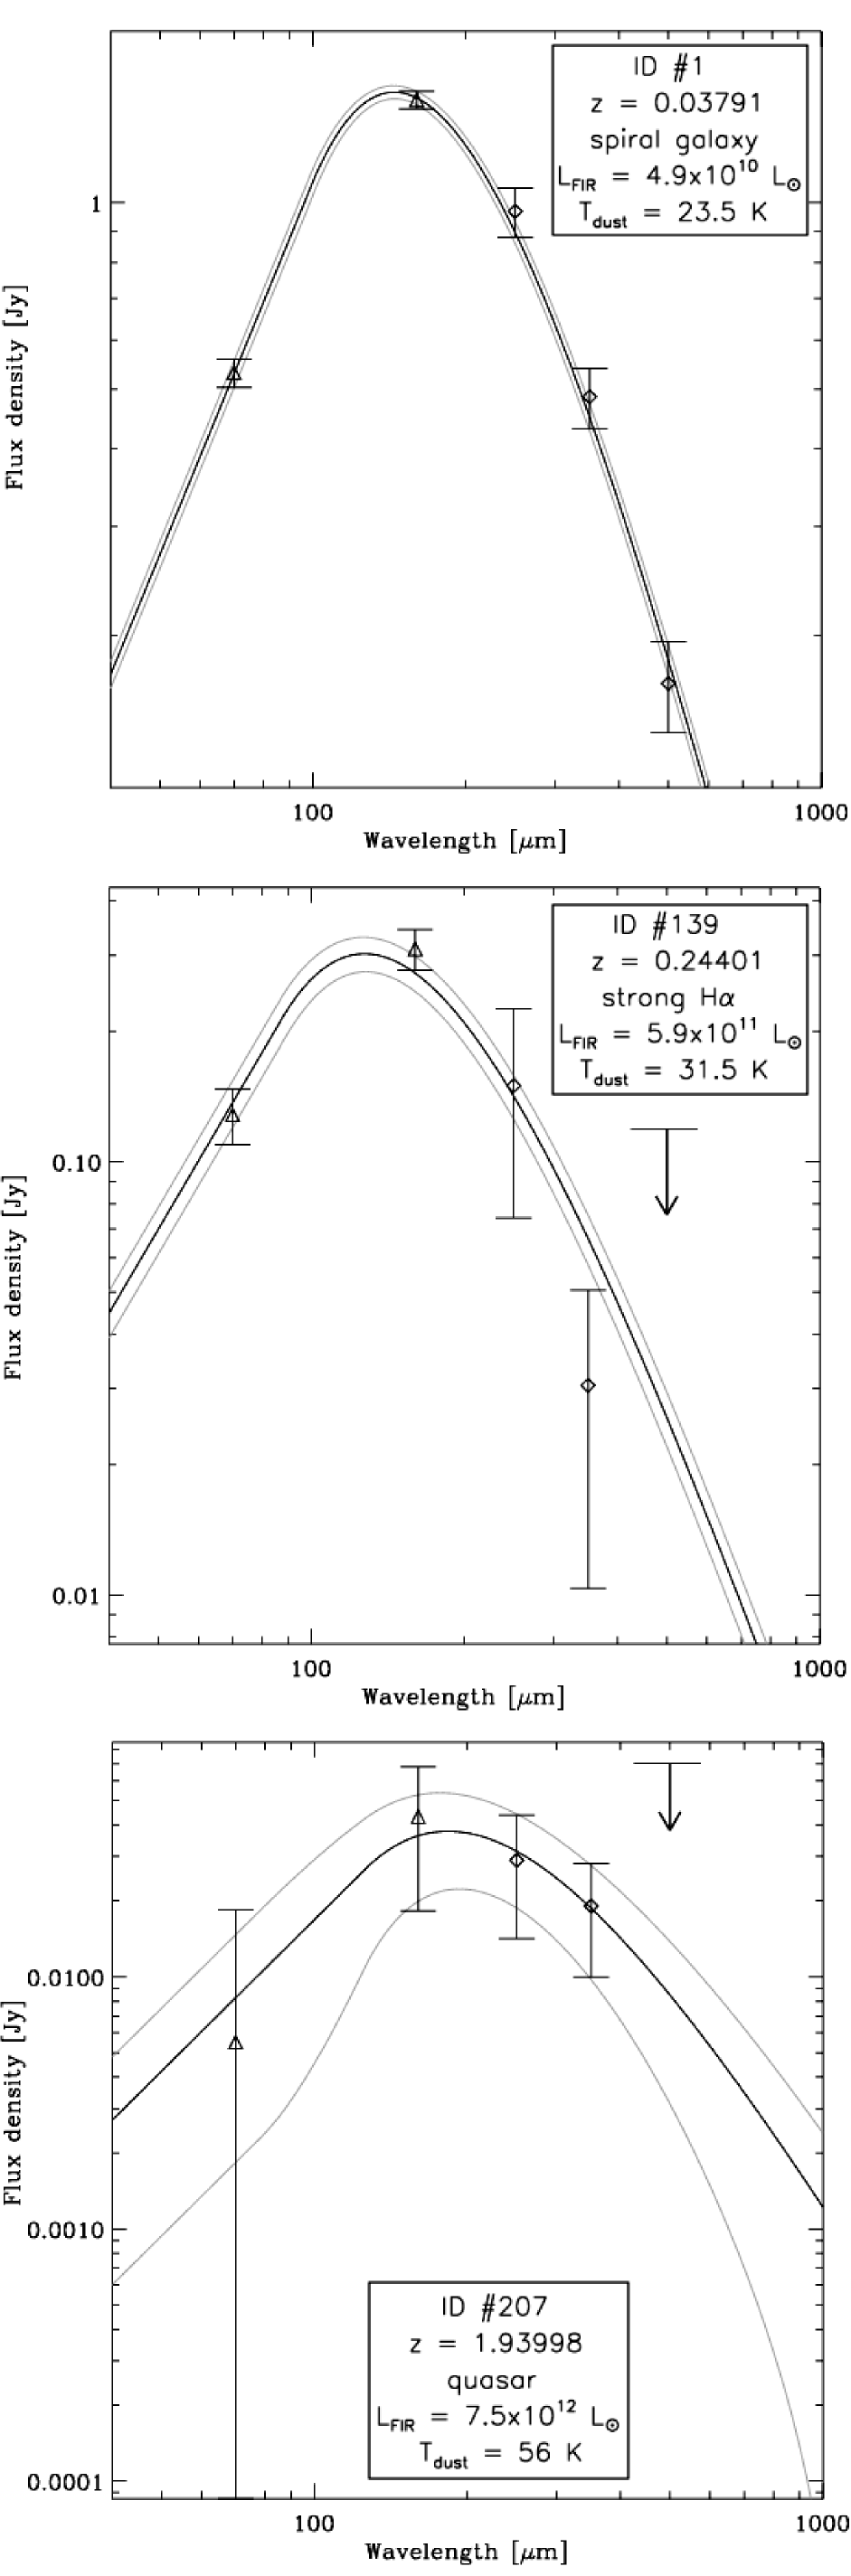
In Figure 3 we show the fitted FIR SED for three representative objects in our sample: a low-redshift spiral galaxy; a mid-redshift strong H emitter; and a high- quasar. The resulting FIR luminosities, listed in Table B2, are the rest-frame SED integral between 8 and 1000 m (Kennicutt, 1998).
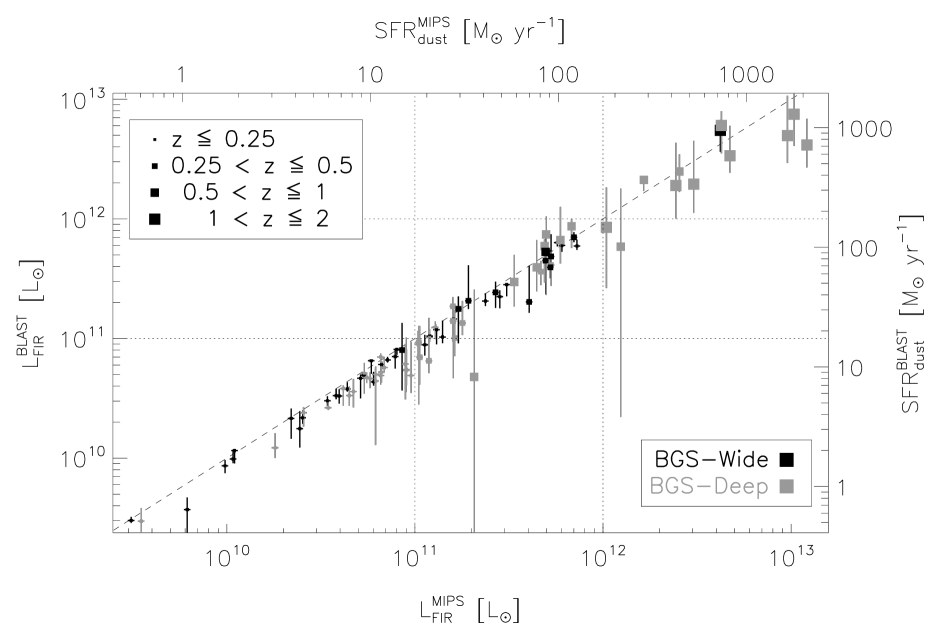
In Figure 4 we compare our estimates of rest-frame FIR luminosity with those obtained using only MIR flux densities, to investigate the level of uncertainty when data are not available in the submm. Following the prescription of Dale & Helou (2002), we calculate the FIR luminosities using only MIPS flux densities (24, 70 and 160 m) for a subset of 93 sources with 24 m counterpart. There is considerable agreement up to L☉ and . At higher redshifts (and luminosities) we find a poorer concordance; the MIPS-only estimates tend to overestimate the FIR luminosity, by as much as a factor of two in some cases. Other authors (Pope et al., 2006; Papovich et al., 2007; Kriek et al., 2008; Murphy et al., 2009; Muzzin et al., 2010; Elbaz et al., 2010; Nordon et al., 2010) find similar trends; this is expected as the MIPS bands sample the SED peak progressively less and less as redshift increases, thus pulling the SED toward shorter wavelengths, and resulting in a higher . This emphasizes how essential the BLAST and SPIRE wavebands are to constrain the IR emission peak of star-forming galaxies at high redshift (see also e.g. Schulz et al., 2010; Elbaz et al., 2010).
3.3 FIR Star-Formation Rates
The FIR luminosities are a sensitive tracer of the young stellar population and, under some reasonable assumption, can be directly associated to the Star-Formation Rates (SFRs). This is particularly true for dusty starburst galaxies, because the optically thick dust surrounding star forming regions is very effective in absorbing the UV photons emitted by young, massive stars and converting this energy into IR emission.
Under the assumption that the above is the only physical process heating up the dust, Kennicutt (1998) has derived the following relation between SFR and bolometric FIR luminosity:
| (1) |
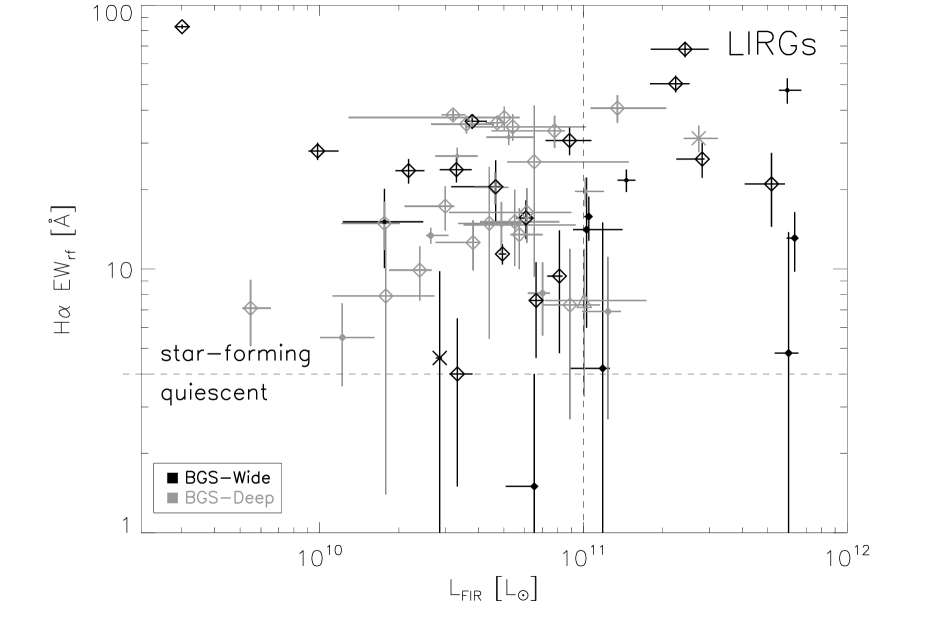
Our sample includes sources with a wide range of FIR luminosities. On one end, the FIR energy output is similar to the one found in Luminous IR galaxies (LIRGs, L☉), and Ultra Luminous IR galaxies (ULIRGs, L☉). In this type of source, AGN can play an important role in heating up the dust, resulting in a bias in the SFR calculation (an effect discussed further in Section 6). At lower FIR luminosities, we have strong additional evidence indicating that most of the galaxies sampled by BLAST are actively star-forming. This is shown in Figure 5: available H rest-frame Equivalent Widths (EWrf) are plotted against FIR luminosity for 56 sources at (see Section 2.2). The horizontal dashed line at 4 Å separates galaxies with ongoing star formation from quiescent ones (Balogh et al., 2004). All sources but one have H signature of ongoing star formation. It is highly unlikely that, despite the poor statistics of this plot, we could be missing a population of quiescent objects with L☉, whose FIR emission is due to a different physical process than the one described above.
Nonetheless, as the FIR luminosity decreases, our sources approach more normal star forming galaxies. In this type of source a non-negligible contribution to dust heating comes from older stellar populations, which would bias the SFR estimate high (Bell, 2003; Hirashita et al., 2003; Iglesias-Páramo et al., 2004, 2006). The reduced optical depth of dust also needs to be taken into account or it would result in a lower estimate of SFRs (Inoue, 2002). Both these effects are considered in the following discussion (Section 5) on the total SFR in our sample.
4 UV luminosities and SFRs
4.1 UV fluxes and rest-frame luminosities
The amount of unobscured star formation ongoing in each galaxy of our sample can be estimated in the UV for the BLAST IDs with a GALEX counterpart.
The (AB) UV magnitudes are corrected for extinction due to dust in our Galaxy, and converted into observed flux densities . Rest-frame UV luminosities are calculated as:
| (2) |
where is the luminosity distance.
4.2 UV Star-Formation Rates
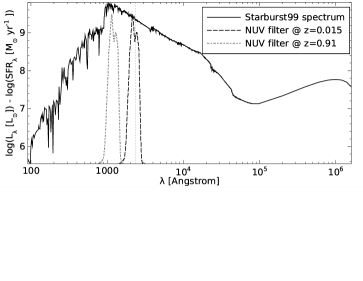
Star-formation rates in the UV are estimated following the approach of Iglesias-Páramo et al. (2006, and references therein). These are related to rest-frame luminosities in the FUV and NUV by using a synthetic spectrum obtained with starburst99 888Under the same assumptions of Iglesias-Páramo et al. (2006): continuous star formation, recent star-formation time scale yr, solar metallicity and Salpeter (1955) IMF from 0.1 to 100 M☉. (sb99; Leitherer et al., 1999) for a star-forming galaxy. In the wavelength range 1000–3000 Å, the shape of the spectrum (shown in Figure 6) is very weakly dependent on the underlying stellar populations (e.g. Kennicutt, 1998), and has a slope.
NUV star-formation rates are estimated using the equation:
| (3) |
where is the rest-frame luminosity calculated from the observed near-UV magnitude using Equation 2. is a redshift-dependent numerical factor which incorporates the -correction, and is derived from sb99, integrating over the GALEX filter profile :
| (4) |
SFRFUV and are obtained in a totally analogous way. The values of and are the same as those used by Iglesias-Páramo et al. (2006) at . The photometric errors described in Section 2.3 are propagated in the estimate of the uncertainties on the UV SFRs.
A redshift limitation arises when the observed NUV and FUV sample the rest-frame Lyman continuum. This happens at in the FUV, and in the NUV. Hereafter we exclude sources beyond these redshift limits, as their inferred SFRs would be unreliable. In order to have a more uniform and sufficiently large sample, in what follows we only consider the NUV subset, which counts 89 sources (see Figure 1 for their redshift distribution). As anticipated, the UV luminosities/SFRs are not corrected for intrinsic dust extinction, and are combined in the next section with FIR luminosities to build an estimator of total SFR that is independent of extinction models.
5 Total SFR
We now have two separate estimators for the star-formation rates in our galaxy sample, SFRdust and SFRNUV. Each of these is expected to have different biases and short-comings. One can clearly do better at estimating the SFR by combining the two estimators in some way. The best way to do this is not obvious though, since it depends on how each of the estimators was calibrated, on the assumptions that went into them, on the range of galaxy SEDs being studied, and on how these relate to local galaxies that were used for calibration, including radiative transfer effects and other complications. Because of this, we choose to follow a prescription to estimate the total SFR in a galaxy which has already been used by several authors (Bell, 2003; Hirashita et al., 2003; Iglesias-Páramo et al., 2006; Buat et al., 2007), so that we can at least compare our results to those of several related studies.
In order to estimate the total SFR (SFRtot) in our sample, we combine the contribution from the obscured star formation with the unobscured star formation:
| (5) |
A correction factor is applied to the dust contribution to account for the IR emission from older stellar populations. Following Bell (2003) and Iglesias-Páramo et al. (2006), we use different values of depending on whether the object in question is more likely to be a starburst ( for L☉) or a normal star-forming galaxy ( for L☉). As anticipated in Section 3.3, this method can account for both the contrasting effects that come into play when we try to estimate the total SFR budget for an inhomogeneous sample of objects. Namely, parametrizes the contribution to dust heating from older stellar populations as a function of the integrated FIR luminosity, whereas the contribution from the UV luminosity guarantees that all the UV photons that manage to escape the galaxy, due to the reduced optical depth of the dust, are actually taken into account.
We briefly recall here that the main selection effects of our sample are, on the one hand, that the rest-frame increases steadily with redshift (see Figure 4 and D09), and on the other hand that the UV luminosity estimates are not reliable beyond . Moreover, we stress the importance of the blending effects reported in Section 3.1, which may lead to misidentifications, particularly in BGS-Deep (sources in gray).
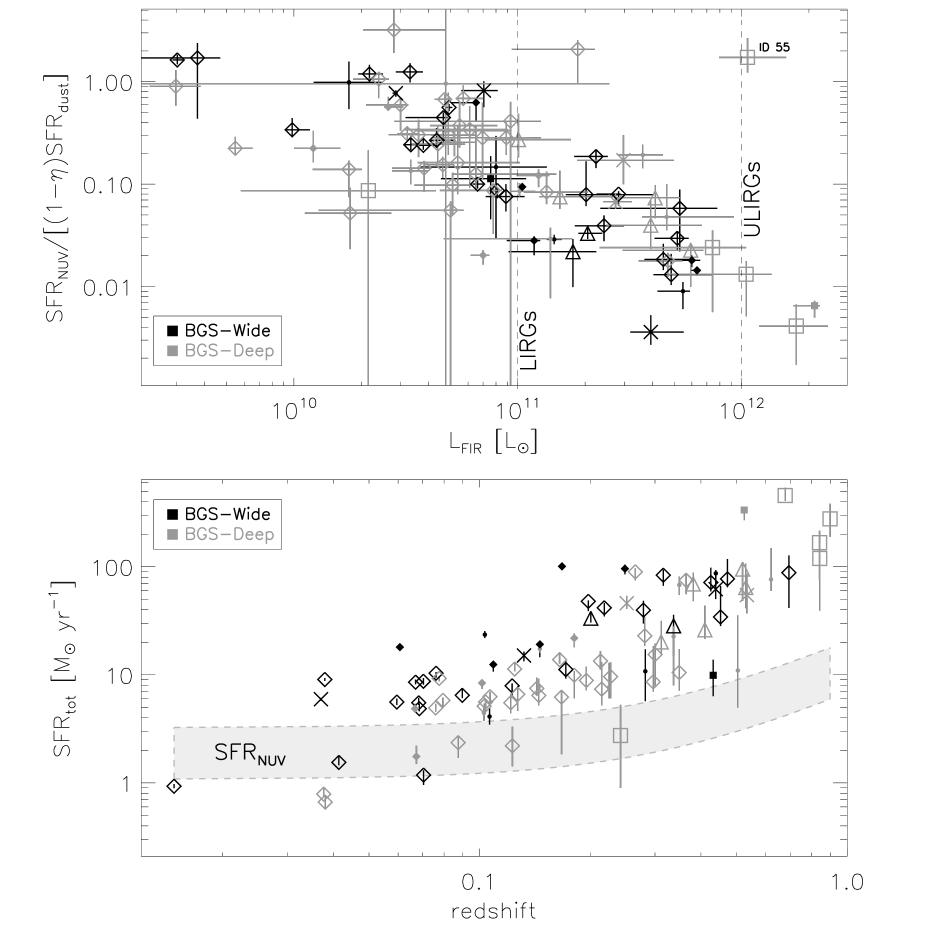
The results of this analysis are shown in Figure 7. In the top panel we plot the ratio of SFRNUV to SFRdust as a function of the FIR luminosity. With the exception of a few outliers999In particular, ID#55 could be a misidentification because there is a secondary counterpart, see E09., there is a clear trend, namely the NUV contribution is more important at low- (low-), whereas star formation is mainly obscured at L☉, . The same effect is evident in the bottom panel, where we plot SFRtot as a function of redshift. The gray shaded area shows the 1 confidence interval of a power-law fit SFR. Most sources with SFRtot larger than a few M☉ yr-1 have negligible contribution from the UV. This is consistent with what Takeuchi et al. (2009) find in the local Universe for a FIR-selected sample: at SFR M☉ yr-1, the fraction of directly visible SFR (SFRNUV) decreases. A very similar trend is also observed at higher redshifts by Buat et al. (2008), with a 24 m-selected sample at that closely resembles our sample at those redshifts, in terms of dynamic ranges and FIR-to-UV ratios.
Such a behavior in the individual BLAST IDs can be related to the greater evolution of the total FIR luminosity density with respect to the optical-UV one, as reported for instance by Pascale et al. (2009). On the other hand, we stress that at L☉, , FIR-only observations would lead to underestimates of the total SFR of at least a factor of 2.
By comparing our sample in Figure 7 with the IRAS/FIR-selected local sample of Iglesias-Páramo et al. (2006), we notice that the overlap is quite modest and limited to L☉, sources. We point out that this conclusion should not be diminished by considerations on the extent of the local volume sampled by the BLAST survey.
At the very high luminosity end, only two objects (one of which is flagged as quasar, see Section 6) with have a UV counterpart. We have thus investigated the 30 galaxies with L☉ in the full set of BLAST IDs, finding that 16 are flagged as quasars, most of which are optically bright. At , the optical and bands probe the rest-frame UV, and we calculate that these objects would virtually populate the top-right corner of the upper panel of Figure 7. However, the UV emission from quasars is strongly contaminated by the active nucleus, and cannot be directly associated with recent star formation. Of the remaining 14 ULIRGs with no AGN signatures, only 4 have optical magnitudes, and would occupy the bottom-right corner, indicating severe dust attenuation. We can therefore argue that, even if our subset of objects lacks the abundance of most luminous IR galaxies detected in the SHADES survey (see Coppin et al., 2008; Serjeant et al., 2008), SCUBA-like sources will likely lie in the bottom-right corner and beyond, following the same trend of increasing dust attenuation at higher FIR luminosities. This is a first hint that our analysis begins to detect SCUBA galaxies, which are known to overlap considerably with the fainter BLAST galaxy population, following joint studies of LABOCA 870 m and BLAST data (Dunlop et al., 2010; Chapin et al., 2010). We will discuss this in more detail in Section 8.
The 24 m-selected sample described by Le Floc’h et al. (2005) most resembles our sample in terms of – parameter space, although our objects are in general more massive, as we will see in Section 8. This, in combination with Figure 5, points to the conclusion that the BLAST counterparts detected in this survey at are mostly run-of-the-mill star-forming galaxies. Finally, given the steep number counts at the BLAST wavelengths (Patanchon et al., 2009) and the smaller beam sizes of Herschel, we expect SPIRE to detect roughly a factor of 10 more sources than BLAST, probing fainter fluxes and therefore higher redshifts. Figure 7 suggest that SPIRE will likely fill the L☉ region (see e.g. Chapin et al., 2010), but probably will not be dominated by SCUBA-like sources.
6 AGN fraction and quasars
In this section we describe the AGN and quasar content of our sample, and we investigate whether the submm emission that we see with BLAST is mainly due to the host galaxy or to the active nucleus.
AGN are identified using spectroscopic and photometric methods, and the information is listed in Table B1. Of the 82 sources in our sample with optical spectra, 56 have a measurement of the line ratio [NII]/H; 14 of these have [NII]/H and we flag them as AGN (Kauffmann et al., 2003; Miller et al., 2003, and references therein). Broad emission lines, such as CIII] 190.9 and CIV 154.9, which appear in the accessible waveband at , are used to identify 5 additional sources as quasars. A search on NED yields that 10 more sources in our sample are classified as AGN by other authors.
Active galaxies can also be identified using a number of photometric empirical methods. Quasars occupy a distinct region in the IRAC color space by virtue of their strong, red continua in the MIR (Lacy et al., 2004). IRAC fluxes are available for 205 sources and we use the 3 color-color cut prescriptions of Hatziminaoglou et al. (2005), Stern et al. (2005) and Marsden et al. (2009). Optical magnitudes and postage stamp images are also available for 114 sources, along with radio fluxes for 107 sources from D09. A source is considered a quasar when it is compact101010By “compact” we mean objects unresolved in the optical and MIR, with linear sizes kpc at . and satisfies the 3 aforementioned color-color cut prescriptions. If only 2 color-color cuts prescriptions are satisfied, we also require the source to be either radio-loud ( W), optically bright ( L☉), or one of the 10 NED AGN.
Using these empirical methods, we find 24 quasars plus 10 additional sources showing weaker yet significant quasar activity, when the above conditions are near the threshold. The 5 quasars identified spectroscopically are all contained in this photometric list. Of the 14 spectroscopically identified AGN, 10 are definitely not compact, but rather spiral in shape (see next Section on morphology), and mostly radio-quiet. We believe that these objects are Seyfert galaxies (e.g. Cid Fernandes et al., 2010).
In conclusion, we have assessed that about 15% of the galaxies in our sample show strong indication of having an active nucleus and an additional 6% have weaker yet significant evidence. Chapin et al. (2010) found a comparable proportion111111Only sources with a redshift estimate. of sources with excess radio and/or MIR that can be interpreted as an AGN signature. Several recent observations find close association of AGN activity and young star formation (Silverman et al., 2009), consistent with a scenario in which the FIR/submm emission is mainly due to star formation ongoing in the host galaxy, rather than to emission from a dusty torus obscuring the inner regions of the active nucleus (Wiebe et al., 2009; Coppin et al., 2010; Muzzin et al., 2010; Hatziminaoglou et al., 2010; Shao et al., 2010; Elbaz et al., 2010). In addition, our AGN selection criteria, which use optical and MIR data, tend to favor type-1 AGN, i.e. unobscured Seyfert galaxies and quasars. This is definitely the case for the IRAC color-color selection methods, as reported by Hatziminaoglou et al. (2005) and Stern et al. (2005), but it is also corroborated by the fact that most of the quasars we have identified are optically bright. We aim to address this issue in greater detail in a future paper.
7 Morphology
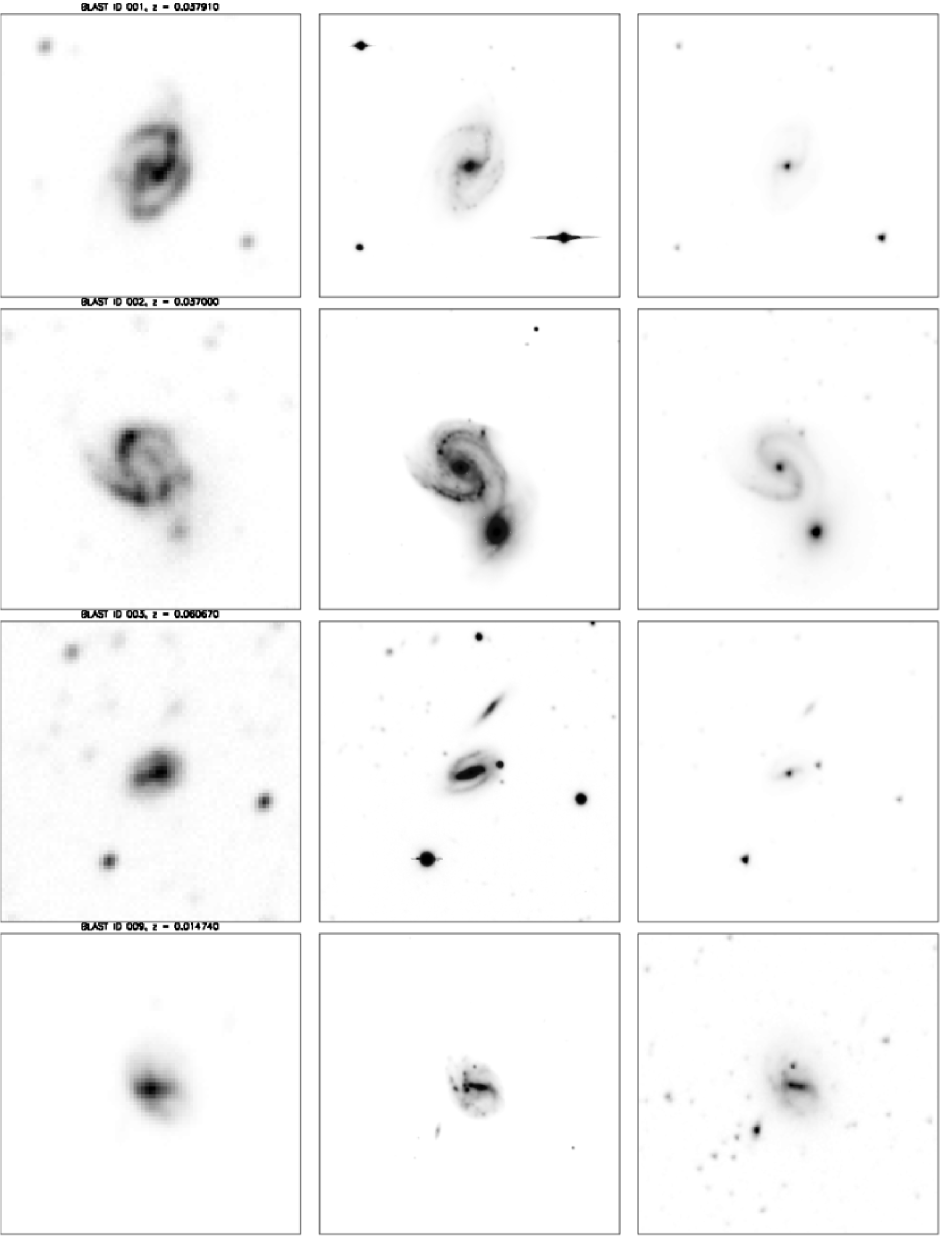
We have assigned a broad morphological classification to 137 (60%) of the BLAST IDs presented in this paper, based upon visual inspection of UV, optical and MIR postage stamp images (see Section 2.5) centered at [, ]. A selection of cut-outs is shown in Figure A1.
In addition to the visual examination of the multiwavelength images, we corroborated our choice with ancillary information (when available), such as: (a) location on the color-magnitude diagram, typically () vs ; (b) spectral features; (c) UV detection; (d) FIR luminosity. Our findings are listed in the “morphology” column in Table B1 and summarized in Table 2.
| type | sub-type | number | frequency |
|---|---|---|---|
| spiral | 69 | 50% | |
| Seyfert | 8 | 6% | |
| compact | 52 | 38% | |
| quasar | 31 | 23% | |
| blue compact | 5 | 4% | |
| red compact | 3 | 2% | |
| elliptical | 8 | 6% | |
| interacting system | 7 | 5% | |
| irregular | 1 | 1% |
Note. — Morphological classification available for 137 out of 227 BLAST IDs (60%), based upon visual inspection of UV, optical and mid-IR (MIR) postage stamp images (see Section 2.5). By “compact” here we mean objects unresolved in the optical and MIR, with linear sizes kpc. By “interacting system” we mean a visually obvious physical association of two or more objects.
At low redshift we find predominantly spirals, whereas most of the BLAST sources identified at high redshift are compact and show AGN signatures. This is probably a selection bias, as the fraction of submm sources identified at other wavelengths is known to gradually decreases with (see D09), and the most distant sources are often identified only thanks to their extreme radio and/or optical emission, due to the AGN. In fact, the study by Dunlop et al. (2010) shows that a deep survey at 250 m not only reveals low- spirals, but also extreme dust-enshrouded starburst galaxies at . The latter tend to be missed in our selection, because they are typically extremely faint in the optical/UV, unless they also host an AGN.
8 Stellar masses
Stellar masses () are computed by Dye et al. (2010b) for a subset of 92 sources in our sample with counterparts in a minimum of 5 bands, from the optical to NIR. The distribution has median of M☉, and inter-quartile range of – M☉.
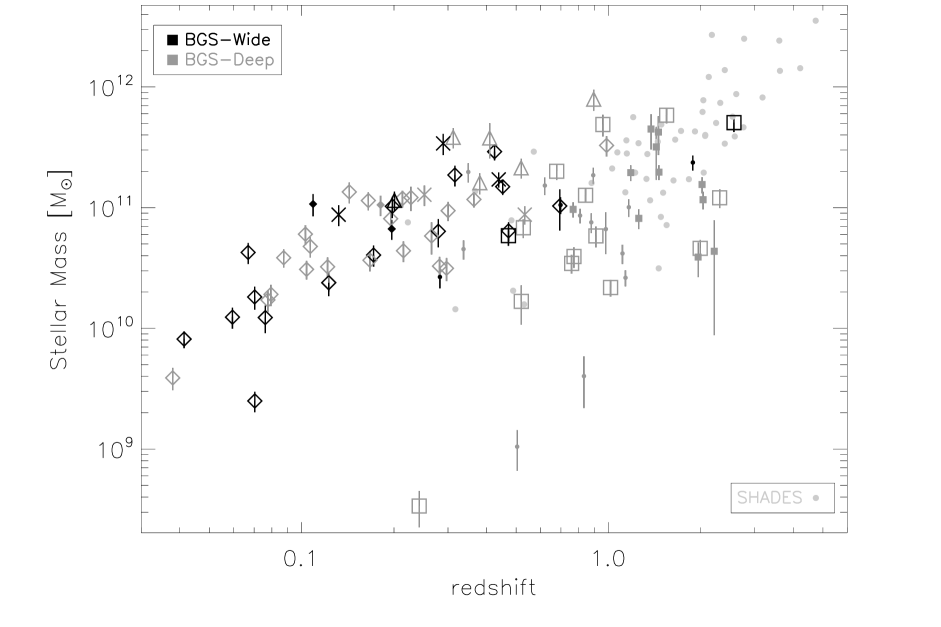
These stellar masses are plotted vs. redshift in Figure 8; we also show for comparison the stellar masses of SCUBA sources in SHADES, computed by Dye et al. (2008) using a methodology and photometry almost identical to ours.
Except for 3 outliers (that may well be misidentifications as they all lie in BGS-Deep), the monotonic trend of increasing stellar masses is the result of multiple selection effects; sources at a given redshift are not detected with arbitrarily low, or arbitrarily high stellar masses. As we discuss later in this section, there is an approximately constant relation between and stellar masses in our sample. Low-luminosity sources (with low stellar masses) are excluded at a given redshift because of sensitivity. On the other hand, sources with (and stellar masses) above a certain threshold are excluded from our sample despite the well-documented strongly evolving FIR luminosity function (E09; Dye et al., 2010a; Eales et al., 2010); our present study simply does not go deep enough to start detecting the bulk of high- (and higher volume density) -corrected sources. In particular, sources with M☉, which are present in the SHADES sample, are absent from ours. Indeed, these very massive sources are not detected among 24 m-selected samples, down to a flux density level of 20 Jy (GOODS survey, see e.g. Le Floc’h et al., 2005; Pérez-González et al., 2005; Caputi et al., 2006; Elbaz et al., 2007; Santini et al., 2009)121212All the authors cited above adopt a Salpeter (1955) IMF. Caputi et al. (2006), Santini et al. (2009), Dye et al. (2008, 2010b) estimate the stellar masses by means of an optical–to–NIR SED fit of each galaxy at the determined redshift. Le Floc’h et al. (2005) and Pérez-González et al. (2005) simply convert, respectively, - and -band luminosities into stellar masses. Finally, Elbaz et al. (2007) compute stellar masses by modeling the stellar populations of each galaxy using stellar absorption-line indices.. The 24 m catalog used by D09 to find counterparts to the BLAST sources goes down to the same depth, therefore we are only left with the radio catalogs. It is indeed possible that our analysis is missing very massive galaxies that, though having a radio ID, do not have an estimate of stellar mass because measurements are not available in a minimum of 5 optical/NIR bands. An accurate account of the selection effects at work for M☉, which is beyond the scope of this work, would not invalidate the results of the rest of this paper.
Our subsample is composed of relatively massive objects, with a significant fraction of sources (45%) with stellar masses greater than M☉. This fraction soars to 84% in the SHADES survey, whereas the majority of sources detected at 24 m in deep surveys of the CDFS (down to a flux density level of 20 Jy) have M☉ (e.g. Le Floc’h et al., 2005; Pérez-González et al., 2005; Caputi et al., 2006; Elbaz et al., 2007; Santini et al., 2009). However, a direct comparison of the detection rates of massive galaxies among these surveys is very difficult because of the dissimilar comoving volumes probed; in fact, BLAST samples a volume roughly 14 (57) times larger than SHADES (GOODS)131313Based on the following redshift depth and sky area covered by, respectively, the GOODS survey, the SHADES survey and the present BLAST study: arcmin2 out to ; arcmin2 out to ; and deg2 out to .. Furthermore, it would be necessary to quantify the numerous selection effects and the different shape of the stellar mass function at the wavelengths in question.
Nevertheless, BLAST observes a significant number of large, massive and actively star-forming galaxies (typically spirals, see Section 7), which qualitatively appear to link the 24 m and SCUBA populations at . With the deep 24 m GOODS survey, other authors seem to be already detecting this linking population (in particular Caputi et al. 2006 and Elbaz et al. 2007), but their most massive sources at all have long ( Gyr) star-formation time scales (defined as the ratio of already assembled stellar mass over the recent SFR, see later in this section), indicating prolonged star formation histories. On the contrary, about 60% of our galaxies in the same – range have star-formation time scales shorter than 4 Gyr, consistent with the findings that submm-selected M☉ systems at form their stellar mass predominantly at late and at early times, but less so when the galaxies are middle-aged (Dye et al., 2010b, 2008). These figures indicate that the moderately massive population detected at by BLAST is more actively forming stars than the equally massive 24 m-selected galaxies in the same redshift range. One might wonder whether this observation arises just as a consequence of a selection effect in the shallower BLAST sample; although our data do not allow us to investigate the stellar masses of fainter BLAST galaxies, a thorough examination of the distribution at in the GOODS survey (e.g. Fig. 7 of Caputi et al., 2006) does not suggest that the exclusion of the fainter 24 m sources (below e.g. 83 Jy, the 80% completeness limit in the CDFS) would dramatically alter the proportions of galaxies with stellar mass above and below M☉. It is certainly possible that a cut at a brighter 24 m flux density would bias high the detection rate of massive galaxies; however, the massive BLAST galaxies at have a median SFR of M☉ yr-1 that equals the maximum SFR among the likewise massive and aged galaxies in GOODS. This would still be true if the 24 m sample were shallower.
Moreover, Figure 8 exhibits, in the range , a substantial overlap between BLAST and SCUBA sources. Therefore, assuming that the BGS is a representative field, our data suggest that the BLAST galaxies seem to connect the 24 m and SCUBA populations, in terms of both stellar mass and star-formation activity. Figures 9 and 10 further corroborate this conclusion. It is worth reminding the reader that the estimates are based on the optical/NIR fluxes of BLAST IDs and do not employ any BLAST-specific photometric data.
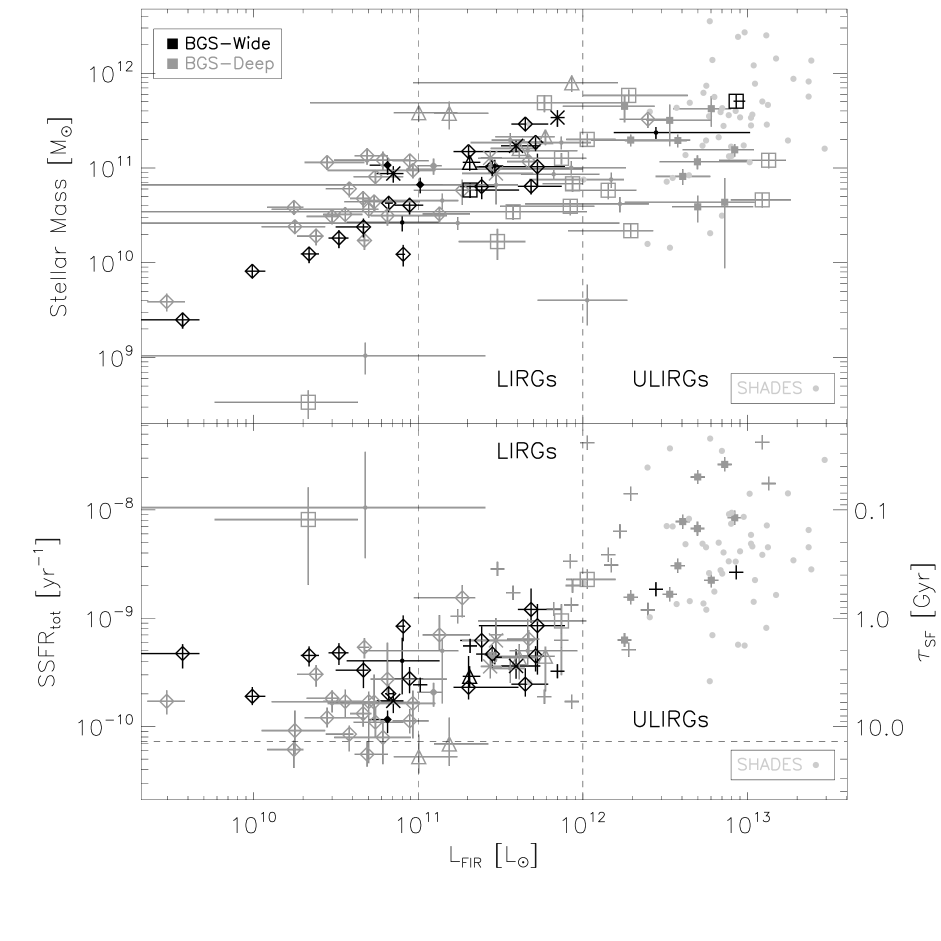
Figure 9 plots stellar masses (top panel) and SSFRtot (bottom panel) vs. for the subset of 55 sources at that have an estimate of both these quantities. There are 37 additional sources in our catalog with L☉ and stellar mass estimates, but no reliable SFRNUV. These are included in Figure 9, because in this case SFR SFRdust (see Section 5). SHADES sources are also shown in this figure. Dye (2010) estimates their FIR luminosities using a two-component SED fit from Dunne & Eales (2001) that has cold/hot ratio of 186, with K and K. SFRs are estimated using Equation 1 and corrected by (). Finally, star-formation time scales, defined as , are shown as secondary -axis.
BLAST IDs selected in BGS-Wide show a positive correlation between their stellar masses and , but there is no strong evidence for a correlation between SSFRtot and FIR luminosities. Although BLAST IDs selected in BGS-Deep appear to have different trends, one should be cautious as the they are, in general, less reliable than the IDs in BGS-Wide. However, BGS-Deep sources can be used to study bulk properties under appropriate caveats. The emerging picture appears to confirm Figure 8, in which there is a non-negligible overlap between the BLAST and SCUBA populations in the range . In particular, the high luminosity tail of the BLAST sample appears to encroach on the SHADES sources in terms of both and , bridging the gap with the lower-redshift Universe populated by 24 m sources and by run-of-the-mill star-forming BLAST galaxies, with spanning the interval 1–10 Gyr. A considerable overlap between fainter BLAST sources and 870 m-selected galaxies has already been established by Dunlop et al. (2010) and Chapin et al. (2010), but it is important to have confirmed an additional, less direct, connection with our shallower BLAST sample, by means of a comparable analysis to that of SHADES.
We have investigated if a temporal connection between the two populations is allowed by the data, in a scenario where the BLAST sources are SCUBA sources fading at the end of their late star-formation burst (Borys et al., 2005; Dye et al., 2008). However, Dye et al. (2010b) seem to rule out this possibility, because the higher-, more massive BLAST IDs are observed during a star-formation burst lasting too briefly in redshift to allow this connection. This disconnection is consistent with the phenomenon of downsizing observed in optically-selected samples of galaxies (e.g. Heavens et al., 2004).
The approximately flat trend between SSFRtot with FIR luminosity of Figure 9 evidenced by the BLAST IDs selected in BGS-Wide is consistent with Serjeant et al. (2008). The inclusion of BGS-Deep sources at high FIR luminosities seems to suggest a different, mild trend of increasing SSFRtot, also reported by Santini et al. (2009) and Rodighiero et al. (2010). The data available to us do not manifest enough evidence to support either scenario. Larger samples now accessible with Herschel will shed more light on the evolution of the specific star-formation rate.
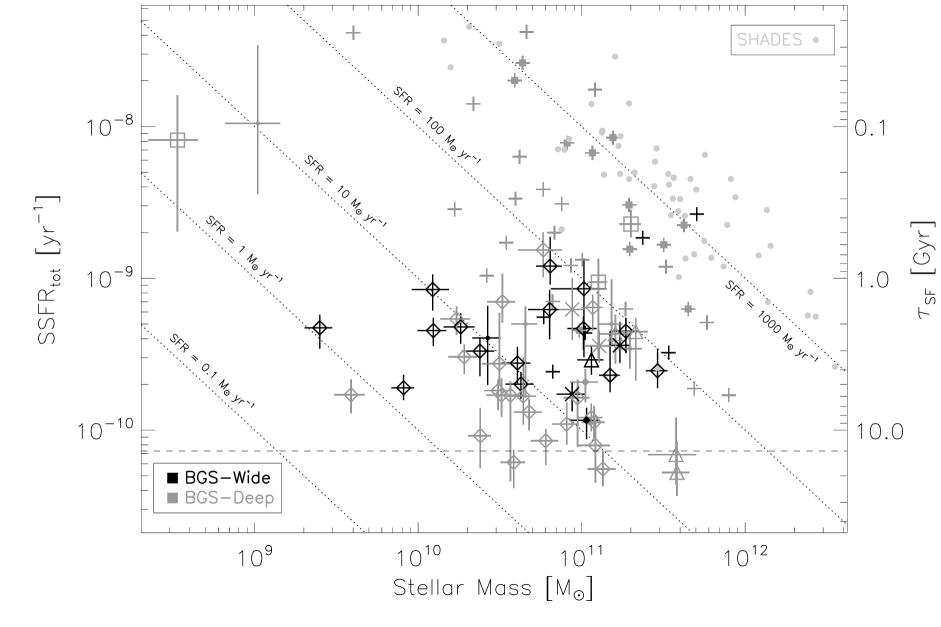
In Figure 10, we plot SSFRtot vs. stellar mass, for BLAST and SHADES sources. The dotted isolines correspond to constant SFRs, under the assumption that is the galaxy’s total stellar mass. We do not find any clear correlation between specific total star-formation rate and stellar mass, which is not surprising as we are sampling a population of young, active, star-forming galaxies (see also Santini et al., 2009). Expectedly, the bulk of SHADES sources occupies a well-defined region of the plane, around the isoline of SFR M☉ yr-1, whereas practically all the BLAST counterparts at lie below the isoline of SFR M☉ yr-1. The gap is again filled by the BLAST IDs at higher redshift.
We can compare our results in Figure 10 with Buat et al. (2008), who derived mean relationships between observed SSFR and stellar mass at and , and confronted these with models based on a progressive infall of gas into the galactic disk, starting at high . Both their data and models exhibit a flat distribution of SSFR for galaxies with masses between and M☉. Our subset of star forming galaxies shares a similar behavior, as well as the dynamic ranges. On the other hand, we can also compare the high- tail of the BLAST IDs with the sample of Rodighiero et al. (2010): although the scatter is quite large in both subsets, we observe the same negative trend of SSFR with , again consistent with downsizing.
The in-depth analysis of the bright BLAST counterparts reveals a population with an intrinsic dichotomy in terms of star-formation rate, stellar mass and morphology. The bulk of BLAST counterparts at appear to be run-of-the-mill star-forming spiral galaxies, with intermediate stellar masses (median M☉) and approximately constant specific star-formation rates ( in the range 1–10 Gyr); in addition, they form stars more actively than the equally massive and aged 24 m sources. On the other hand, the high- BLAST counterparts significantly overlap with the SCUBA population, and the observed trends of SSFR, albeit inconclusive, suggest stronger evolution and downsizing. In conclusion, our study suggests that the BLAST galaxies may act as linking population between the star-forming 24 m sources and the more extreme SCUBA starbursts.
9 Concluding remarks
We have carried out a panchromatic study of individual bright BLAST galaxies identified at other wavelengths, extending the analysis of previous BLAST papers. Our basic results are as follows.
-
1.
The flux densities of BLAST sources are boosted due to a combination of Eddington bias, source confusion and blending. We have developed a Monte Carlo method to quantify these biases, both in confusion-limited maps and in maps dominated by instrumental noise. The boosting effects are more pronounced in the confusion-limited regime, and become more important as the wavelength increases. In addition, flux densities are heavily correlated among the BLAST bands, again more prominently in BGS-Deep. We account for all these effects coherently while calculating the FIR luminosities of BLAST galaxies. We have also shown how crucial the BLAST/SPIRE photometry is to estimate without bias the FIR luminosity of a galaxy, especially at high redshift.
-
2.
We have measured that star formation is predominantly obscured at L☉, . On the other hand, unobscured star formation is important at L☉, and FIR-only evaluations of SFR would lead to underestimates up to a factor of 2. This is probably a direct consequence of the well documented stronger evolution of the FIR luminosity density with respect to the optical-UV one.
-
3.
We have compared, in terms of – parameter space, the BLAST counterparts to the IRAS/FIR-selected sample of local galaxies, to the 24 m-selected sample observed by Spitzer, and to the SCUBA 850 m-selected sample. The overlap with the local IRAS sample is minimal and this conclusion should not be belittled by the extent of local volume surveyed by BLAST. Similarly, our sample lacks the abundance of most luminous IR galaxies detected in the SHADES survey, but the high-, high- tail of the BLAST counterparts seems to overlap with the SCUBA population. The 24 m-selected sample resembles the most the bulk of BLAST IDs in terms of and redshift distribution.
-
4.
We have assessed that 15% of the galaxies in our sample show strong indication of an active nucleus and an additional 6% have weaker yet significant evidence. In particular, these are predominantly type-1 AGN, i.e. unobscured Seyfert galaxies and quasars. The AGN fraction and the SFRs inferred for these objects are comparable to recent observations at similar wavelengths and point to a scenario in which the submillimeter emission detected by BLAST is mainly due to star formation ongoing in the host galaxy, rather than to emission from a dusty torus obscuring the inner regions of the active nucleus.
-
5.
We have computed stellar masses for a subset of 92 BLAST counterparts. These appear to be relatively massive objects, with median mass of M☉, and inter-quartile range of – M☉. In particular, a significant fraction of them fill the region of M☉ at that is practically vacant in the SCUBA surveys, and sparsely populated by 24 m-selected samples. Although the dissimilar volumes sampled by these surveys discourage a direct comparison of the detection rates of massive galaxies, our study suggest that the BLAST counterparts seem to link the 24 m and SCUBA populations, in terms of both stellar mass and star-formation activity.
-
6.
We have highlighted a dichotomy in the BLAST population in terms of star-formation rate, stellar mass and morphology. The bulk of BLAST counterparts at are run-of-the-mill star-forming galaxies, typically spiral in shape, with intermediate stellar masses and nearly constant specific star-formation rates. On the other hand, the higher redshift BLAST counterparts significantly overlap with the SCUBA population, and the observed trends of SSFR, albeit inconclusive, suggest stronger evolution. Other BLAST studies have already described the significant overlap existing between fainter BLAST sources and 870 m-selected galaxies, but here we have established an additional link with a shallower BLAST sample, via an analysis equivalent to that of SHADES.
-
7.
We rule out a temporal connection between the BLAST and SCUBA populations, in a scenario where BLAST sources would correspond to SCUBA galaxies whose burst of star formation is ceasing. This disconnection is consistent with the downsizing observed in optical samples.
The findings described in this paper represent a taste of what should be possible with a significantly larger sample of sources. The increased sensitivity and resolution of the Herschel Space Observatory, which recently started operation, will soon provide vastly increased numbers of sources. This will enable significantly reduced uncertainties and therefore much improved constraints on models of galaxy evolution and formation. Nevertheless, the BLAST data have provided a very valuable benchmark for the Herschel data and the various analyses that will emerge for some time to come. Furthermore, the results in this paper probably will not immediately become obsolete, as even the much more sensitive SPIRE surveys will have to face the lack of deeper ancillary data, especially in the optical/NIR and in the radio. Identifying the precise location of the submm sources will require either deep and very wide-area VLA data, or a combination of MIPS 24 m and PACS, or ultimately ALMA. Finally, in order to study the rest-frame optical/NIR of the submm galaxies in much more detail than BLAST or SCUBA, future studies will really require instruments like WFC3 or JWST.
Appendix A Postage stamps
Postage stamp images for a selection of low redshift BLAST IDs. The images are all in size. Every row shows a BLAST source, imaged at three different bands: left, GALEX NUV filter (centered at 2315 Å); center, RGB combination of the filters from the SWIRE optical survey; right, 3.6 m IRAC band. The complete set of full-color cut-outs can be found at http://blastexperiment.info/results_images/moncelsi/
![[Uncaptioned image]](/html/1008.1542/assets/x12.png)
![[Uncaptioned image]](/html/1008.1542/assets/x13.png)
![[Uncaptioned image]](/html/1008.1542/assets/x14.png)
![[Uncaptioned image]](/html/1008.1542/assets/x15.png)
Appendix B Data tables
| ID | BLAST name | deep | flag spec- | provenance | H EWrf | [NII]/H | AGN flag | Q flag | morphology | |||
|---|---|---|---|---|---|---|---|---|---|---|---|---|
| 1 | BLAST J032921280803 | 52.33792 | 28.13348 | 0 | 0.03791 | 1 | AAO | 11.4 1.0 | 0.64 | AGN? | … | S |
| 2 | BLAST J032956284631 | 52.48567 | 28.77572 | 0 | 0.037 | 1 | AAO | 4.6 5.2 | 0.56 | … | … | IS |
| 3 | BLAST J032741282325 | 51.921225 | 28.38895 | 0 | 0.06067 | 1 | AAO | 15.8 3.0 | 0.74 | AGN | … | S |
| 4 | BLAST J033235275530 | 53.146165 | 27.92571 | 1 | 0.03764 | 1 | AAO | 7.1 2.0 | 0.60 | … | … | S |
| 5 | BLAST J033131272842 | 52.880575 | 27.479735 | 1 | 0.06668 | 1 | AAO | 13.4 0.9 | 1.33 | AGN | … | S |
| 6 | BLAST J033229274415 | 53.12448 | 27.740165 | 1 | 0.07593 | 1 | AAO | 38.4 1.6 | 0.43 | … | … | S |
| 7 | BLAST J033250273420 | 53.20818 | 27.57581 | 1 | 0.25126 | 1 | AAO | 31.3 3.6 | 0.44 | … | … | IS? |
| 8 | BLAST J033548274920 | 53.954945 | 27.821905 | 0 | 0.16752 | 1 | AAO | 13.1 3.3 | 1.18 | AGN | … | … |
| 9 | BLAST J032916273919 | 52.31905 | 27.65615 | 0 | 0.01474 | 1 | AAO | 82.9 1.6 | 0.26 | … | … | S |
| 10 | BLAST J032850263654 | 52.20959 | 26.61418 | 0 | 0.0431 | 1 | NEDaaColless et al. (2003) | … | … | … | … | … |
| 11 | BLAST J033424274527 | 53.60242 | 27.75861 | 1 | 0.12451 | 1 | AAO | 13.5 3.5 | 0.45 | … | … | S |
| 12 | BLAST J032907284121 | 52.28185 | 28.6882 | 0 | 0.06694 | 1 | AAO | 7.6 3.0 | 0.58 | … | … | S |
| 13 | BLAST J032950285058 | 52.456265 | 28.849455 | 0 | 0.07611 | 1 | AAO | 9.4 4.6 | 0.57 | … | … | S |
| 15 | BLAST J033341280742 | 53.423975 | 28.127015 | 1 | 0.34925 | 1 | AAO | … | … | … | … | I? |
| 16 | BLAST J033059280955 | 52.748 | 28.166875 | 1 | 0.07762 | 1 | AAO | 35.8 1.4 | 0.38 | … | … | S |
| 17 | BLAST J033249275838 | 53.20553 | 27.97915 | 1 | 1.256 | 0 | EAZY | … | … | … | Q | C |
| 18 | BLAST J033123275707 | 52.847915 | 27.949675 | 1 | … | … | … | … | … | … | Q | C |
| 19 | BLAST J033417273927 | 53.57377 | 27.65889 | 1 | 0.14583 | 1 | AAO | 19.7 2.4 | 0.53 | … | … | … |
| 20 | BLAST J033340273811 | 53.422255 | 27.63582 | 1 | 0.10148 | 1 | AAO | 8.1 2.5 | 1.02 | AGN | … | … |
| 21 | BLAST J033152281235 | 52.96558 | 28.20779 | 1 | 0.18089 | 1 | AAO | 6.9 4.2 | 0.75 | AGN | … | S |
| 22 | BLAST J033152273929 | 52.967105 | 27.6574 | 1 | 1.96 | 0 | EAZY | … | … | AGN (NED) | Q | C |
| 23 | BLAST J033258274324 | 53.24671 | 27.72366 | 1 | 0.91 | 0 | EAZY | … | … | … | … | C |
| 24 | BLAST J033129275720 | 52.87454 | 27.956275 | 1 | … | … | … | … | … | … | Q? | C |
| 26 | BLAST J033246275743 | 53.191665 | 27.962605 | 1 | 0.10378 | 1 | AAO | 17.3 3.3 | 0.37 | … | … | S |
| 27 | BLAST J032956281843 | 52.48787 | 28.31118 | 0 | 0.05952 | 1 | AAO | 23.6 2.5 | 0.41 | … | … | S |
| 28 | BLAST J033317280901 | 53.32528 | 28.15234 | 1 | … | … | … | … | … | … | Q? | C |
| 29 | BLAST J032822283205 | 52.09467 | 28.53271 | 0 | 0.07023 | 1 | AAO | 15.6 2.6 | 0.43 | … | … | S? |
| 30 | BLAST J033111275820 | 52.79799 | 27.97185 | 1 | … | … | … | … | … | … | … | … |
| 31 | BLAST J033414274217 | 53.56036 | 27.706065 | 1 | 0.1027 | 1 | AAO | 26.8 2.0 | 0.43 | … | … | … |
| 32 | BLAST J033332272900 | 53.38416 | 27.48815 | 1 | 0.14466 | 1 | AAO | 31.6 2.0 | 0.49 | … | … | … |
| 34 | BLAST J033149274335 | 52.95715 | 27.724 | 1 | 0.62046 | 1 | AAO | … | … | … | … | … |
| 35 | BLAST J033217275905 | 53.071035 | 27.97958 | 1 | 1.991 | 0 | EAZY | … | … | … | … | C |
| 36 | BLAST J033317274606 | 53.324045 | 27.768385 | 1 | 2.303 | 0 | EAZY | … | … | … | … | C |
| 37 | BLAST J032842264107 | 52.17858 | 26.6829 | 0 | … | … | … | … | … | … | … | … |
| 38 | BLAST J033216280350 | 53.066375 | 28.06329 | 1 | 0.51928 | 1 | AAO | … | … | … | … | E? |
| 39 | BLAST J033106274508 | 52.77753 | 27.75455 | 1 | … | … | … | … | … | … | … | … |
| 40 | BLAST J032821292636 | 52.08769 | 29.44216 | 0 | 0.0897 | 1 | AAO | … | … | … | … | S |
| 41 | BLAST J033430271915 | 53.62789 | 27.320845 | 0 | 0.10332 | 1 | AAO | 21.7 2.1 | 0.49 | … | … | … |
| 42 | BLAST J033145274635 | 52.939065 | 27.777815 | 1 | … | … | … | … | … | … | … | C |
| 43 | BLAST J033308274809 | 53.29047 | 27.800445 | 1 | 0.18081 | 1 | AAO | 33.4 4.6 | 0.32 | … | … | S |
| 44 | BLAST J033131273235 | 52.88022 | 27.544245 | 1 | … | … | … | … | … | … | Q? | C |
| 45 | BLAST J033150281126 | 52.96289 | 28.18947 | 1 | 0.21316 | 1 | AAO | 7.3 4.6 | 0.56 | … | … | S |
| 46 | BLAST J033110265744 | 52.7943 | 26.96136 | 0 | … | … | … | … | … | … | … | S |
| 47 | BLAST J033111275605 | 52.79519 | 27.93269 | 1 | … | … | … | … | … | … | … | C?/S? |
| 48 | BLAST J033054275457 | 52.73177 | 27.9168 | 1 | … | … | … | … | … | … | … | … |
| 49 | BLAST J033032273527 | 52.63694 | 27.595065 | 1 | 0.10671 | 1 | AAO | 20.4 2.8 | 0.43 | … | … | S |
| 50 | BLAST J032904284759 | 52.268575 | 28.797885 | 0 | 0.2892 | 1 | AAO | … | … | AGN (NED) | … | IS?/S? |
| 51 | BLAST J033046275515 | 52.69288 | 27.921775 | 1 | 0.52449 | 1 | AAO | … | … | … | Q | C |
| 52 | BLAST J033214281133 | 53.06131 | 28.19199 | 1 | 0.528 | 0 | RR | … | … | … | … | C |
| 53 | BLAST J033419265319 | 53.5817 | 26.88803 | 0 | … | … | … | … | … | … | … | S |
| 54 | BLAST J033151274428 | 52.96448 | 27.74109 | 1 | 1.016 | 0 | EAZY | … | … | … | … | C |
| 55 | BLAST J033129275557 | 52.87458 | 27.93354 | 1 | 0.678 | 1 | AAO | … | … | … | … | BC |
| 56 | BLAST J033034274325 | 52.6438 | 27.72466 | 1 | … | … | … | … | … | … | … | … |
| 57 | BLAST J033432275140 | 53.63655 | 27.86255 | 1 | … | … | … | … | … | … | … | IS? |
| 58 | BLAST J033110280011 | 52.79956 | 27.99783 | 1 | … | … | … | … | … | … | … | … |
| 60 | BLAST J033421275033 | 53.59264 | 27.8454 | 1 | … | … | … | … | … | … | … | … |
| 61 | BLAST J033148280424 | 52.952355 | 28.076205 | 1 | … | … | … | … | … | … | … | … |
| 62 | BLAST J033119275822 | 52.83376 | 27.97194 | 1 | 0.898 | 0 | COMBO17 | … | … | … | … | BC |
| 63 | BLAST J033316275045 | 53.318815 | 27.844285 | 1 | 0.0874 | 1 | AAO | 14.9 3.1 | 0.51 | … | … | S |
| 64 | BLAST J033240280310 | 53.16542 | 28.05305 | 1 | … | … | … | … | … | … | … | … |
| 65 | BLAST J033018275500 | 52.57593 | 27.91682 | 1 | 0.07946 | 1 | AAO | 9.9 2.3 | 0.42 | … | … | S |
| 66 | BLAST J033205274648 | 53.020375 | 27.779815 | 1 | 2.019 | 0 | EAZY | … | … | … | Q? | C |
| 68 | BLAST J033146275732 | 52.944085 | 27.9597 | 1 | 0.3645 | 1 | AAO | … | … | … | … | S |
| 69 | BLAST J033153281036 | 52.97797 | 28.1766 | 1 | 0.21472 | 1 | AAO | 34.6 3.9 | 0.40 | … | … | S |
| 70 | BLAST J033111284835 | 52.79579 | 28.80925 | 0 | 0.10895 | 1 | AAO | 1.5 2.5 | 1.60 | AGN | … | S |
| 71 | BLAST J033140272937 | 52.91928 | 27.493975 | 1 | 0.06728 | 1 | AAO | 5.5 1.9 | 0.60 | AGN (broad H) | … | S |
| 72 | BLAST J033120273344 | 52.834745 | 27.56287 | 1 | 0.19504 | 1 | AAO | 15.1 4.8 | 0.50 | … | … | S |
| 73 | BLAST J033158273519 | 52.99226 | 27.58947 | 1 | 2.034 | 0 | EAZY | … | … | … | Q | C |
| 75 | BLAST J033115273905 | 52.810675 | 27.651895 | 1 | 0.31183 | 1 | AAO | 7.6 4.3 | 0.44 | … | … | E |
| 76 | BLAST J033328273949 | 53.37102 | 27.66589 | 1 | 0.808 | 0 | EAZY | … | … | … | … | … |
| 77 | BLAST J033218273138 | 53.07989 | 27.52747 | 1 | 0.22716 | 1 | AAO | 16.4 3.8 | 0.41 | … | … | S? |
| 78 | BLAST J033401274759 | 53.50673 | 27.79859 | 1 | … | … | … | … | … | … | … | … |
| 80 | BLAST J033156284241 | 52.99144 | 28.70857 | 0 | … | … | … | … | … | AGN (NED) | Q? | C |
| 83 | BLAST J033633284223 | 54.14349 | 28.70855 | 0 | 0.19754 | 1 | AAO | 26.1 3.9 | 0.41 | … | … | S |
| 84 | BLAST J033318281436 | 53.329275 | 28.242505 | 1 | 0.10287 | 1 | AAO | 12.6 2.7 | 0.48 | … | … | S |
| 85 | BLAST J033153274950 | 52.97289 | 27.83057 | 1 | 0.8409 | 1 | AAO | … | … | … | … | C? |
| 86 | BLAST J033447283013 | 53.700025 | 28.502715 | 0 | 0.04139 | 1 | AAO | 28.0 2.1 | 0.47 | … | … | S |
| 87 | BLAST J032746265801 | 51.94289 | 26.96452 | 0 | 0.043304 | 1 | NEDaaColless et al. (2003) | … | … | … | … | S? |
| 88 | BLAST J033636284115 | 54.15564 | 28.6873 | 0 | 0.06828 | 1 | AAO | 36.3 2.4 | 0.43 | … | … | S |
| 90 | BLAST J032818274311 | 52.07546 | 27.719205 | 0 | 0.24845 | 1 | AAO | 4.8 9.0 | 1.38 | AGN | … | S? |
| 92 | BLAST J033241280557 | 53.1742 | 28.09777 | 1 | 0.29663 | 1 | AAO | 25.5 16.1 | 0.45 | … | … | S |
| 93 | BLAST J033408273514 | 53.5334 | 27.59049 | 1 | … | … | … | … | … | … | … | … |
| 94 | BLAST J033351274357 | 53.46998 | 27.72938 | 1 | 0.22496 | 1 | AAO | 14.7 3.2 | … | … | … | … |
| 95 | BLAST J033343270918 | 53.4297 | 27.15331 | 0 | 0.0685 | 1 | AAO | 4.0 2.5 | 0.65 | AGN? | … | S |
| 96 | BLAST J033336272854 | 53.40486 | 27.48539 | 1 | 0.14489 | 1 | AAO | 14.9 9.4 | 0.49 | … | … | S |
| 97 | BLAST J033317280220 | 53.317655 | 28.03985 | 1 | 0.34897 | 1 | AAO | … | … | … | … | S? |
| 98 | BLAST J033214273053 | 53.0595 | 27.51728 | 1 | … | … | … | … | … | … | … | … |
| 99 | BLAST J033247270716 | 53.19616 | 27.11917 | 0 | … | … | … | … | … | … | … | … |
| 100 | BLAST J033203281015 | 53.01636 | 28.17114 | 1 | 1.432 | 0 | RR | … | … | … | Q | C |
| 101 | BLAST J033127281009 | 52.86677 | 28.16924 | 1 | … | … | … | … | … | … | Q? | C |
| 102 | BLAST J033124275207 | 52.85381 | 27.868845 | 1 | 1.182 | 0 | RR | … | … | AGN (NED) | Q | C |
| 103 | BLAST J032707270516 | 51.78465 | 27.09038 | 0 | … | … | … | … | … | … | … | … |
| 106 | BLAST J032704280713 | 51.76851 | 28.12049 | 0 | 0.089978 | 1 | NEDaaColless et al. (2003) | … | … | … | … | S |
| 109 | BLAST J033408275415 | 53.53403 | 27.90217 | 1 | … | … | … | … | … | … | … | S |
| 110 | BLAST J033217275054 | 53.074425 | 27.849725 | 1 | 0.12275 | 1 | AAO | 7.9 6.5 | 0.55 | … | … | S |
| 112 | BLAST J033241273818 | 53.17499 | 27.63874 | 1 | 0.832 | 0 | COMBO17 | … | … | … | … | … |
| 113 | BLAST J033347273848 | 53.4544 | 27.64381 | 1 | … | … | … | … | … | AGN (NED) | … | … |
| 115 | BLAST J033128280508 | 52.86134 | 28.08199 | 1 | … | … | … | … | … | … | … | S |
| 118 | BLAST J033238273151 | 53.158495 | 27.53339 | 1 | … | … | … | … | … | … | … | … |
| 119 | BLAST J033606272311 | 54.0313 | 27.38652 | 0 | … | … | … | … | … | … | Q | … |
| 120 | BLAST J032703282950 | 51.76878 | 28.49448 | 0 | … | … | … | … | … | … | … | … |
| 122 | BLAST J033025275014 | 52.60716 | 27.83824 | 1 | 0.12152 | 1 | AAO | 35.4 2.7 | 0.35 | … | … | S |
| 123 | BLAST J033112265716 | 52.8017 | 26.95459 | 0 | … | … | … | … | … | … | … | … |
| 125 | BLAST J033229273505 | 53.12247 | 27.58556 | 1 | 0.52 | 0 | EAZY | … | … | … | … | C |
| 126 | BLAST J033211283251 | 53.05272 | 28.54705 | 0 | 0.69385 | 1 | AAO | … | … | … | … | S? |
| 127 | BLAST J033224291707 | 53.10425 | 29.28513 | 0 | 0.132 | 0 | RR | … | … | … | … | IS |
| 128 | BLAST J033100275310 | 52.75566 | 27.8887 | 1 | 0.959 | 0 | RR | … | … | … | … | RC |
| 129 | BLAST J033225284148 | 53.11398 | 28.6995 | 0 | 0.17159 | 1 | AAO | 30.7 3.7 | 0.47 | … | … | S |
| 130 | BLAST J033505274027 | 53.76858 | 27.6737 | 0 | 0.472 | 0 | RR | … | … | … | … | C |
| 131 | BLAST J033200273604 | 53.00352 | 27.59926 | 1 | 0.767 | 0 | EAZY | … | … | AGN (NED) | Q? | C |
| 132 | BLAST J033225273818 | 53.104395 | 27.63964 | 1 | 0.772 | 0 | EAZY | … | … | … | … | RC |
| 134 | BLAST J032813270453 | 52.05436 | 27.08062 | 0 | 0.037356 | 1 | NEDbbRatcliffe et al. (1998) | … | … | … | … | S |
| 135 | BLAST J033134282344 | 52.89175 | 28.40077 | 0 | 0.27897 | 1 | AAO | 68.1 4.6 | 0.38 | … | … | S |
| 136 | BLAST J033228273547 | 53.118995 | 27.59364 | 1 | 0.41 | 0 | EAZY | … | … | AGN (NED) | Q? | E? |
| 137 | BLAST J032822280809 | 52.08978 | 28.136615 | 0 | 0.21831 | 1 | AAO | 50.4 3.7 | 0.44 | … | … | S |
| 138 | BLAST J033348275015 | 53.45399 | 27.83728 | 1 | … | … | … | … | … | … | … | … |
| 139 | BLAST J033626270939 | 54.10876 | 27.15997 | 0 | 0.24401 | 1 | AAO | 47.6 5.2 | 0.66 | AGN? | … | … |
| 140 | BLAST J032644285106 | 51.69027 | 28.84995 | 0 | … | … | … | … | … | … | … | … |
| 143 | BLAST J033148280958 | 52.950265 | 28.169025 | 1 | 0.3809 | 1 | AAO | … | … | … | … | E? |
| 145 | BLAST J033211275859 | 53.04655 | 27.98295 | 1 | 0.165 | 0 | EAZY | … | … | … | … | S |
| 146 | BLAST J033000275347 | 52.50169 | 27.89651 | 1 | 0.143 | 0 | RR | … | … | … | … | S |
| 147 | BLAST J033110274302 | 52.79279 | 27.71546 | 1 | … | … | … | … | … | … | … | … |
| 148 | BLAST J033104275001 | 52.76799 | 27.83581 | 1 | … | … | … | … | … | … | … | … |
| 149 | BLAST J033612281046 | 54.05851 | 28.18294 | 0 | 0.1967 | 1 | AAO | 14.1 8.1 | 0.81 | AGN | … | S? |
| 152 | BLAST J033648271936 | 54.20443 | 27.3274 | 0 | 0.1458 | 1 | AAO | 4.2 10.8 | 1.09 | AGN | … | S? |
| 153 | BLAST J033116263428 | 52.81561 | 26.57759 | 0 | … | … | … | … | … | … | … | … |
| 154 | BLAST J033541285524 | 53.9221 | 28.92295 | 0 | 0.12255 | 1 | AAO | 20.5 5.3 | 0.46 | … | … | S |
| 155 | BLAST J032929284222 | 52.37317 | 28.705265 | 0 | 0.07029 | 1 | AAO | 23.8 2.5 | 0.38 | … | … | S |
| 157 | BLAST J033609280942 | 54.03839 | 28.16214 | 0 | 0.31589 | 1 | AAO | 21.0 6.5 | 0.62 | AGN? | … | S |
| 158 | BLAST J033307281412 | 53.280815 | 28.2363 | 1 | 0.038 | 0 | RR | … | … | … | … | S |
| 160 | BLAST J032843274414 | 52.18251 | 27.73569 | 0 | … | … | … | … | … | … | … | S? |
| 162 | BLAST J033154274406 | 52.979145 | 27.73628 | 1 | 0.7584 | 1 | AAO | … | … | … | … | BC? |
| 163 | BLAST J033114273412 | 52.80916 | 27.570105 | 1 | 0.53355 | 1 | AAO | … | … | … | … | IS? |
| 165 | BLAST J033605293357 | 54.02465 | 29.5702 | 0 | 0.45211 | 0 | RR | … | … | … | … | S |
| 166 | BLAST J033053293431 | 52.72938 | 29.57429 | 0 | 0.200653 | 1 | AAO | … | … | … | … | E? |
| 167 | BLAST J033247274221 | 53.199495 | 27.709135 | 1 | 0.98054 | 1 | AAO | … | … | AGN (NED) | Q | C |
| 168 | BLAST J033110275303 | 52.79792 | 27.88302 | 1 | 0.2652 | 1 | AAO | … | … | … | … | S |
| 169 | BLAST J033235280626 | 53.14828 | 28.10735 | 1 | 1.547 | 0 | RR | … | … | … | … | C |
| 170 | BLAST J033039275805 | 52.66032 | 27.96378 | 1 | 0.337 | 0 | RR | … | … | … | … | … |
| 173 | BLAST J033132281257 | 52.88347 | 28.21739 | 1 | … | … | … | … | … | … | … | … |
| 174 | BLAST J033229273948 | 53.12323 | 27.66337 | 1 | … | … | … | … | … | … | … | … |
| 175 | BLAST J033619272415 | 54.08544 | 27.40627 | 0 | … | … | … | … | … | … | … | … |
| 178 | BLAST J033600265102 | 54.00227 | 26.8485 | 0 | … | … | … | … | … | … | … | … |
| 179 | BLAST J033259273536 | 53.24711 | 27.59284 | 1 | 0.892 | 0 | EAZY | … | … | … | … | … |
| 180 | BLAST J033304271943 | 53.27217 | 27.33042 | 0 | … | … | … | … | … | … | … | … |
| 183 | BLAST J033245281104 | 53.18489 | 28.18372 | 1 | 0.30017 | 0 | RR | … | … | … | … | S |
| 184 | BLAST J033350273520 | 53.459 | 27.58877 | 1 | … | … | … | … | … | … | … | … |
| 185 | BLAST J033424274514 | 53.60793 | 27.75361 | 1 | … | … | … | … | … | … | … | … |
| 188 | BLAST J033111275546 | 52.795145 | 27.93146 | 1 | 0.28145 | 1 | AAO | 40.7 4.8 | 0.39 | … | … | S |
| 196 | BLAST J033211280514 | 53.05099 | 28.087925 | 1 | … | … | … | … | … | … | … | … |
| 197 | BLAST J033335273244 | 53.39648 | 27.54589 | 1 | … | … | … | … | … | … | … | … |
| 198 | BLAST J033215273930 | 53.06753 | 27.65851 | 1 | 1.32358 | 1 | AAO | … | … | Quasar | Q | C |
| 200 | BLAST J033440275630 | 53.67054 | 27.94207 | 1 | 0.127 | 0 | RR | … | … | … | … | S? |
| 202 | BLAST J032742281911 | 51.9274 | 28.3152 | 0 | … | … | … | … | … | … | … | … |
| 203 | BLAST J033529281053 | 53.875965 | 28.18574 | 0 | … | … | … | … | … | AGN (NED) | Q? | C |
| 204 | BLAST J033336274359 | 53.401885 | 27.731985 | 1 | 1.461 | 0 | EAZY | … | … | AGN (NED) | Q | C |
| 205 | BLAST J032713285101 | 51.80349 | 28.85086 | 0 | … | … | … | … | … | … | … | … |
| 207 | BLAST J033353275555 | 53.47468 | 27.930105 | 1 | 1.93998 | 1 | AAO | … | … | Quasar | Q | C |
| 208 | BLAST J033015273940 | 52.56557 | 27.66277 | 1 | … | … | … | … | … | … | … | … |
| 210 | BLAST J033335274827 | 53.39681 | 27.805595 | 1 | 1.165 | 0 | COMBO17 | … | … | … | … | … |
| 212 | BLAST J033127281027 | 52.86584 | 28.17471 | 1 | 0.986 | 0 | RR | … | … | … | … | S? |
| 213 | BLAST J033402273916 | 53.51502 | 27.656585 | 1 | … | … | … | … | … | … | … | … |
| 218 | BLAST J033141275530 | 52.924145 | 27.927055 | 1 | 1.111 | 0 | EAZY | … | … | … | … | … |
| 219 | BLAST J033150270007 | 52.95915 | 27.00111 | 0 | … | … | … | … | … | … | … | … |
| 220 | BLAST J033440274905 | 53.6662 | 27.81678 | 1 | … | … | … | … | … | … | … | … |
| 221 | BLAST J033211273729 | 53.048555 | 27.62394 | 1 | 1.56472 | 1 | AAO | … | … | Quasar | Q | C |
| 222 | BLAST J032753284023 | 51.9713 | 28.67426 | 0 | 1.128 | 0 | RR | … | … | … | … | RC? |
| 223 | BLAST J033423274409 | 53.59818 | 27.74068 | 1 | … | … | … | … | … | … | … | … |
| 225 | BLAST J033123275233 | 52.84398 | 27.88026 | 1 | … | … | … | … | … | … | … | … |
| 226 | BLAST J033723274021 | 54.34546 | 27.67242 | 0 | 1.80174 | 1 | AAO | … | … | Quasar | Q | C |
| 231 | BLAST J033409275213 | 53.541355 | 27.870135 | 1 | … | … | … | … | … | … | … | … |
| 232 | BLAST J033213272619 | 53.05288 | 27.43903 | 1 | … | … | … | … | … | … | … | … |
| 235 | BLAST J033302275635 | 53.26098 | 27.94549 | 1 | … | … | … | … | … | … | … | … |
| 236 | BLAST J033336275328 | 53.39511 | 27.88722 | 1 | … | … | … | … | … | … | … | … |
| 238 | BLAST J032813285930 | 52.06044 | 28.98913 | 0 | 0.439 | 0 | RR | … | … | … | … | … |
| 239 | BLAST J033120274933 | 52.83408 | 27.82483 | 1 | 0.842 | 0 | COMBO17 | … | … | … | … | BC? |
| 240 | BLAST J033306274415 | 53.27565 | 27.73757 | 1 | 0.879 | 0 | EAZY | … | … | … | … | … |
| 245 | BLAST J032752290904 | 51.96693 | 29.1531 | 0 | 0.337 | 0 | RR | … | … | … | … | E |
| 246 | BLAST J033053275704 | 52.72465 | 27.95224 | 1 | … | … | … | … | … | … | … | … |
| 248 | BLAST J033346271431 | 53.44989 | 27.24417 | 0 | … | … | … | … | … | … | … | S? |
| 250 | BLAST J033138274122 | 52.91475 | 27.68874 | 1 | 2.212 | 0 | EAZY | … | … | … | Q | C |
| 252 | BLAST J033545290948 | 53.9439 | 29.16091 | 0 | 0.28233 | 0 | RR | … | … | … | … | … |
| 253 | BLAST J032726291936 | 51.86079 | 29.32844 | 0 | … | … | … | … | … | … | Q | C |
| 254 | BLAST J033141273107 | 52.91843 | 27.51704 | 1 | … | … | … | … | … | … | … | … |
| 255 | BLAST J033122275130 | 52.840975 | 27.856485 | 1 | 1.337 | 0 | COMBO17 | … | … | … | Q | C |
| 257 | BLAST J032550284919 | 51.46241 | 28.82178 | 0 | … | … | … | … | … | … | … | … |
| 259 | BLAST J033105280634 | 52.77208 | 28.10434 | 1 | 0.16701 | 1 | AAO | 37.5 3.8 | 0.54 | … | … | S |
| 261 | BLAST J033306272831 | 53.27457 | 27.47684 | 1 | … | … | … | … | … | … | Q? | C |
| 262 | BLAST J033242275511 | 53.179985 | 27.920665 | 1 | … | … | … | … | … | … | Q | C |
| 264 | BLAST J033306271435 | 53.27784 | 27.24149 | 0 | … | … | … | … | … | … | … | … |
| 265 | BLAST J033127274430 | 52.86584 | 27.74164 | 1 | 0.216 | 1 | NEDccRavikumar et al. (2007) | … | … | … | … | C? |
| 266 | BLAST J033342275117 | 53.43335 | 27.85256 | 1 | … | … | … | … | … | … | … | … |
| 270 | BLAST J033251273417 | 53.21302 | 27.56991 | 1 | … | … | … | … | … | … | … | … |
| 274 | BLAST J033053275513 | 52.71999 | 27.91641 | 1 | 0.89505 | 1 | AAO | … | … | … | … | E |
| 275 | BLAST J033149280936 | 52.95832 | 28.16156 | 1 | 1.455 | 0 | RR | … | … | … | Q | C |
| 277 | BLAST J033254273308 | 53.2304 | 27.55273 | 1 | … | … | … | … | … | … | … | … |
| 280 | BLAST J033351273306 | 53.46829 | 27.55235 | 1 | … | … | … | … | … | … | … | … |
| 288 | BLAST J033507275242 | 53.78062 | 27.88157 | 0 | … | … | … | … | … | … | … | … |
| 289 | BLAST J033102273948 | 52.75508 | 27.66077 | 1 | 0.24165 | 0 | RR | … | … | … | … | BC? |
| 294 | BLAST J033324273432 | 53.354965 | 27.57337 | 1 | 0.504 | 0 | COMBO17 | … | … | … | … | … |
| 302 | BLAST J033552275511 | 53.97283 | 27.91971 | 0 | 1.884 | 0 | RR | … | … | … | … | … |
| 303 | BLAST J033121275803 | 52.84267 | 27.965485 | 1 | 0.52975 | 1 | AAO | … | … | … | … | E |
| 304 | BLAST J033231280437 | 53.1321 | 28.07667 | 1 | … | … | … | … | … | … | … | … |
| 307 | BLAST J033210270531 | 53.04573 | 27.09132 | 0 | … | … | … | … | … | … | … | … |
| 309 | BLAST J033113273016 | 52.80434 | 27.50111 | 1 | … | … | … | … | … | … | Q | … |
| 311 | BLAST J033017283020 | 52.57364 | 28.50466 | 0 | 2.565 | 0 | RR | … | … | … | … | C? |
| 318 | BLAST J033210280711 | 53.04041 | 28.12135 | 1 | 0.9805 | 1 | AAO | … | … | … | … | … |
| 319 | BLAST J033036273717 | 52.64954 | 27.62388 | 1 | … | … | … | … | … | … | … | … |
| 320 | BLAST J032656291615 | 51.74249 | 29.27044 | 0 | … | … | … | … | … | … | Q | C |
| 322 | BLAST J033321280333 | 53.34598 | 28.05703 | 1 | 1.1365 | 0 | EAZY | … | … | … | … | … |
| 323 | BLAST J033557283540 | 53.98524 | 28.59187 | 0 | 0.4388 | 0 | RR | … | … | … | … | IS? |
| 329 | BLAST J033332281348 | 53.39012 | 28.23444 | 1 | 1.37631 | 1 | AAO | … | … | Quasar | Q | C |
| 332 | BLAST J033038274738 | 52.66361 | 27.79376 | 1 | … | … | … | … | … | … | Q | C |
| 333 | BLAST J033649275932 | 54.20814 | 27.99234 | 0 | 0.698 | 0 | RR | … | … | … | … | … |
| 335 | BLAST J033611290528 | 54.05066 | 29.08868 | 0 | 0.42561 | 0 | RR | … | … | … | … | S |
| 339 | BLAST J033018285124 | 52.57649 | 28.85588 | 0 | 0.47231 | 0 | RR | … | … | … | … | S |
| 341 | BLAST J033445275038 | 53.69046 | 27.84443 | 1 | … | … | … | … | … | … | … | … |
| 342 | BLAST J032745292408 | 51.9383 | 29.39774 | 0 | … | … | … | … | … | … | … | … |
| 343 | BLAST J033430273704 | 53.62629 | 27.61929 | 1 | … | … | … | … | … | … | … | … |
| 344 | BLAST J033239280553 | 53.16118 | 28.09707 | 1 | … | … | … | … | … | … | … | … |
| 346 | BLAST J032702281055 | 51.7626 | 28.18012 | 0 | … | … | … | … | … | … | … | … |
| 355 | BLAST J033117272006 | 52.8241 | 27.33796 | 0 | 0.1064 | 1 | AAO | 15.1 5.0 | 0.37 | … | … | … |
| 359 | BLAST J033545272937 | 53.94254 | 27.49272 | 0 | … | … | … | … | … | … | … | … |
| 360 | BLAST J032735285902 | 51.89937 | 28.98942 | 0 | 0.432 | 0 | RR | … | … | … | Q | C |
| 368 | BLAST J032957290321 | 52.48499 | 29.05382 | 0 | 0.07037 | 1 | AAO | … | … | … | … | S |
| 369 | BLAST J033359293715 | 53.49599 | 29.62169 | 0 | … | … | … | … | … | … | … | S |
| 376 | BLAST J033031264922 | 52.63121 | 26.82185 | 0 | … | … | … | … | … | … | … | … |
Note. — Reading from the left, the columns are: the BLAST identification number; the full IAU name of the BLAST source; the position of the counterpart (the arithmetic mean between the two sets of coordinates if both the radio and 24 m counterparts are present); flag indicating whether the source is located within BGS-Deep; the redshift; flag indicating whether the redshift is spectroscopic or photometric; the provenance of the redshift (see Section 2.6 for details); the H rest-frame Equivalent Width (EWrf) from AAOmega spectra, in Å, with uncertainty; the ratio of the flux in the [NII] 658.3 line to the flux in the H line, from AAOmega spectra; column assessing the presence of an AGN in the host galaxy, based on line ratios ([NII]/H0.6, Kauffmann et al. 2003; Miller et al. 2003), or of a quasar, based solely on the broadness of the lines (we also indicate with “NED” objects flagged as AGN in NED); column assessing whether the objects is a quasar (Q), based solely on optical and mid-IR (IRAC) colors (see Section 6 for details); morphological classification: S=spiral, IS = interacting system, E = elliptical, C = compact, RC = red compact, BC = blue compact (see Section 7 for details).
| ID | GALEX name | FUV | NUV | E | SFRFUV | SFRNUV | ||||
|---|---|---|---|---|---|---|---|---|---|---|
| 1 | GALEX J032920.6280800 | 52.336213 | 28.133591 | 17.23 0.12 | 16.795 0.067 | 0.0071 | 2.01 0.22 | 3.25 0.2 | 4.94 | … |
| 2 | GALEX J032956.4284633 | 52.485265 | 28.775954 | 17.78 0.12 | 17.051 0.067 | 0.01456 | 1.22 0.14 | 2.59 0.16 | 2.85 | … |
| 3 | GALEX J032740.9282320 | 51.920727 | 28.389056 | 19.09 0.12 | 18.637 0.067 | 0.00862 | 0.94 0.1 | 1.55 0.1 | 10.5 | … |
| 4 | GALEX J033235.0275532 | 53.14599 | 27.925756 | 20.49 0.12 | 20.176 0.068 | 0.00864 | 0.1 0.01 | 0.14 0.01 | 0.55 | … |
| 5 | GALEX J033131.3272846 | 52.880468 | 27.479551 | 19.23 0.12 | 18.716 0.067 | 0.00995 | 1.01 0.11 | 1.76 0.11 | 2.64 | … |
| 6 | GALEX J033229.8274423 | 53.124378 | 27.73994 | 19.97 0.12 | 19.435 0.067 | 0.0092 | 0.66 0.07 | 1.17 0.07 | 3.21 | … |
| 7 | GALEX J033249.8273433 | 53.207886 | 27.575957 | 22.08 0.13 | 21.065 0.068 | 0.00827 | 1.16 0.14 | 2.89 0.18 | 27.4 | 12.791 2.442 |
| 8 | GALEX J033549.0274919 | 53.95423 | 27.822048 | 21.95 0.13 | 20.976 0.073 | 0.01343 | 0.56 0.07 | 1.43 0.1 | 63.2 | … |
| 9 | GALEX J032916.5273921 | 52.318753 | 27.655832 | 17.01 0.12 | 16.65 0.067 | 0.01112 | 0.38 0.04 | 0.58 0.04 | 0.30 | … |
| 10 | … | … | … | … | … | … | … | … | 3.02 | … |
| 11 | GALEX J033424.5274530 | 53.602409 | 27.758395 | 19.44 0.12 | 19.018 0.067 | 0.00853 | 2.94 0.33 | 4.61 0.29 | 5.71 | … |
| 12 | GALEX J032907.6284117 | 52.281953 | 28.688087 | 20.41 0.12 | 19.625 0.067 | 0.01167 | 0.35 0.04 | 0.78 0.05 | 6.62 | 4.253 0.837 |
| 13 | GALEX J032949.4285057 | 52.455946 | 28.849296 | 20.45 0.12 | 19.843 0.068 | 0.0121 | 0.44 0.05 | 0.83 0.05 | 8.11 | 1.228 0.315 |
| 15 | GALEX J033341.7280736 | 53.423854 | 28.126769 | 21.42 0.12 | 20.352 0.068 | 0.00853 | 4.47 0.5 | 10.97 0.69 | 36.2 | 19.742 3.56 |
| 16 | GALEX J033059.4281000 | 52.74774 | 28.166835 | 18.64 0.12 | 18.225 0.067 | 0.00926 | 2.34 0.26 | 3.73 0.23 | 4.72 | 1.718 0.35 |
| 17 | GALEX J033249.5275839 | 53.206398 | 27.977736 | … | 23.738 0.125 | 0.00806 | … | 9.67 1.11 | 404 | 8.151 1.516 |
| 18 | … | … | … | … | … | … | … | … | … | … |
| 19 | GALEX J033417.6273931 | 53.57366 | 27.658699 | 21.42 0.12 | 20.682 0.068 | 0.00846 | 0.66 0.07 | 1.37 0.09 | 10.2 | … |
| 20 | GALEX J033341.2273808 | 53.421869 | 27.635593 | 22.98 0.13 | 22.176 0.072 | 0.00802 | 0.07 0.01 | 0.17 0.01 | 7.00 | … |
| 21 | GALEX J033151.5281227 | 52.964884 | 28.207763 | 21.05 0.12 | 20.562 0.068 | 0.00938 | 1.47 0.16 | 2.37 0.15 | 12.4 | 10.541 2.014 |
| 22 | … | … | … | … | … | … | … | … | 498 | 3.896 1.228 |
| 23 | … | … | … | … | … | … | … | … | 142 | 5.825 1.132 |
| 24 | … | … | … | … | … | … | … | … | … | … |
| 26 | GALEX J033245.9275745 | 53.191281 | 27.962535 | 19.88 0.12 | 19.477 0.067 | 0.00806 | 1.34 0.15 | 2.09 0.13 | 3.00 | 3.08 0.536 |
| 27 | GALEX J032957.0281840 | 52.48763 | 28.311293 | 18.52 0.12 | 17.865 0.067 | 0.00898 | 1.53 0.17 | 3.05 0.19 | 2.18 | 1.238 0.246 |
| 28 | GALEX J033318.1280908 | 53.3254 | 28.152402 | 25.7 0.33 | 25.746 0.246 | 0.00841 | … | … | … | … |
| 29 | … | … | … | … | … | … | … | … | 6.06 | … |
| 30 | … | … | … | … | … | … | … | … | … | … |
| 31 | GALEX J033414.4274221 | 53.560362 | 27.706052 | 21.78 0.12 | 20.954 0.068 | 0.00844 | 0.23 0.03 | 0.53 0.03 | 3.33 | … |
| 32 | GALEX J033332.1272917 | 53.383843 | 27.488205 | 21.15 0.12 | 20.51 0.068 | 0.0083 | 0.83 0.09 | 1.57 0.1 | 5.22 | … |
| 34 | GALEX J033149.6274325 | 52.956886 | 27.723754 | … | 22.887 0.083 | 0.00904 | … | 3.48 0.27 | 46.3 | 15.243 2.493 |
| 35 | … | … | … | … | … | … | … | … | 1229 | 4.604 0.784 |
| 36 | … | … | … | … | … | … | … | … | 1344 | 12.073 2.149 |
| 37 | … | … | … | … | … | … | … | … | … | … |
| 38 | GALEX J033215.7280348 | 53.065624 | 28.063464 | … | 23.01 0.1 | 0.00764 | … | 2.11 0.19 | 59.2 | 21.382 3.922 |
| 39 | … | … | … | … | … | … | … | … | … | … |
| 40 | GALEX J032821.0292631 | 52.087587 | 29.442053 | 19.67 0.12 | 19.146 0.067 | 0.00854 | 0.78 0.09 | 1.37 0.08 | 4.34 | … |
| 41 | GALEX J033430.6271914 | 53.627691 | 27.320708 | 22.18 0.13 | 20.743 0.069 | 0.01122 | 0.16 0.02 | 0.66 0.04 | 14.6 | … |
| 42 | … | … | … | … | … | … | … | … | … | … |
| 43 | GALEX J033309.7274800 | 53.290632 | 27.800154 | 22.38 0.12 | 21.741 0.07 | 0.00814 | 0.43 0.05 | 0.79 0.05 | 7.78 | … |
| 44 | GALEX J033131.2273236 | 52.879954 | 27.543585 | … | 23.862 0.105 | 0.00871 | … | … | … | … |
| 45 | GALEX J033150.9281120 | 52.96221 | 28.18901 | 21.02 0.12 | 20.68 0.068 | 0.00938 | 2.17 0.24 | 2.97 0.19 | 8.89 | 11.915 1.891 |
| 46 | GALEX J033110.5265740 | 52.79395 | 26.961304 | 18.9 0.12 | 18.524 0.067 | 0.00774 | … | … | … | … |
| 47 | GALEX J033110.8275552 | 52.795045 | 27.931179 | 22.53 0.12 | 21.851 0.07 | 0.0086 | … | … | … | … |
| 48 | GALEX J033055.6275501 | 52.732045 | 27.917032 | … | 21.0 0.068 | 0.0090 | … | … | … | … |
| 49 | GALEX J033032.8273539 | 52.636808 | 27.594438 | 21.19 0.12 | 20.536 0.069 | 0.00936 | 0.43 0.05 | 0.84 0.05 | 4.63 | 4.769 0.916 |
| 50 | … | … | … | … | … | … | … | … | 70.1 | 34.049 6.752 |
| 51 | GALEX J033046.2275518 | 52.692639 | 27.921688 | 25.13 0.32 | 23.015 0.105 | 0.0090 | 0.49 0.15 | 2.17 0.21 | 212 | … … |
| 52 | … | … | … | … | … | … | … | … | 86.6 | 6.812 1.202 |
| 53 | GALEX J033419.6265318 | 53.581519 | 26.888353 | 19.08 0.12 | 18.701 0.067 | 0.00995 | … | … | … | … |
| 54 | … | … | … | … | … | … | … | … | 195 | 2.177 0.349 |
| 55 | GALEX J033130.0275602 | 52.87525 | 27.933952 | 24.46 0.19 | 22.243 0.078 | 0.00828 | 137.04 24.31 | 288.87 20.78 | 106 | 20.026 3.013 |
| 56 | GALEX J033034.4274328 | 52.643648 | 27.72453 | … | 24.576 0.194 | 0.00846 | … | … | … | … |
| 57 | GALEX J033432.9275148 | 53.637466 | 27.863358 | 23.54 0.14 | 22.283 0.076 | 0.00905 | … | … | … | … |
| 58 | … | … | … | … | … | … | … | … | … | … |
| 60 | GALEX J033422.1275042 | 53.592338 | 27.845121 | … | 22.939 0.094 | 0.00871 | … | … | … | … |
| 61 | … | … | … | … | … | … | … | … | … | … |
| 62 | GALEX J033120.1275819 | 52.833759 | 27.971939 | … | 24.442 0.504 | 0.0080 | … | 1.14 0.53 | 176 | … |
| 63 | GALEX J033316.4275039 | 53.318678 | 27.844186 | 21.93 0.12 | 21.247 0.069 | 0.00738 | 0.14 0.02 | 0.29 0.02 | 1.76 | 3.845 0.65 |
| 64 | … | … | … | … | … | … | … | … | … | … |
| 65 | GALEX J033018.2275500 | 52.575918 | 27.916683 | 18.88 0.12 | 18.508 0.067 | 0.00827 | 1.96 0.22 | 2.99 0.18 | 2.40 | 1.911 0.381 |
| 66 | … | … | … | … | … | … | … | … | 835 | 15.543 2.356 |
| 68 | GALEX J033146.6275734 | 52.944236 | 27.959632 | 24.44 0.19 | 22.748 0.099 | 0.00818 | 0.31 0.05 | 1.31 0.12 | 46.9 | 11.692 1.66 |
| 69 | GALEX J033154.6281035 | 52.977711 | 28.176491 | 22.74 0.23 | 21.844 0.12 | 0.00909 | 0.45 0.1 | 1.03 0.11 | 5.40 | 4.392 0.85 |
| 70 | GALEX J033110.9284832 | 52.795552 | 28.80897 | 19.06 0.12 | 18.7 0.067 | 0.01024 | 3.21 0.36 | 4.79 0.3 | 6.51 | 10.717 2.23 |
| 71 | GALEX J033140.6272938 | 52.919358 | 27.494078 | 21.62 0.12 | 20.574 0.068 | 0.00888 | 0.11 0.01 | 0.32 0.02 | 1.22 | … |
| 72 | GALEX J033120.3273346 | 52.834738 | 27.562779 | 21.31 0.12 | 20.713 0.069 | 0.00973 | 1.37 0.16 | 2.41 0.15 | 5.50 | 8.098 1.493 |
| 73 | … | … | … | … | … | … | … | … | 497 | 11.63 1.93 |
| 75 | GALEX J033114.5273906 | 52.810475 | 27.651857 | 22.46 0.12 | 21.119 0.07 | 0.00914 | 1.32 0.15 | 4.31 0.28 | 10.1 | 38.27 7.201 |
| 76 | … | … | … | … | … | … | … | … | 66.5 | 8.598 1.161 |
| 77 | GALEX J033219.1273138 | 53.079817 | 27.527321 | 21.62 0.12 | 21.032 0.068 | 0.00952 | 1.44 0.16 | 2.45 0.15 | 6.11 | 12.134 2.735 |
| 78 | GALEX J033401.5274754 | 53.506405 | 27.798424 | … | 23.327 0.504 | 0.00754 | … | … | … | … |
| 80 | … | … | … | … | … | … | … | … | … | … |
| 83 | GALEX J033634.3284230 | 54.143208 | 28.708474 | 21.53 0.12 | 20.353 0.07 | 0.01355 | 1.18 0.13 | 3.55 0.23 | 28.2 | 10.255 2.071 |
| 84 | GALEX J033318.9281434 | 53.329027 | 28.242794 | 21.3 0.12 | 20.741 0.069 | 0.00852 | 0.36 0.04 | 0.64 0.04 | 3.82 | 6.028 1.128 |
| 85 | GALEX J033153.4274950 | 52.972841 | 27.830587 | … | 23.772 0.102 | 0.00798 | … | 2.17 0.2 | 105 | … |
| 86 | GALEX J033447.9283009 | 53.699655 | 28.502527 | 19.8 0.12 | 19.295 0.068 | 0.00847 | 0.23 0.03 | 0.39 0.02 | 0.98 | 0.815 0.129 |
| 87 | GALEX J032746.7265745 | 51.944804 | 26.962548 | 19.37 0.12 | 19.027 0.067 | 0.01328 | … | … | 1.16 | … |
| 88 | GALEX J033637.3284112 | 54.155408 | 28.686825 | 19.89 0.12 | 19.342 0.068 | 0.01355 | 0.59 0.07 | 1.06 0.07 | 3.79 | … |
| 90 | GALEX J032818.0274307 | 52.07511 | 27.718748 | 22.99 0.16 | 21.647 0.073 | 0.01206 | 0.51 0.07 | 1.7 0.12 | 60.0 | … |
| 92 | GALEX J033241.8280550 | 53.17437 | 28.097491 | 23.45 0.14 | 22.624 0.079 | 0.00717 | 0.47 0.06 | 0.96 0.07 | 6.51 | 3.142 0.674 |
| 93 | … | … | … | … | … | … | … | … | … | … |
| 94 | GALEX J033352.8274347 | 53.470297 | 27.729779 | 22.21 0.12 | 21.255 0.069 | 0.0071 | 0.8 0.09 | 1.92 0.12 | 4.89 | … |
| 95 | GALEX J033343.0270910 | 53.429287 | 27.153012 | 20.0 0.12 | 19.456 0.067 | 0.01134 | 0.53 0.06 | 0.95 0.06 | 3.33 | … |
| 96 | GALEX J033337.1272906 | 53.404714 | 27.485016 | 21.35 0.12 | 20.749 0.068 | 0.00896 | 0.69 0.08 | 1.27 0.08 | 4.40 | … |
| 97 | GALEX J033316.2280223 | 53.317712 | 28.039773 | 23.1 0.13 | 22.024 0.072 | 0.00675 | 0.93 0.11 | 2.32 0.15 | 6.97 | … |
| 98 | GALEX J033214.3273102 | 53.059692 | 27.517126 | 22.98 0.15 | 22.574 0.091 | 0.00924 | … | … | … | … |
| 99 | GALEX J033247.0270708 | 53.195852 | 27.11912 | 19.86 0.12 | 19.29 0.067 | 0.00891 | … | … | … | … |
| 100 | GALEX J033203.8281015 | 53.016063 | 28.17096 | … | 23.483 0.094 | 0.00843 | … | 25.3 2.19 | 337 | 31.822 14.775 |
| 101 | … | … | … | … | … | … | … | … | … | … |
| 102 | GALEX J033125.1275211 | 52.85488 | 27.869679 | 23.83 0.13 | 22.265 0.073 | 0.00772 | 48.93 6.04 | 32.23 2.16 | 378 | 19.499 2.896 |
| 103 | GALEX J032708.3270524 | 51.784617 | 27.090199 | 20.55 0.12 | 19.824 0.068 | 0.01335 | … | … | … | … |
| 106 | GALEX J032704.4280713 | 51.768423 | 28.120328 | 23.8 0.19 | 22.645 0.099 | 0.00944 | … | … | 2.15 | … |
| 109 | GALEX J033408.0275407 | 53.533691 | 27.902007 | 21.4 0.12 | 20.924 0.068 | 0.00744 | … | … | … | … |
| 110 | GALEX J033217.7275058 | 53.07384 | 27.84969 | 23.95 0.17 | 23.043 0.097 | 0.00776 | 0.04 0.01 | 0.11 0.01 | 1.78 | 2.402 0.384 |
| 112 | … | … | … | … | … | … | … | … | 106 | 0.402 0.183 |
| 113 | GALEX J033349.0273843 | 53.454251 | 27.645331 | … | 22.678 0.088 | 0.00802 | … | … | … | … |
| 115 | … | … | … | … | … | … | … | … | … | … |
| 118 | … | … | … | … | … | … | … | … | … | … |
| 119 | … | … | … | … | … | … | … | … | … | … |
| 120 | … | … | … | … | … | … | … | … | … | … |
| 122 | GALEX J033025.7275017 | 52.607255 | 27.838082 | 20.98 0.12 | 20.351 0.067 | 0.00826 | 0.68 0.08 | 1.28 0.08 | 3.60 | 3.238 0.628 |
| 123 | … | … | … | … | … | … | … | … | … | … |
| 125 | … | … | … | … | … | … | … | … | 30.3 | 1.672 0.598 |
| 126 | GALEX J033212.5283248 | 53.052314 | 28.546836 | 23.26 0.18 | 22.781 0.1 | 0.0082 | 10.69 1.82 | 4.83 0.45 | 53.0 | 10.32 3.849 |
| 127 | GALEX J033225.7291709 | 53.107192 | 29.285858 | 19.14 0.12 | 18.734 0.067 | 0.00979 | 4.43 0.49 | 6.8 0.42 | 7.06 | 8.745 1.719 |
| 128 | … | … | … | … | … | … | … | … | 58.5 | 48.841 9.912 |
| 129 | GALEX J033227.3284157 | 53.113772 | 28.699345 | 22.89 0.14 | 21.648 0.072 | 0.00999 | 0.24 0.03 | 0.79 0.05 | 8.86 | 4.049 0.806 |
| 130 | … | … | … | … | … | … | … | … | 20.6 | 5.854 1.023 |
| 131 | … | … | … | … | … | … | … | … | 28.0 | 9.677 1.357 |
| 132 | … | … | … | … | … | … | … | … | 84.0 | 3.939 0.763 |
| 134 | GALEX J032813.0270449 | 52.054388 | 27.080549 | 18.37 0.12 | 18.001 0.067 | 0.01253 | … | … | 0.86 | … |
| 135 | GALEX J033133.9282403 | 52.891282 | 28.400861 | 23.29 0.14 | 22.015 0.07 | 0.0087 | 0.48 0.06 | 1.5 0.1 | 24.3 | 6.369 1.671 |
| 136 | GALEX J033228.5273536 | 53.11883 | 27.593592 | 25.92 0.3 | 23.828 0.121 | 0.0097 | 0.89 0.24 | 1.82 0.2 | 15.4 | 37.782 12.281 |
| 137 | GALEX J032821.5280811 | 52.089837 | 28.136439 | 20.49 0.12 | 19.866 0.068 | 0.00842 | 3.69 0.41 | 6.55 0.41 | 22.4 | … |
| 138 | GALEX J033348.9275014 | 53.453949 | 27.837456 | … | 25.064 0.252 | 0.00622 | … | … | … | … |
| 139 | … | … | … | … | … | … | … | … | 59.3 | … |
| 140 | … | … | … | … | … | … | … | … | … | … |
| 143 | GALEX J033147.9281007 | 52.949911 | 28.168868 | 24.71 0.24 | 21.189 0.07 | 0.00939 | 0.2 0.04 | 4.75 0.31 | 41.1 | 16.095 3.185 |
| 145 | GALEX J033211.1275858 | 53.046532 | 27.982875 | 20.08 0.12 | 19.678 0.067 | 0.00852 | 7.45 0.83 | 10.53 0.65 | 2.80 | 11.444 1.915 |
| 146 | GALEX J033000.4275346 | 52.501809 | 27.896302 | 21.02 0.12 | 20.379 0.068 | 0.00844 | 0.91 0.1 | 1.74 0.11 | 4.90 | 13.495 2.621 |
| 147 | … | … | … | … | … | … | … | … | … | … |
| 148 | … | … | … | … | … | … | … | … | … | … |
| 149 | … | … | … | … | … | … | … | … | 10.3 | 6.664 1.246 |
| 152 | GALEX J033649.0271938 | 54.204385 | 27.327469 | 22.28 0.13 | 21.756 0.078 | 0.01227 | 0.31 0.04 | 0.52 0.04 | 11.8 | … |
| 153 | … | … | … | … | … | … | … | … | … | … |
| 154 | GALEX J033541.2285521 | 53.921886 | 28.922714 | 20.12 0.12 | 19.681 0.068 | 0.00957 | 1.53 0.17 | 2.44 0.15 | 4.65 | 2.386 0.537 |
| 155 | GALEX J032929.4284218 | 52.372851 | 28.705028 | 18.09 0.12 | 17.747 0.067 | 0.01159 | 3.26 0.36 | 4.83 0.3 | 3.30 | 1.821 0.392 |
| 157 | GALEX J033609.1280944 | 54.037984 | 28.162246 | 23.24 0.19 | 21.793 0.094 | 0.01055 | 0.67 0.12 | 2.4 0.21 | 51.6 | 18.643 3.62 |
| 158 | GALEX J033307.3281409 | 53.280691 | 28.235987 | 19.82 0.12 | 19.343 0.067 | 0.00824 | 0.19 0.02 | 0.32 0.02 | 0.30 | 0.389 0.081 |
| 160 | GALEX J032843.6274409 | 52.182047 | 27.735859 | 22.57 0.13 | 21.426 0.07 | 0.00847 | … | … | … | … |
| 162 | … | … | … | … | … | … | … | … | 37.7 | 3.452 0.616 |
| 163 | GALEX J033114.1273411 | 52.809126 | 27.569857 | 23.38 0.13 | 21.643 0.073 | 0.00979 | 2.63 0.33 | 7.99 0.54 | 29.7 | 8.753 1.525 |
| 165 | GALEX J033605.9293413 | 54.024817 | 29.570388 | 22.86 0.16 | 21.547 0.102 | 0.01119 | 0.78 0.12 | 2.51 0.23 | 20.2 | 14.919 2.152 |
| 166 | GALEX J033055.0293426 | 52.729487 | 29.574 | 23.39 0.15 | 22.279 0.075 | 0.01019 | 0.39 0.06 | 1.07 0.07 | 20.5 | 11.484 2.099 |
| 167 | GALEX J033247.9274232 | 53.199576 | 27.709084 | … | 23.291 0.093 | 0.00866 | … | 6.65 0.57 | 76.6 | … |
| 168 | GALEX J033111.4275257 | 52.797751 | 27.882512 | 21.24 0.12 | 20.616 0.068 | 0.00836 | 220.07 24.58 | 60.6 3.79 | 18.5 | 5.826 1.729 |
| 169 | … | … | … | … | … | … | … | … | 190 | 58.348 8.475 |
| 170 | GALEX J033038.4275748 | 52.660132 | 27.963382 | 25.29 0.24 | 23.346 0.09 | 0.00808 | 0.12 0.03 | 0.64 0.05 | 14.0 | 4.535 0.814 |
| 173 | GALEX J033131.7281304 | 52.882415 | 28.21781 | … | 23.887 0.145 | 0.00964 | … | … | … | … |
| 174 | … | … | … | … | … | … | … | … | … | … |
| 175 | GALEX J033620.4272422 | 54.085237 | 27.406153 | 22.2 0.14 | 21.557 0.075 | 0.01406 | … | … | … | … |
| 178 | … | … | … | … | … | … | … | … | … | … |
| 179 | … | … | … | … | … | … | … | … | 74.0 | 18.559 2.851 |
| 180 | GALEX J033305.2271948 | 53.271911 | 27.330179 | 23.24 0.13 | 21.85 0.07 | 0.00741 | … | … | … | … |
| 183 | GALEX J033244.3281100 | 53.184679 | 28.183461 | 21.47 0.12 | 20.878 0.068 | 0.00699 | 2.7 0.3 | 4.5 0.28 | 9.29 | 9.438 1.682 |
| 184 | … | … | … | … | … | … | … | … | … | … |
| 185 | GALEX J033425.7274515 | 53.60709 | 27.754291 | 24.57 0.36 | 23.602 0.164 | 0.00853 | … | … | … | … |
| 188 | GALEX J033110.8275552 | 52.795045 | 27.931179 | 22.53 0.12 | 21.851 0.07 | 0.0086 | 0.99 0.11 | 1.77 0.11 | 13.5 | 3.276 0.627 |
| 196 | … | … | … | … | … | … | … | … | … | … |
| 197 | GALEX J033335.1273244 | 53.39624 | 27.5457 | 24.86 0.23 | 22.901 0.12 | 0.00817 | … | … | … | … |
| 198 | GALEX J033216.3273930 | 53.067966 | 27.658439 | 23.93 0.12 | 21.822 0.067 | 0.00956 | 62.19 6.92 | 79.73 4.93 | 83.3 | … |
| 200 | GALEX J033440.8275630 | 53.670371 | 27.941711 | 21.85 0.12 | 21.294 0.068 | 0.0084 | 0.33 0.04 | 0.59 0.04 | 5.12 | … |
| 202 | … | … | … | … | … | … | … | … | … | … |
| 203 | … | … | … | … | … | … | … | … | … | … |
| 204 | … | … | … | … | … | … | … | … | 195 | 19.701 2.747 |
| 205 | … | … | … | … | … | … | … | … | … | … |
| 207 | GALEX J033353.7275544 | 53.473739 | 27.929006 | 22.4 0.12 | 22.126 0.071 | 0.00648 | 1120.62 127.35 | 424.35 27.59 | 749 | … |
| 208 | GALEX J033015.8273949 | 52.566056 | 27.663656 | 25.13 0.51 | 24.129 0.146 | 0.0081 | … | … | … | … |
| 210 | GALEX J033335.2274815 | 53.396965 | 27.8043 | 24.46 0.16 | 22.928 0.126 | 0.00673 | 25.97 3.86 | 16.4 1.9 | 85.0 | 10.078 1.671 |
| 212 | GALEX J033127.9281028 | 52.866437 | 28.174512 | … | 23.496 0.093 | 0.00923 | … | 5.62 0.48 | 248 | 32.754 6.222 |
| 213 | GALEX J033403.8273926 | 53.515887 | 27.657481 | … | 23.696 0.114 | 0.00826 | … | … | … | … |
| 218 | … | … | … | … | … | … | … | … | 168 | 4.173 0.755 |
| 219 | … | … | … | … | … | … | … | … | … | … |
| 220 | … | … | … | … | … | … | … | … | … | … |
| 221 | GALEX J033211.6273726 | 53.04849 | 27.623971 | … | 21.167 0.068 | 0.00958 | … | 341.74 21.35 | 222 | … |
| 222 | … | … | … | … | … | … | … | … | 549 | … |
| 223 | … | … | … | … | … | … | … | … | … | … |
| 225 | GALEX J033122.5275248 | 52.843749 | 27.880162 | 23.78 0.16 | 20.06 0.067 | 0.00813 | … | … | … | … |
| 226 | GALEX J033722.8274020 | 54.345093 | 27.672332 | … | 21.275 0.071 | 0.01087 | … | 661.27 43.19 | 536 | … |
| 231 | … | … | … | … | … | … | … | … | … | … |
| 232 | GALEX J033212.3272616 | 53.051583 | 27.437917 | … | 23.925 0.106 | 0.00866 | … | … | … | … |
| 235 | … | … | … | … | … | … | … | … | … | … |
| 236 | … | … | … | … | … | … | … | … | … | … |
| 238 | GALEX J032814.4285920 | 52.060386 | 28.989039 | … | 23.721 0.231 | 0.00724 | … | 0.78 0.16 | 54.7 | … |
| 239 | GALEX J033120.0274931 | 52.833483 | 27.825427 | … | 23.816 0.136 | 0.00778 | … | 2.8 0.35 | 74.2 | 12.658 1.65 |
| 240 | … | … | … | … | … | … | … | … | 149 | 7.556 1.381 |
| 245 | GALEX J032752.0290911 | 51.96666 | 29.153239 | 23.63 0.17 | 23.416 0.148 | 0.00888 | 0.54 0.08 | 0.61 0.08 | 17.7 | … |
| 246 | … | … | … | … | … | … | … | … | … | … |
| 248 | GALEX J033347.8271439 | 53.449416 | 27.24419 | 21.01 0.12 | 20.521 0.068 | 0.00896 | … | … | … | … |
| 250 | … | … | … | … | … | … | … | … | 726 | 4.35 3.472 |
| 252 | GALEX J033546.3290940 | 53.943079 | 29.161188 | 23.14 0.16 | 22.404 0.088 | 0.00962 | 0.75 0.11 | 1.38 0.11 | 8.00 | 2.664 0.52 |
| 253 | … | … | … | … | … | … | … | … | … | … |
| 254 | … | … | … | … | … | … | … | … | … | … |
| 255 | GALEX J033121.8275123 | 52.840984 | 27.85649 | … | 23.72 0.164 | 0.00778 | … | 5.19 0.79 | 414 | … |
| 257 | … | … | … | … | … | … | … | … | … | … |
| 259 | GALEX J033105.2280614 | 52.771873 | 28.103937 | 23.7 0.14 | 22.53 0.076 | 0.00833 | 0.11 0.01 | 0.33 0.02 | 5.01 | 3.666 0.697 |
| 261 | GALEX J033305.8272836 | 53.274333 | 27.476814 | … | 24.034 0.109 | 0.0066 | … | … | … | … |
| 262 | … | … | … | … | … | … | … | … | … | … |
| 264 | … | … | … | … | … | … | … | … | … | … |
| 265 | GALEX J033127.8274429 | 52.865944 | 27.741601 | 23.01 0.13 | 22.982 0.084 | 0.00734 | … | … | 1.40 | … |
| 266 | … | … | … | … | … | … | … | … | … | … |
| 270 | … | … | … | … | … | … | … | … | … | … |
| 274 | … | … | … | … | … | … | … | … | 85.6 | 79.278 15.63 |
| 275 | … | … | … | … | … | … | … | … | 603 | 42.26 14.891 |
| 277 | … | … | … | … | … | … | … | … | … | … |
| 280 | GALEX J033352.3273313 | 53.468291 | 27.553668 | … | 23.359 0.101 | 0.00898 | … | … | … | … |
| 288 | … | … | … | … | … | … | … | … | … | … |
| 289 | GALEX J033101.4273934 | 52.756057 | 27.659615 | … | 23.94 0.138 | 0.00861 | … | 0.22 0.03 | 2.15 | 0.034 0.011 |
| 294 | GALEX J033325.1273421 | 53.35491 | 27.572659 | 22.46 0.12 | 21.921 0.07 | 0.00693 | 4.91 0.56 | 5.37 0.35 | 4.78 | 0.105 0.038 |
| 302 | … | … | … | … | … | … | … | … | 278 | 23.653 3.354 |
| 303 | GALEX J033122.2275755 | 52.842805 | 27.965377 | 24.3 0.16 | 22.897 0.089 | 0.00851 | 1.09 0.16 | 2.45 0.2 | 39.3 | … |
| 304 | … | … | … | … | … | … | … | … | … | … |
| 307 | … | … | … | … | … | … | … | … | … | … |
| 309 | … | … | … | … | … | … | … | … | … | … |
| 311 | … | … | … | … | … | … | … | … | 853 | 50.648 8.308 |
| 318 | GALEX J033209.5280716 | 53.039879 | 28.121257 | … | 24.553 0.174 | 0.0078 | … | 2.07 0.33 | 29.7 | 6.636 2.516 |
| 319 | … | … | … | … | … | … | … | … | … | … |
| 320 | … | … | … | … | … | … | … | … | … | … |
| 322 | … | … | … | … | … | … | … | … | 17.4 | 2.625 0.397 |
| 323 | GALEX J033556.4283531 | 53.98499 | 28.591981 | … | 24.087 0.147 | 0.01151 | … | 0.22 0.03 | 39.3 | 17.128 2.448 |
| 329 | GALEX J033333.6281403 | 53.390188 | 28.234378 | 25.3 0.31 | 23.153 0.12 | 0.00909 | 19.92 5.7 | 28.16 3.12 | 179 | 44.785 14.422 |
| 332 | … | … | … | … | … | … | … | … | … | … |
| 333 | … | … | … | … | … | … | … | … | 29.2 | 10.517 1.675 |
| 335 | GALEX J033612.1290520 | 54.05074 | 29.089025 | 23.03 0.17 | 22.304 0.09 | 0.01016 | 0.69 0.11 | 1.29 0.11 | 44.7 | 29.11 4.433 |
| 339 | GALEX J033018.2285120 | 52.576305 | 28.855675 | 24.8 0.37 | 22.842 0.107 | 0.00979 | 0.18 0.06 | 1.0 0.1 | 48.5 | 6.416 1.152 |
| 341 | … | … | … | … | … | … | … | … | … | … |
| 342 | GALEX J032745.1292350 | 51.93792 | 29.397395 | … | 22.528 0.143 | 0.00822 | … | … | … | … |
| 343 | … | … | … | … | … | … | … | … | … | … |
| 344 | … | … | … | … | … | … | … | … | … | … |
| 346 | … | … | … | … | … | … | … | … | … | … |
| 355 | GALEX J033117.7272016 | 52.824134 | 27.337986 | 19.84 0.12 | 19.571 0.068 | 0.00994 | 1.49 0.17 | 2.04 0.13 | 1.76 | … |
| 359 | … | … | … | … | … | … | … | … | … | … |
| 360 | GALEX J032735.8285921 | 51.899171 | 28.989387 | 23.39 0.16 | 23.418 0.125 | 0.00902 | 1.25 0.18 | 1.01 0.12 | 7.57 | … |
| 368 | GALEX J032956.2290313 | 52.484512 | 29.053836 | 21.28 0.12 | 20.769 0.069 | 0.00904 | 0.44 0.05 | 0.75 0.05 | 0.37 | 0.25 0.048 |
| 369 | … | … | … | … | … | … | … | … | … | … |
| 376 | … | … | … | … | … | … | … | … | … | … |
Note. — Reading from the left, the columns are: the BLAST identification number; the full IAU name of the GALEX counterpart to the BLAST source; the position of the GALEX counterpart; the flux in the FUV filter, in magnitudes, with uncertainty; the flux in the NUV filter, in magnitudes, with uncertainty; Galactic extinction correction as from Schlegel et al. (1998), in magnitudes; star-formation rate as estimated from the FUV flux (see Equation 3), in M☉ yr-1, with uncertainty (note that we listed SFRFUV for all FUV sources, even if only those with are to be considered reliable, see Section 4.2); star-formation rate as estimated from the NUV flux (see Equation 3), in M☉ yr-1, with uncertainty (note that we listed SFRNUV for all NUV sources, even if only those with are to be considered reliable, see Section 4.2); rest-frame bolometric FIR luminosity of the BLAST ID, in L☉, with upper and lower uncertainties (note that we quote the mode, and 68% c.l. of the distribution obtained, see Section 3.2 for details); stellar mass of the BLAST ID, in M☉ (see Section 8 for details), with uncertainty.
References
- Balogh et al. (2004) Balogh, M., Eke, V., Miller, C., Lewis, I., Bower, R., Couch, W., Nichol, R., Bland-Hawthorn, J., Baldry, I. K., Baugh, C., Bridges, T., Cannon, R., Cole, S., Colless, M., Collins, C., Cross, N., Dalton, G., de Propris, R., Driver, S. P., Efstathiou, G., Ellis, R. S., Frenk, C. S., Glazebrook, K., Gomez, P., Gray, A., Hawkins, E., Jackson, C., Lahav, O., Lumsden, S., Maddox, S., Madgwick, D., Norberg, P., Peacock, J. A., Percival, W., Peterson, B. A., Sutherland, W., & Taylor, K. 2004, MNRAS, 348, 1355
- Barger et al. (1998) Barger, A. J., Cowie, L. L., Sanders, D. B., Fulton, E., Taniguchi, Y., Sato, Y., Kawara, K., & Okuda, H. 1998, Nature, 394, 248
- Bell (2003) Bell, E. F. 2003, ApJ, 586, 794
- Béthermin et al. (2010) Béthermin, M., Dole, H., Beelen, A., & Aussel, H. 2010, A&A, 512, A78+
- Blain et al. (2003) Blain, A. W., Barnard, V. E., & Chapman, S. C. 2003, MNRAS, 338, 733
- Blain et al. (1999) Blain, A. W., Kneib, J., Ivison, R. J., & Smail, I. 1999, ApJ, 512, L87
- Borys et al. (2005) Borys, C., Smail, I., Chapman, S. C., Blain, A. W., Alexander, D. M., & Ivison, R. J. 2005, ApJ, 635, 853
- Buat et al. (2008) Buat, V., Boissier, S., Burgarella, D., Takeuchi, T. T., Le Floc’h, E., Marcillac, D., Huang, J., Nagashima, M., & Enoki, M. 2008, A&A, 483, 107
- Buat et al. (2010) Buat, V., Giovannoli, E., Burgarella, D., Altieri, B., Amblard, A., Arumugam, V., Aussel, H., Babbedge, T., Blain, A., Bock, J., Boselli, A., Castro-Rodriguez, N., Cava, A., Chanial, P., Clements, D. L., Conley, A., Conversi, L., Cooray, A., Dowell, C. D., Dwek, E., Eales, S., Elbaz, D., Fox, M., Franceschini, A., Gear, W., Glenn, J., Griffin, M., Halpern, M., Hatziminaoglou, E., Heinis, S., Ibar, E., Isaak, K., Ivison, R. J., Lagache, G., Levenson, L., Lonsdale, C. J., Lu, N., Madden, S., Maffei, B., Magdis, G., Mainetti, G., Marchetti, L., Morrison, G. E., Nguyen, H. T., O’Halloran, B., Oliver, S. J., Omont, A., Owen, F. N., Page, M. J., Pannella, M., Panuzzo, P., Papageorgiou, A., Pearson, C. P., Perez-Fournon, I., Pohlen, M., Rigopoulou, D., Rizzo, D., Roseboom, I. G., Rowan-Robinson, M., Sanchez Portal, M., Schulz, B., Seymour, N., Shupe, D. L., Smith, A. J., Stevens, J. A., Strazzullo, V., Symeonidis, M., Trichas, M., Tugwell, K. E., Vaccari, M., Valiante, E., Valtchanov, I., Vigroux, L., Wang, L., Ward, R., Wright, G., Xu, C. K., & Zemcov, M. 2010, ArXiv e-prints
- Buat et al. (2007) Buat, V., Takeuchi, T. T., Iglesias-Páramo, J., Xu, C. K., Burgarella, D., Boselli, A., Barlow, T., Bianchi, L., Donas, J., Forster, K., Friedman, P. G., Heckman, T. M., Lee, Y., Madore, B. F., Martin, D. C., Milliard, B., Morissey, P., Neff, S., Rich, M., Schiminovich, D., Seibert, M., Small, T., Szalay, A. S., Welsh, B., Wyder, T., & Yi, S. K. 2007, ApJS, 173, 404
- Caputi et al. (2006) Caputi, K. I., Dole, H., Lagache, G., McLure, R. J., Puget, J., Rieke, G. H., Dunlop, J. S., Le Floc’h, E., Papovich, C., & Pérez-González, P. G. 2006, ApJ, 637, 727
- Chapin et al. (2010) Chapin, E. L., Chapman, S. C., Coppin, K. E., Devlin, M. J., Dunlop, J. S., Greve, T. R., Halpern, M., Hasselfied, M. F., Hughes, D. H., Ivison, R. J., Marsden, G., Moncelsi, L., Netterfield, C. B., Pascale, E., Scott, D., Smail, I., Viero, M., Walter, F., Weiss, A., & van der Werf, P. 2010, ArXiv e-prints
- Chapman et al. (2005) Chapman, S. C., Blain, A. W., Smail, I., & Ivison, R. J. 2005, ApJ, 622, 772
- Chary & Elbaz (2001) Chary, R. & Elbaz, D. 2001, ApJ, 556, 562
- Cid Fernandes et al. (2010) Cid Fernandes, R., Stasińska, G., Schlickmann, M. S., Mateus, A., Vale Asari, N., Schoenell, W., & Sodré, L. 2010, MNRAS, 403, 1036
- Colless et al. (2003) Colless, M., Peterson, B. A., Jackson, C., Peacock, J. A., Cole, S., Norberg, P., Baldry, I. K., Baugh, C. M., Bland-Hawthorn, J., Bridges, T., Cannon, R., Collins, C., Couch, W., Cross, N., Dalton, G., De Propris, R., Driver, S. P., Efstathiou, G., Ellis, R. S., Frenk, C. S., Glazebrook, K., Lahav, O., Lewis, I., Lumsden, S., Maddox, S., Madgwick, D., Sutherland, W., & Taylor, K. 2003, ArXiv Astrophysics e-prints
- Coppin et al. (2006) Coppin, K., Chapin, E. L., Mortier, A. M. J., Scott, S. E., Borys, C., Dunlop, J. S., Halpern, M., Hughes, D. H., Pope, A., Scott, D., Serjeant, S., Wagg, J., Alexander, D. M., Almaini, O., Aretxaga, I., Babbedge, T., Best, P. N., Blain, A., Chapman, S., Clements, D. L., Crawford, M., Dunne, L., Eales, S. A., Edge, A. C., Farrah, D., Gaztañaga, E., Gear, W. K., Granato, G. L., Greve, T. R., Fox, M., Ivison, R. J., Jarvis, M. J., Jenness, T., Lacey, C., Lepage, K., Mann, R. G., Marsden, G., Martinez-Sansigre, A., Oliver, S., Page, M. J., Peacock, J. A., Pearson, C. P., Percival, W. J., Priddey, R. S., Rawlings, S., Rowan-Robinson, M., Savage, R. S., Seigar, M., Sekiguchi, K., Silva, L., Simpson, C., Smail, I., Stevens, J. A., Takagi, T., Vaccari, M., van Kampen, E., & Willott, C. J. 2006, MNRAS, 372, 1621
- Coppin et al. (2005) Coppin, K., Halpern, M., Scott, D., Borys, C., & Chapman, S. 2005, MNRAS, 357, 1022
- Coppin et al. (2008) Coppin, K., Halpern, M., Scott, D., Borys, C., Dunlop, J., Dunne, L., Ivison, R., Wagg, J., Aretxaga, I., Battistelli, E., Benson, A., Blain, A., Chapman, S., Clements, D., Dye, S., Farrah, D., Hughes, D., Jenness, T., van Kampen, E., Lacey, C., Mortier, A., Pope, A., Priddey, R., Serjeant, S., Smail, I., Stevens, J., & Vaccari, M. 2008, MNRAS, 384, 1597
- Coppin et al. (2010) Coppin, K., Pope, A., Menéndez-Delmestre, K., Alexander, D. M., Dunlop, J. S., Egami, E., Gabor, J., Ibar, E., Ivison, R. J., Austermann, J. E., Blain, A. W., Chapman, S. C., Clements, D. L., Dunne, L., Dye, S., Farrah, D., Hughes, D. H., Mortier, A. M. J., Page, M. J., Rowan-Robinson, M., Scott, D., Simpson, C., Smail, I., Swinbank, A. M., Vaccari, M., & Yun, M. S. 2010, ApJ, 713, 503
- Dale & Helou (2002) Dale, D. A. & Helou, G. 2002, ApJ, 576, 159
- Della Valle et al. (2006) Della Valle, A., Mazzei, P., Bettoni, D., Aussel, H., & de Zotti, G. 2006, A&A, 454, 453
- Devlin et al. (2009) Devlin, M. J., Ade, P. A. R., Aretxaga, I., Bock, J. J., Chapin, E. L., Griffin, M., Gundersen, J. O., Halpern, M., Hargrave, P. C., Hughes, D. H., Klein, J., Marsden, G., Martin, P. G., Mauskopf, P., Moncelsi, L., Netterfield, C. B., Ngo, H., Olmi, L., Pascale, E., Patanchon, G., Rex, M., Scott, D., Semisch, C., Thomas, N., Truch, M. D. P., Tucker, C., Tucker, G. S., Viero, M. P., & Wiebe, D. V. 2009, Nature, 458, 737
- Devlin et al. (2004) Devlin, M. J., Ade, P. A. R., Aretxaga, I., Bock, J. J., Chung, J., Chapin, E., Dicker, S. R., Griffin, M., Gundersen, J., Halpern, M., Hargrave, P., Hughes, D., Klein, J., Marsden, G., Martin, P., Mauskopf, P. D., Netterfield, B., Olmi, L., Pascale, E., Rex, M., Scott, D., Semisch, C., Truch, M., Tucker, C., Tucker, G., Turner, A. D., & Weibe, D. 2004, in Presented at the Society of Photo-Optical Instrumentation Engineers (SPIE) Conference, Vol. 5498, Millimeter and Submillimeter Detectors for Astronomy II. Edited by Jonas Zmuidzinas, Wayne S. Holland and Stafford Withington Proceedings of the SPIE, Volume 5498, pp. 42-54 (2004)., ed. J. Zmuidzinas, W. S. Holland, & S. Withington, 42–54
- Dickinson & FIDEL team (2007) Dickinson, M. & FIDEL team. 2007, in Bulletin of the American Astronomical Society, Vol. 38, Bulletin of the American Astronomical Society, 822–+
- Dickinson et al. (2003) Dickinson, M., Giavalisco, M., & The Goods Team. 2003, in The Mass of Galaxies at Low and High Redshift, ed. R. Bender & A. Renzini, 324–+
- Dole et al. (2006) Dole, H., Lagache, G., Puget, J.-L., Caputi, K. I., Fernández-Conde, N., Le Floc’h, E., Papovich, C., Pérez-González, P. G., Rieke, G. H., & Blaylock, M. 2006, A&A, 451, 417
- Dunlop et al. (2010) Dunlop, J. S., Ade, P. A. R., Bock, J. J., Chapin, E. L., Cirasuolo, M., Coppin, K. E. K., Devlin, M. J., Griffin, M., Greve, T. R., Gundersen, J. O., Halpern, M., Hargrave, P. C., Hughes, D. H., Ivison, R. J., Klein, J., Kovacs, A., Marsden, G., Mauskopf, P., Netterfield, C. B., Olmi, L., Pascale, E., Patanchon, G., Rex, M., Scott, D., Semisch, C., Smail, I., Targett, T. A., Thomas, N., Truch, M. D. P., Tucker, C., Tucker, G. S., Viero, M. P., Walter, F., Wardlow, J. L., Weiss, A., & Wiebe, D. V. 2010, MNRAS, 1354
- Dunne et al. (2000) Dunne, L., Eales, S., Edmunds, M., Ivison, R., Alexander, P., & Clements, D. L. 2000, MNRAS, 315, 115
- Dunne & Eales (2001) Dunne, L. & Eales, S. A. 2001, MNRAS, 327, 697
- Dwek et al. (1998) Dwek, E., Arendt, R. G., Hauser, M. G., Fixsen, D., Kelsall, T., Leisawitz, D., Pei, Y. C., Wright, E. L., Mather, J. C., Moseley, S. H., Odegard, N., Shafer, R., Silverberg, R. F., & Weiland, J. L. 1998, ApJ, 508, 106
- Dye (2008) Dye, S. 2008, MNRAS, 389, 1293
- Dye (2010) Dye, S. 2010, private communication
- Dye et al. (2009) Dye, S., Ade, P. A. R., Bock, J. J., Chapin, E. L., Devlin, M. J., Dunlop, J. S., Eales, S. A., Griffin, M., Gundersen, J. O., Halpern, M., Hargrave, P. C., Hughes, D. H., Klein, J., Magnelli, B., Marsden, G., Mauskopf, P., Moncelsi, L., Netterfield, C. B., Olmi, L., Pascale, E., Patanchon, G., Rex, M., Scott, D., Semisch, C., Targett, T., Thomas, N., Truch, M. D. P., Tucker, C., Tucker, G. S., Viero, M. P., & Wiebe, D. V. 2009, ApJ, 703, 285
- Dye et al. (2010a) Dye, S., Dunne, L., Eales, S., Smith, D. J. B., Amblard, A., Auld, R., Baes, M., Baldry, I. K., Bamford, S., Blain, A. W., Bonfield, D. G., Bremer, M., Burgarella, D., Buttiglione, S., Cameron, E., Cava, A., Clements, D. L., Cooray, A., Croom, S., Dariush, A., de Zotti, G., Driver, S., Dunlop, J. S., Frayer, D., Fritz, J., Gardner, J. P., Gomez, H. L., Gonzalez-Nuevo, J., Herranz, D., Hill, D., Hopkins, A., Ibar, E., Ivison, R. J., Jarvis, M. J., Jones, D. H., Kelvin, L., Lagache, G., Leeuw, L., Liske, J., Lopez-Caniego, M., Loveday, J., Maddox, S., Michałowski, M. J., Negrello, M., Norberg, P., Page, M. J., Parkinson, H., Pascale, E., Peacock, J. A., Pohlen, M., Popescu, C., Prescott, M., Rigopoulou, D., Robotham, A., Rigby, E., Rodighiero, G., Samui, S., Scott, D., Serjeant, S., Sharp, R., Sibthorpe, B., Temi, P., Thompson, M. A., Tuffs, R., Valtchanov, I., van der Werf, P. P., van Kampen, E., & Verma, A. 2010a, A&A, 518, L10+
- Dye et al. (2010b) Dye, S., Eales, S., Moncelsi, L., & Pascale, E. 2010b, MNRAS, L104+
- Dye et al. (2008) Dye, S., Eales, S. A., Aretxaga, I., Serjeant, S., Dunlop, J. S., Babbedge, T. S. R., Chapman, S. C., Cirasuolo, M., Clements, D. L., Coppin, K. E. K., Dunne, L., Egami, E., Farrah, D., Ivison, R. J., van Kampen, E., Pope, A., Priddey, R., Rieke, G. H., Schael, A. M., Scott, D., Simpson, C., Takagi, T., Takata, T., & Vaccari, M. 2008, MNRAS, 386, 1107
- Dye et al. (2007) Dye, S., Eales, S. A., Ashby, M. L. N., Huang, J., Egami, E., Brodwin, M., Lilly, S., & Webb, T. 2007, MNRAS, 375, 725
- Eales et al. (2009) Eales, S., Chapin, E. L., Devlin, M. J., Dye, S., Halpern, M., Hughes, D. H., Marsden, G., Mauskopf, P., Moncelsi, L., Netterfield, C. B., Pascale, E., Patanchon, G., Raymond, G., Rex, M., Scott, D., Semisch, C., Siana, B., Truch, M. D. P., & Viero, M. P. 2009, ApJ, 707, 1779
- Eales et al. (2010) Eales, S. A., Raymond, G., Roseboom, I. G., Altieri, B., Amblard, A., Arumugam, V., Auld, R., Aussel, H., Babbedge, T., Blain, A., Bock, J., Boselli, A., Brisbin, D., Buat, V., Burgarella, D., Castro-Rodríguez, N., Cava, A., Chanial, P., Clements, D. L., Conley, A., Conversi, L., Cooray, A., Dowell, C. D., Dwek, E., Dye, S., Elbaz, D., Farrah, D., Fox, M., Franceschini, A., Gear, W., Glenn, J., González Solares, E. A., Griffin, M., Harwit, M., Hatziminaoglou, E., Huang, J., Ibar, E., Isaak, K., Ivison, R. J., Lagache, G., Levenson, L., Lonsdale, C. J., Lu, N., Madden, S., Maffei, B., Mainetti, G., Marchetti, L., Morrison, G. E., Mortier, A. M. J., Nguyen, H. T., O’Halloran, B., Oliver, S. J., Omont, A., Owen, F. N., Page, M. J., Pannella, M., Panuzzo, P., Papageorgiou, A., Pearson, C. P., Pérez-Fournon, I., Pohlen, M., Rawlings, J. I., Rigopoulou, D., Rizzo, D., Rowan-Robinson, M., Sánchez Portal, M., Schulz, B., Scott, D., Seymour, N., Shupe, D. L., Smith, A. J., Stevens, J. A., Strazzullo, V., Symeonidis, M., Trichas, M., Tugwell, K. E., Vaccari, M., Valtchanov, I., Vigroux, L., Wang, L., Ward, R., Wright, G., Xu, C. K., & Zemcov, M. 2010, A&A, 518, L23+
- Elbaz et al. (2007) Elbaz, D., Daddi, E., Le Borgne, D., Dickinson, M., Alexander, D. M., Chary, R., Starck, J., Brandt, W. N., Kitzbichler, M., MacDonald, E., Nonino, M., Popesso, P., Stern, D., & Vanzella, E. 2007, A&A, 468, 33
- Elbaz et al. (2010) Elbaz, D., Hwang, H. S., Magnelli, B., Daddi, E., Aussel, H., Altieri, B., Amblard, A., Andreani, P., Arumugam, V., Auld, R., Babbedge, T., Berta, S., Blain, A., Bock, J., Bongiovanni, A., Boselli, A., Buat, V., Burgarella, D., Castro-Rodriguez, N., Cava, A., Cepa, J., Chanial, P., Chary, R., Cimatti, A., Clements, D. L., Conley, A., Conversi, L., Cooray, A., Dickinson, M., Dominguez, H., Dowell, C. D., Dunlop, J. S., Dwek, E., Eales, S., Farrah, D., Förster Schreiber, N., Fox, M., Franceschini, A., Gear, W., Genzel, R., Glenn, J., Griffin, M., Gruppioni, C., Halpern, M., Hatziminaoglou, E., Ibar, E., Isaak, K., Ivison, R. J., Lagache, G., Le Borgne, D., Le Floc’h, E., Levenson, L., Lu, N., Lutz, D., Madden, S., Maffei, B., Magdis, G., Mainetti, G., Maiolino, R., Marchetti, L., Mortier, A. M. J., Nguyen, H. T., Nordon, R., O’Halloran, B., Okumura, K., Oliver, S. J., Omont, A., Page, M. J., Panuzzo, P., Papageorgiou, A., Pearson, C. P., Perez Fournon, I., Pérez García, A. M., Poglitsch, A., Pohlen, M., Popesso, P., Pozzi, F., Rawlings, J. I., Rigopoulou, D., Riguccini, L., Rizzo, D., Rodighiero, G., Roseboom, I. G., Rowan-Robinson, M., Saintonge, A., Sanchez Portal, M., Santini, P., Sauvage, M., Schulz, B., Scott, D., Seymour, N., Shao, L., Shupe, D. L., Smith, A. J., Stevens, J. A., Sturm, E., Symeonidis, M., Tacconi, L., Trichas, M., Tugwell, K. E., Vaccari, M., Valtchanov, I., Vieira, J., Vigroux, L., Wang, L., Ward, R., Wright, G., Xu, C. K., & Zemcov, M. 2010, A&A, 518, L29+
- Fazio et al. (2004) Fazio, G. G., Hora, J. L., Allen, L. E., Ashby, M. L. N., Barmby, P., Deutsch, L. K., Huang, J., Kleiner, S., Marengo, M., Megeath, S. T., Melnick, G. J., Pahre, M. A., Patten, B. M., Polizotti, J., Smith, H. A., Taylor, R. S., Wang, Z., Willner, S. P., Hoffmann, W. F., Pipher, J. L., Forrest, W. J., McMurty, C. W., McCreight, C. R., McKelvey, M. E., McMurray, R. E., Koch, D. G., Moseley, S. H., Arendt, R. G., Mentzell, J. E., Marx, C. T., Losch, P., Mayman, P., Eichhorn, W., Krebs, D., Jhabvala, M., Gezari, D. Y., Fixsen, D. J., Flores, J., Shakoorzadeh, K., Jungo, R., Hakun, C., Workman, L., Karpati, G., Kichak, R., Whitley, R., Mann, S., Tollestrup, E. V., Eisenhardt, P., Stern, D., Gorjian, V., Bhattacharya, B., Carey, S., Nelson, B. O., Glaccum, W. J., Lacy, M., Lowrance, P. J., Laine, S., Reach, W. T., Stauffer, J. A., Surace, J. A., Wilson, G., Wright, E. L., Hoffman, A., Domingo, G., & Cohen, M. 2004, ApJS, 154, 10
- Fixsen et al. (1998) Fixsen, D. J., Dwek, E., Mather, J. C., Bennett, C. L., & Shafer, R. A. 1998, ApJ, 508, 123
- Frayer et al. (2009) Frayer, D. T., Sanders, D. B., Surace, J. A., Aussel, H., Salvato, M., Le Floc’h, E., Huynh, M. T., Scoville, N. Z., Afonso-Luis, A., Bhattacharya, B., Capak, P., Fadda, D., Fu, H., Helou, G., Ilbert, O., Kartaltepe, J. S., Koekemoer, A. M., Lee, N., Murphy, E., Sargent, M. T., Schinnerer, E., Sheth, K., Shopbell, P. L., Shupe, D. L., & Yan, L. 2009, AJ, 138, 1261
- Gawiser et al. (2006) Gawiser, E., van Dokkum, P. G., Herrera, D., Maza, J., Castander, F. J., Infante, L., Lira, P., Quadri, R., Toner, R., Treister, E., Urry, C. M., Altmann, M., Assef, R., Christlein, D., Coppi, P. S., Durán, M. F., Franx, M., Galaz, G., Huerta, L., Liu, C., López, S., Méndez, R., Moore, D. C., Rubio, M., Ruiz, M. T., Toft, S., & Yi, S. K. 2006, ApJS, 162, 1
- Gispert et al. (2000) Gispert, R., Lagache, G., & Puget, J. L. 2000, A&A, 360, 1
- Griffin et al. (2010) Griffin, M. J., Abergel, A., Abreu, A., Ade, P. A. R., André, P., Augueres, J., Babbedge, T., Bae, Y., Baillie, T., Baluteau, J., Barlow, M. J., Bendo, G., Benielli, D., Bock, J. J., Bonhomme, P., Brisbin, D., Brockley-Blatt, C., Caldwell, M., Cara, C., Castro-Rodriguez, N., Cerulli, R., Chanial, P., Chen, S., Clark, E., Clements, D. L., Clerc, L., Coker, J., Communal, D., Conversi, L., Cox, P., Crumb, D., Cunningham, C., Daly, F., Davis, G. R., de Antoni, P., Delderfield, J., Devin, N., di Giorgio, A., Didschuns, I., Dohlen, K., Donati, M., Dowell, A., Dowell, C. D., Duband, L., Dumaye, L., Emery, R. J., Ferlet, M., Ferrand, D., Fontignie, J., Fox, M., Franceschini, A., Frerking, M., Fulton, T., Garcia, J., Gastaud, R., Gear, W. K., Glenn, J., Goizel, A., Griffin, D. K., Grundy, T., Guest, S., Guillemet, L., Hargrave, P. C., Harwit, M., Hastings, P., Hatziminaoglou, E., Herman, M., Hinde, B., Hristov, V., Huang, M., Imhof, P., Isaak, K. J., Israelsson, U., Ivison, R. J., Jennings, D., Kiernan, B., King, K. J., Lange, A. E., Latter, W., Laurent, G., Laurent, P., Leeks, S. J., Lellouch, E., Levenson, L., Li, B., Li, J., Lilienthal, J., Lim, T., Liu, S. J., Lu, N., Madden, S., Mainetti, G., Marliani, P., McKay, D., Mercier, K., Molinari, S., Morris, H., Moseley, H., Mulder, J., Mur, M., Naylor, D. A., Nguyen, H., O’Halloran, B., Oliver, S., Olofsson, G., Olofsson, H., Orfei, R., Page, M. J., Pain, I., Panuzzo, P., Papageorgiou, A., Parks, G., Parr-Burman, P., Pearce, A., Pearson, C., Pérez-Fournon, I., Pinsard, F., Pisano, G., Podosek, J., Pohlen, M., Polehampton, E. T., Pouliquen, D., Rigopoulou, D., Rizzo, D., Roseboom, I. G., Roussel, H., Rowan-Robinson, M., Rownd, B., Saraceno, P., Sauvage, M., Savage, R., Savini, G., Sawyer, E., Scharmberg, C., Schmitt, D., Schneider, N., Schulz, B., Schwartz, A., Shafer, R., Shupe, D. L., Sibthorpe, B., Sidher, S., Smith, A., Smith, A. J., Smith, D., Spencer, L., Stobie, B., Sudiwala, R., Sukhatme, K., Surace, C., Stevens, J. A., Swinyard, B. M., Trichas, M., Tourette, T., Triou, H., Tseng, S., Tucker, C., Turner, A., Vaccari, M., Valtchanov, I., Vigroux, L., Virique, E., Voellmer, G., Walker, H., Ward, R., Waskett, T., Weilert, M., Wesson, R., White, G. J., Whitehouse, N., Wilson, C. D., Winter, B., Woodcraft, A. L., Wright, G. S., Xu, C. K., Zavagno, A., Zemcov, M., Zhang, L., & Zonca, E. 2010, A&A, 518, L3+
- Hatziminaoglou et al. (2010) Hatziminaoglou, E., Omont, A., Stevens, J. A., Amblard, A., Arumugam, V., Auld, R., Aussel, H., Babbedge, T., Blain, A., Bock, J., Boselli, A., Buat, V., Burgarella, D., Castro-Rodríguez, N., Cava, A., Chanial, P., Clements, D. L., Conley, A., Conversi, L., Cooray, A., Dowell, C. D., Dwek, E., Dye, S., Eales, S., Elbaz, D., Farrah, D., Fox, M., Franceschini, A., Gear, W., Glenn, J., González Solares, E. A., Griffin, M., Halpern, M., Ibar, E., Isaak, K., Ivison, R. J., Lagache, G., Levenson, L., Lu, N., Madden, S., Maffei, B., Mainetti, G., Marchetti, L., Mortier, A. M. J., Nguyen, H. T., O’Halloran, B., Oliver, S. J., Page, M. J., Panuzzo, P., Papageorgiou, A., Pearson, C. P., Pérez-Fournon, I., Pohlen, M., Rawlings, J. I., Rigopoulou, D., Rizzo, D., Roseboom, I. G., Rowan-Robinson, M., Sanchez Portal, M., Schulz, B., Scott, D., Seymour, N., Shupe, D. L., Smith, A. J., Symeonidis, M., Trichas, M., Tugwell, K. E., Vaccari, M., Valtchanov, I., Vigroux, L., Wang, L., Ward, R., Wright, G., Xu, C. K., & Zemcov, M. 2010, A&A, 518, L33+
- Hatziminaoglou et al. (2005) Hatziminaoglou, E., Pérez-Fournon, I., Polletta, M., Afonso-Luis, A., Hernán-Caballero, A., Montenegro-Montes, F. M., Lonsdale, C., Xu, C. K., Franceschini, A., Rowan-Robinson, M., Babbedge, T., Smith, H. E., Surace, J., Shupe, D., Fang, F., Farrah, D., Oliver, S., González-Solares, E. A., & Serjeant, S. 2005, AJ, 129, 1198
- Hauser & Dwek (2001) Hauser, M. G. & Dwek, E. 2001, ARA&A, 39, 249
- Heavens et al. (2004) Heavens, A., Panter, B., Jimenez, R., & Dunlop, J. 2004, Nature, 428, 625
- Hildebrand (1983) Hildebrand, R. H. 1983, QJRAS, 24, 267
- Hinshaw et al. (2009) Hinshaw, G., Weiland, J. L., Hill, R. S., Odegard, N., Larson, D., Bennett, C. L., Dunkley, J., Gold, B., Greason, M. R., Jarosik, N., Komatsu, E., Nolta, M. R., Page, L., Spergel, D. N., Wollack, E., Halpern, M., Kogut, A., Limon, M., Meyer, S. S., Tucker, G. S., & Wright, E. L. 2009, ApJS, 180, 225
- Hirashita et al. (2003) Hirashita, H., Buat, V., & Inoue, A. K. 2003, A&A, 410, 83
- Hopkins et al. (2003) Hopkins, A. M., Miller, C. J., Nichol, R. C., Connolly, A. J., Bernardi, M., Gómez, P. L., Goto, T., Tremonti, C. A., Brinkmann, J., Ivezić, Ž., & Lamb, D. Q. 2003, ApJ, 599, 971
- Hughes et al. (1998) Hughes, D. H., Serjeant, S., Dunlop, J., Rowan-Robinson, M., Blain, A., Mann, R. G., Ivison, R., Peacock, J., Efstathiou, A., Gear, W., Oliver, S., Lawrence, A., Longair, M., Goldschmidt, P., & Jenness, T. 1998, Nature, 394, 241
- Iglesias-Páramo et al. (2004) Iglesias-Páramo, J., Buat, V., Donas, J., Boselli, A., & Milliard, B. 2004, A&A, 419, 109
- Iglesias-Páramo et al. (2006) Iglesias-Páramo, J., Buat, V., Takeuchi, T. T., Xu, K., Boissier, S., Boselli, A., Burgarella, D., Madore, B. F., Gil de Paz, A., Bianchi, L., Barlow, T. A., Byun, Y.-I., Donas, J., Forster, K., Friedman, P. G., Heckman, T. M., Jelinski, P. N., Lee, Y.-W., Malina, R. F., Martin, D. C., Milliard, B., Morrissey, P. F., Neff, S. G., Rich, R. M., Schiminovich, D., Seibert, M., Siegmund, O. H. W., Small, T., Szalay, A. S., Welsh, B. Y., & Wyder, T. K. 2006, ApJS, 164, 38
- Inoue (2002) Inoue, A. K. 2002, ApJ, 570, L97
- Ivison et al. (2010) Ivison, R. J., Alexander, D. M., Biggs, A. D., Brandt, W. N., Chapin, E. L., Coppin, K. E. K., Devlin, M. J., Dickinson, M., Dunlop, J., Dye, S., Eales, S. A., Frayer, D. T., Halpern, M., Hughes, D. H., Ibar, E., Kovács, A., Marsden, G., Moncelsi, L., Netterfield, C. B., Pascale, E., Patanchon, G., Rafferty, D. A., Rex, M., Schinnerer, E., Scott, D., Semisch, C., Smail, I., Swinbank, A. M., Truch, M. D. P., Tucker, G. S., Viero, M. P., Walter, F., Weiß, A., Wiebe, D. V., & Xue, Y. Q. 2010, MNRAS, 402, 245
- Kauffmann et al. (2003) Kauffmann, G., Heckman, T. M., Tremonti, C., Brinchmann, J., Charlot, S., White, S. D. M., Ridgway, S. E., Brinkmann, J., Fukugita, M., Hall, P. B., Ivezić, Ž., Richards, G. T., & Schneider, D. P. 2003, MNRAS, 346, 1055
- Kennicutt (1998) Kennicutt, Jr., R. C. 1998, ARA&A, 36, 189
- Kriek et al. (2008) Kriek, M., van Dokkum, P. G., Franx, M., Illingworth, G. D., Marchesini, D., Quadri, R., Rudnick, G., Taylor, E. N., Förster Schreiber, N. M., Gawiser, E., Labbé, I., Lira, P., & Wuyts, S. 2008, ApJ, 677, 219
- Lacy et al. (2004) Lacy, M., Storrie-Lombardi, L. J., Sajina, A., Appleton, P. N., Armus, L., Chapman, S. C., Choi, P. I., Fadda, D., Fang, F., Frayer, D. T., Heinrichsen, I., Helou, G., Im, M., Marleau, F. R., Masci, F., Shupe, D. L., Soifer, B. T., Surace, J., Teplitz, H. I., Wilson, G., & Yan, L. 2004, ApJS, 154, 166
- Le Floc’h et al. (2005) Le Floc’h, E., Papovich, C., Dole, H., Bell, E. F., Lagache, G., Rieke, G. H., Egami, E., Pérez-González, P. G., Alonso-Herrero, A., Rieke, M. J., Blaylock, M., Engelbracht, C. W., Gordon, K. D., Hines, D. C., Misselt, K. A., Morrison, J. E., & Mould, J. 2005, ApJ, 632, 169
- Leitherer et al. (1999) Leitherer, C., Schaerer, D., Goldader, J. D., González Delgado, R. M., Robert, C., Kune, D. F., de Mello, D. F., Devost, D., & Heckman, T. M. 1999, ApJS, 123, 3
- Lonsdale et al. (2004) Lonsdale, C., Polletta, M. d. C., Surace, J., Shupe, D., Fang, F., Xu, C. K., Smith, H. E., Siana, B., Rowan-Robinson, M., Babbedge, T., Oliver, S., Pozzi, F., Davoodi, P., Owen, F., Padgett, D., Frayer, D., Jarrett, T., Masci, F., O’Linger, J., Conrow, T., Farrah, D., Morrison, G., Gautier, N., Franceschini, A., Berta, S., Perez-Fournon, I., Hatziminaoglou, E., Afonso-Luis, A., Dole, H., Stacey, G., Serjeant, S., Pierre, M., Griffin, M., & Puetter, R. 2004, ApJS, 154, 54
- Magnelli et al. (2009) Magnelli, B., Elbaz, D., Chary, R. R., Dickinson, M., Le Borgne, D., Frayer, D. T., & Willmer, C. N. A. 2009, A&A, 496, 57
- Marsden et al. (2009) Marsden, G., Ade, P. A. R., Bock, J. J., Chapin, E. L., Devlin, M. J., Dicker, S. R., Griffin, M., Gundersen, J. O., Halpern, M., Hargrave, P. C., Hughes, D. H., Klein, J., Mauskopf, P., Magnelli, B., Moncelsi, L., Netterfield, C. B., Ngo, H., Olmi, L., Pascale, E., Patanchon, G., Rex, M., Scott, D., Semisch, C., Thomas, N., Truch, M. D. P., Tucker, C., Tucker, G. S., Viero, M. P., & Wiebe, D. V. 2009, ApJ, 707, 1729
- Martin et al. (2005) Martin, D. C., Fanson, J., Schiminovich, D., Morrissey, P., Friedman, P. G., Barlow, T. A., Conrow, T., Grange, R., Jelinsky, P. N., Milliard, B., Siegmund, O. H. W., Bianchi, L., Byun, Y., Donas, J., Forster, K., Heckman, T. M., Lee, Y., Madore, B. F., Malina, R. F., Neff, S. G., Rich, R. M., Small, T., Surber, F., Szalay, A. S., Welsh, B., & Wyder, T. K. 2005, ApJ, 619, L1
- Mazzei et al. (2007) Mazzei, P., Della Valle, A., & Bettoni, D. 2007, A&A, 462, 21
- Miller et al. (2003) Miller, C. J., Nichol, R. C., Gómez, P. L., Hopkins, A. M., & Bernardi, M. 2003, ApJ, 597, 142
- Miller et al. (2008) Miller, N. A., Fomalont, E. B., Kellermann, K. I., Mainieri, V., Norman, C., Padovani, P., Rosati, P., & Tozzi, P. 2008, ApJS, 179, 114
- Morrissey et al. (2007) Morrissey, P., Conrow, T., Barlow, T. A., Small, T., Seibert, M., Wyder, T. K., Budavári, T., Arnouts, S., Friedman, P. G., Forster, K., Martin, D. C., Neff, S. G., Schiminovich, D., Bianchi, L., Donas, J., Heckman, T. M., Lee, Y., Madore, B. F., Milliard, B., Rich, R. M., Szalay, A. S., Welsh, B. Y., & Yi, S. K. 2007, ApJS, 173, 682
- Murphy et al. (2009) Murphy, E. J., Chary, R., Alexander, D. M., Dickinson, M., Magnelli, B., Morrison, G., Pope, A., & Teplitz, H. I. 2009, ApJ, 698, 1380
- Muzzin et al. (2010) Muzzin, A., van Dokkum, P., Kriek, M., Labbe, I., Cury, I., Marchesini, D., & Franx, M. 2010, ArXiv e-prints
- Nordon et al. (2010) Nordon, R., Lutz, D., Shao, L., Magnelli, B., Berta, S., Altieri, B., Andreani, P., Aussel, H., Bongiovanni, A., Cava, A., Cepa, J., Cimatti, A., Daddi, E., Dominguez, H., Elbaz, D., Förster Schreiber, N. M., Genzel, R., Grazian, A., Magdis, G., Maiolino, R., Pérez García, A. M., Poglitsch, A., Popesso, P., Pozzi, F., Riguccini, L., Rodighiero, G., Saintonge, A., Sanchez-Portal, M., Santini, P., Sturm, E., Tacconi, L., Valtchanov, I., Wetzstein, M., & Wieprecht, E. 2010, A&A, 518, L24+
- Norris et al. (2006) Norris, R. P., Afonso, J., Appleton, P. N., Boyle, B. J., Ciliegi, P., Croom, S. M., Huynh, M. T., Jackson, C. A., Koekemoer, A. M., Lonsdale, C. J., Middelberg, E., Mobasher, B., Oliver, S. J., Polletta, M., Siana, B. D., Smail, I., & Voronkov, M. A. 2006, AJ, 132, 2409
- Papovich et al. (2007) Papovich, C., Rudnick, G., Le Floc’h, E., van Dokkum, P. G., Rieke, G. H., Taylor, E. N., Armus, L., Gawiser, E., Huang, J., Marcillac, D., & Franx, M. 2007, ApJ, 668, 45
- Pascale et al. (2008) Pascale, E., Ade, P. A. R., Bock, J. J., Chapin, E. L., Chung, J., Devlin, M. J., Dicker, S., Griffin, M., Gundersen, J. O., Halpern, M., Hargrave, P. C., Hughes, D. H., Klein, J., MacTavish, C. J., Marsden, G., Martin, P. G., Martin, T. G., Mauskopf, P., Netterfield, C. B., Olmi, L., Patanchon, G., Rex, M., Scott, D., Semisch, C., Thomas, N., Truch, M. D. P., Tucker, C., Tucker, G. S., Viero, M. P., & Wiebe, D. V. 2008, ApJ, 681, 400
- Pascale et al. (2009) Pascale, E., Ade, P. A. R., Bock, J. J., Chapin, E. L., Devlin, M. J., Dye, S., Eales, S. A., Griffin, M., Gundersen, J. O., Halpern, M., Hargrave, P. C., Hughes, D. H., Klein, J., Marsden, G., Mauskopf, P., Moncelsi, L., Ngo, H., Netterfield, C. B., Olmi, L., Patanchon, G., Rex, M., Scott, D., Semisch, C., Thomas, N., Truch, M. D. P., Tucker, C., Tucker, G. S., Viero, M. P., & Wiebe, D. V. 2009, ApJ, 707, 1740
- Patanchon et al. (2009) Patanchon, G., Ade, P. A. R., Bock, J. J., Chapin, E. L., Devlin, M. J., Dicker, S. R., Griffin, M., Gundersen, J. O., Halpern, M., Hargrave, P. C., Hughes, D. H., Klein, J., Marsden, G., Mauskopf, P., Moncelsi, L., Netterfield, C. B., Olmi, L., Pascale, E., Rex, M., Scott, D., Semisch, C., Thomas, N., Truch, M. D. P., Tucker, C., Tucker, G. S., Viero, M. P., & Wiebe, D. V. 2009, ApJ, 707, 1750
- Pérez-González et al. (2005) Pérez-González, P. G., Rieke, G. H., Egami, E., Alonso-Herrero, A., Dole, H., Papovich, C., Blaylock, M., Jones, J., Rieke, M., Rigby, J., Barmby, P., Fazio, G. G., Huang, J., & Martin, C. 2005, ApJ, 630, 82
- Pilbratt et al. (2010) Pilbratt, G. L., Riedinger, J. R., Passvogel, T., Crone, G., Doyle, D., Gageur, U., Heras, A. M., Jewell, C., Metcalfe, L., Ott, S., & Schmidt, M. 2010, A&A, 518, L1+
- Pope et al. (2005) Pope, A., Borys, C., Scott, D., Conselice, C., Dickinson, M., & Mobasher, B. 2005, MNRAS, 358, 149
- Pope et al. (2006) Pope, A., Scott, D., Dickinson, M., Chary, R., Morrison, G., Borys, C., Sajina, A., Alexander, D. M., Daddi, E., Frayer, D., MacDonald, E., & Stern, D. 2006, MNRAS, 370, 1185
- Puget et al. (1996) Puget, J.-L., Abergel, A., Bernard, J.-P., Boulanger, F., Burton, W. B., Desert, F.-X., & Hartmann, D. 1996, A&A, 308, L5+
- Ratcliffe et al. (1998) Ratcliffe, A., Shanks, T., Parker, Q. A., Broadbent, A., Watson, F. G., Oates, A. P., Collins, C. A., & Fong, R. 1998, MNRAS, 300, 417
- Ravikumar et al. (2007) Ravikumar, C. D., Puech, M., Flores, H., Proust, D., Hammer, F., Lehnert, M., Rawat, A., Amram, P., Balkowski, C., Burgarella, D., Cassata, P., Cesarsky, C., Cimatti, A., Combes, F., Daddi, E., Dannerbauer, H., di Serego Alighieri, S., Elbaz, D., Guiderdoni, B., Kembhavi, A., Liang, Y. C., Pozzetti, L., Vergani, D., Vernet, J., Wozniak, H., & Zheng, X. Z. 2007, A&A, 465, 1099
- Rieke et al. (2004) Rieke, G. H., Young, E. T., Engelbracht, C. W., Kelly, D. M., Low, F. J., Haller, E. E., Beeman, J. W., Gordon, K. D., Stansberry, J. A., Misselt, K. A., Cadien, J., Morrison, J. E., Rivlis, G., Latter, W. B., Noriega-Crespo, A., Padgett, D. L., Stapelfeldt, K. R., Hines, D. C., Egami, E., Muzerolle, J., Alonso-Herrero, A., Blaylock, M., Dole, H., Hinz, J. L., Le Floc’h, E., Papovich, C., Pérez-González, P. G., Smith, P. S., Su, K. Y. L., Bennett, L., Frayer, D. T., Henderson, D., Lu, N., Masci, F., Pesenson, M., Rebull, L., Rho, J., Keene, J., Stolovy, S., Wachter, S., Wheaton, W., Werner, M. W., & Richards, P. L. 2004, ApJS, 154, 25
- Rodighiero et al. (2010) Rodighiero, G., Cimatti, A., Gruppioni, C., Popesso, P., Andreani, P., Altieri, B., Aussel, H., Berta, S., Bongiovanni, A., Brisbin, D., Cava, A., Cepa, J., Daddi, E., Dominguez-Sanchez, H., Elbaz, D., Fontana, A., Förster Schreiber, N., Franceschini, A., Genzel, R., Grazian, A., Lutz, D., Magdis, G., Magliocchetti, M., Magnelli, B., Maiolino, R., Mancini, C., Nordon, R., Perez Garcia, A. M., Poglitsch, A., Santini, P., Sanchez-Portal, M., Pozzi, F., Riguccini, L., Saintonge, A., Shao, L., Sturm, E., Tacconi, L., Valtchanov, I., Wetzstein, M., & Wieprecht, E. 2010, A&A, 518, L25+
- Rowan-Robinson (2001) Rowan-Robinson, M. 2001, ApJ, 549, 745
- Rowan-Robinson et al. (2008) Rowan-Robinson, M., Babbedge, T., Oliver, S., Trichas, M., Berta, S., Lonsdale, C., Smith, G., Shupe, D., Surace, J., Arnouts, S., Ilbert, O., Le Févre, O., Afonso-Luis, A., Perez-Fournon, I., Hatziminaoglou, E., Polletta, M., Farrah, D., & Vaccari, M. 2008, MNRAS, 386, 697
- Salpeter (1955) Salpeter, E. E. 1955, ApJ, 121, 161
- Santini et al. (2009) Santini, P., Fontana, A., Grazian, A., Salimbeni, S., Fiore, F., Fontanot, F., Boutsia, K., Castellano, M., Cristiani, S., de Santis, C., Gallozzi, S., Giallongo, E., Menci, N., Nonino, M., Paris, D., Pentericci, L., & Vanzella, E. 2009, A&A, 504, 751
- Schlegel et al. (1998) Schlegel, D. J., Finkbeiner, D. P., & Davis, M. 1998, ApJ, 500, 525
- Schulz et al. (2010) Schulz, B., Pearson, C. P., Clements, D. L., Altieri, B., Amblard, A., Arumugam, V., Auld, R., Aussel, H., Babbedge, T., Blain, A., Bock, J., Boselli, A., Buat, V., Burgarella, D., Castro-Rodríguez, N., Cava, A., Chanial, P., Conley, A., Conversi, L., Cooray, A., Dowell, C. D., Dwek, E., Eales, S., Elbaz, D., Fox, M., Franceschini, A., Gear, W., Giovannoli, E., Glenn, J., Griffin, M., Halpern, M., Hatziminaoglou, E., Ibar, E., Isaak, K., Ivison, R. J., Lagache, G., Levenson, L., Lu, N., Madden, S., Maffei, B., Mainetti, G., Marchetti, L., Marsden, G., Mortier, A. M. J., Nguyen, H. T., O’Halloran, B., Oliver, S. J., Omont, A., Page, M. J., Panuzzo, P., Papageorgiou, A., Pérez-Fournon, I., Pohlen, M., Rangwala, N., Rawlings, J. I., Raymond, G., Rigopoulou, D., Rizzo, D., Roseboom, I. G., Rowan-Robinson, M., Sánchez Portal, M., Scott, D., Seymour, N., Shupe, D. L., Smith, A. J., Stevens, J. A., Symeonidis, M., Trichas, M., Tugwell, K. E., Vaccari, M., Valiante, E., Valtchanov, I., Vigroux, L., Wang, L., Ward, R., Wright, G., Xu, C. K., & Zemcov, M. 2010, A&A, 518, L32+
- Serjeant et al. (2008) Serjeant, S., Dye, S., Mortier, A., Peacock, J., Egami, E., Cirasuolo, M., Rieke, G., Borys, C., Chapman, S., Clements, D., Coppin, K., Dunlop, J., Eales, S., Farrah, D., Halpern, M., Mauskopf, P., Pope, A., Rowan-Robinson, M., Scott, D., Smail, I., & Vaccari, M. 2008, MNRAS, 386, 1907
- Shao et al. (2010) Shao, L., Lutz, D., Nordon, R., Maiolino, R., Alexander, D. M., Altieri, B., Andreani, P., Aussel, H., Bauer, F. E., Berta, S., Bongiovanni, A., Brandt, W. N., Brusa, M., Cava, A., Cepa, J., Cimatti, A., Daddi, E., Dominguez-Sanchez, H., Elbaz, D., Förster Schreiber, N. M., Geis, N., Genzel, R., Grazian, A., Gruppioni, C., Magdis, G., Magnelli, B., Mainieri, V., Pérez García, A. M., Poglitsch, A., Popesso, P., Pozzi, F., Riguccini, L., Rodighiero, G., Rovilos, E., Saintonge, A., Salvato, M., Sanchez Portal, M., Santini, P., Sturm, E., Tacconi, L. J., Valtchanov, I., Wetzstein, M., & Wieprecht, E. 2010, A&A, 518, L26+
- Sharp et al. (2006) Sharp, R., Saunders, W., Smith, G., Churilov, V., Correll, D., Dawson, J., Farrel, T., Frost, G., Haynes, R., Heald, R., Lankshear, A., Mayfield, D., Waller, L., & Whittard, D. 2006, in Presented at the Society of Photo-Optical Instrumentation Engineers (SPIE) Conference, Vol. 6269, Society of Photo-Optical Instrumentation Engineers (SPIE) Conference Series
- Silverman et al. (2009) Silverman, J. D., Lamareille, F., Maier, C., Lilly, S. J., Mainieri, V., Brusa, M., Cappelluti, N., Hasinger, G., Zamorani, G., Scodeggio, M., Bolzonella, M., Contini, T., Carollo, C. M., Jahnke, K., Kneib, J., Le Fèvre, O., Merloni, A., Bardelli, S., Bongiorno, A., Brunner, H., Caputi, K., Civano, F., Comastri, A., Coppa, G., Cucciati, O., de la Torre, S., de Ravel, L., Elvis, M., Finoguenov, A., Fiore, F., Franzetti, P., Garilli, B., Gilli, R., Iovino, A., Kampczyk, P., Knobel, C., Kovač, K., Le Borgne, J., Le Brun, V., Mignoli, M., Pello, R., Peng, Y., Montero, E. P., Ricciardelli, E., Tanaka, M., Tasca, L., Tresse, L., Vergani, D., Vignali, C., Zucca, E., Bottini, D., Cappi, A., Cassata, P., Fumana, M., Griffiths, R., Kartaltepe, J., Koekemoer, A., Marinoni, C., McCracken, H. J., Memeo, P., Meneux, B., Oesch, P., Porciani, C., & Salvato, M. 2009, ApJ, 696, 396
- Smail et al. (1997) Smail, I., Ivison, R. J., & Blain, A. W. 1997, ApJ, 490, L5+
- Stern et al. (2005) Stern, D., Eisenhardt, P., Gorjian, V., Kochanek, C. S., Caldwell, N., Eisenstein, D., Brodwin, M., Brown, M. J. I., Cool, R., Dey, A., Green, P., Jannuzi, B. T., Murray, S. S., Pahre, M. A., & Willner, S. P. 2005, ApJ, 631, 163
- Surace et al. (2005) Surace, J. A., Shupe, D. L., Fang, F., Evans, T., Alexov, A., Frayer, D., Lonsdale, C. J., & SWIRE Team. 2005, in Bulletin of the American Astronomical Society, Vol. 37, Bulletin of the American Astronomical Society, 1246–+
- Takeuchi et al. (2009) Takeuchi, T. T., Buat, V., Heinis, S., Giovannoli, E., Yuan, F., Iglesias-Paramo, J., Murata, K. L., & Burgarella, D. 2009, ArXiv e-prints
- Taylor et al. (2009) Taylor, E. N., Franx, M., van Dokkum, P. G., Quadri, R. F., Gawiser, E., Bell, E. F., Barrientos, L. F., Blanc, G. A., Castander, F. J., Damen, M., Gonzalez-Perez, V., Hall, P. B., Herrera, D., Hildebrandt, H., Kriek, M., Labbé, I., Lira, P., Maza, J., Rudnick, G., Treister, E., Urry, C. M., Willis, J. P., & Wuyts, S. 2009, ApJS, 183, 295
- Truch et al. (2009) Truch, M. D. P., Ade, P. A. R., Bock, J. J., Chapin, E. L., Devlin, M. J., Dicker, S. R., Griffin, M., Gundersen, J. O., Halpern, M., Hargrave, P. C., Hughes, D. H., Klein, J., Marsden, G., Martin, P. G., Mauskopf, P., Moncelsi, L., Barth Netterfield, C., Olmi, L., Pascale, E., Patanchon, G., Rex, M., Scott, D., Semisch, C., Thomas, N. E., Tucker, C., Tucker, G. S., Viero, M. P., & Wiebe, D. V. 2009, ApJ, 707, 1723
- Viero et al. (2010) Viero, M. P., Moncelsi, L., Buitrago, F., Marsden, G., Bauer, A. E., Trujillo, I., Conselice, C. J., Pérez-González, P. G., Chapin, E. L., Devlin, M. J., Halpern, M., Mentuch, E., Netterfield, C. B., Pascale, E., Rex, M., Scott, D., Truch, M. D. P., & Wiebe, D. V. 2010, ArXiv e-prints
- Vlahakis et al. (2005) Vlahakis, C., Dunne, L., & Eales, S. 2005, MNRAS, 364, 1253
- Vollmann & Eversberg (2006) Vollmann, K. & Eversberg, T. 2006, Astronomische Nachrichten, 327, 862
- Weiß et al. (2009) Weiß, A., Kovács, A., Coppin, K., Greve, T. R., Walter, F., Smail, I., Dunlop, J. S., Knudsen, K. K., Alexander, D. M., Bertoldi, F., Brandt, W. N., Chapman, S. C., Cox, P., Dannerbauer, H., De Breuck, C., Gawiser, E., Ivison, R. J., Lutz, D., Menten, K. M., Koekemoer, A. M., Kreysa, E., Kurczynski, P., Rix, H., Schinnerer, E., & van der Werf, P. P. 2009, ApJ, 707, 1201
- Wiebe et al. (2009) Wiebe, D. V., Ade, P. A. R., Bock, J. J., Chapin, E. L., Devlin, M. J., Dicker, S., Griffin, M., Gundersen, J. O., Halpern, M., Hargrave, P. C., Hughes, D. H., Klein, J., Marsden, G., Martin, P. G., Mauskopf, P., Netterfield, C. B., Olmi, L., Pascale, E., Patanchon, G., Rex, M., Scott, D., Semisch, C., Thomas, N., Truch, M. D. P., Tucker, C., Tucker, G. S., & Viero, M. P. 2009, ApJ, 707, 1809
- Wolf et al. (2008) Wolf, C., Hildebrandt, H., Taylor, E. N., & Meisenheimer, K. 2008, ArXiv e-prints
- Wolf et al. (2004) Wolf, C., Meisenheimer, K., Kleinheinrich, M., Borch, A., Dye, S., Gray, M., Wisotzki, L., Bell, E. F., Rix, H.-W., Cimatti, A., Hasinger, G., & Szokoly, G. 2004, A&A, 421, 913
- Wyder et al. (2007) Wyder, T. K., Martin, D. C., Schiminovich, D., Seibert, M., Budavári, T., Treyer, M. A., Barlow, T. A., Forster, K., Friedman, P. G., Morrissey, P., Neff, S. G., Small, T., Bianchi, L., Donas, J., Heckman, T. M., Lee, Y., Madore, B. F., Milliard, B., Rich, R. M., Szalay, A. S., Welsh, B. Y., & Yi, S. K. 2007, ApJS, 173, 293