Near-infrared studies of the 2010 outburst of the recurrent nova U Scorpii
Abstract
We present near-IR observations of the 2010 outburst of U Sco. photometry is presented on ten consecutive days starting from 0.59 days after outburst. Such photometry can gainfully be integrated into a larger database of other multi-wavelength data which aim to comprehensively study the evolution of U Sco. Early near-IR spectra, starting from 0.56 days after outburst, are presented and their general characteristics discussed. Early in the eruption, we see very broad wings in several spectral lines, with tails extending up to km s-1 along the line of sight; it is unexpected to have a nova with ejection velocities equal to those usually thought to be exclusive to supernovae. From recombination analysis, we estimate an upper limit of for the ejected mass.
keywords:
infrared: stars - novae, cataclysmic variables - stars : individual (U Sco)1 Introduction
The well known recurrent nova (RN) U Scorpii has undergone at least six previous outbursts, in 1863, 1906, 1936, 1979, 1987 and 1999 and search of archival data resulted in the detection of three additional outbursts, in 1917, 1945 and 1969 (Schaefer, 2010). Its latest outburst, on 2010 January 28.4385 UT, was discovered by B. H. Harris and S. Dvorak (Schaefer et al., 2010b).
The latest outburst was predicted to occur around year (Schaefer, 2005), based on the average brightness and time between eruptions. The binary components of U Sco consist of a massive white dwarf (WD) and a low mass companion in a 1.2305631 day period eclipsing system (Schaefer & Ringwald, 1995). Though the outburst of RNe and classical novae share a common origin in a thermonuclear runaway on a WD surface that has accreted matter from a companion star, an important distinguishing feature in RNe is the smaller amount of accreted mass required and consequently the shorter intervening period to trigger the outburst. Thus RNe are well suited to provide observational inputs and constraints to nova trigger theories (Schaefer, 2005). RNe are also of particular interest as they are possibly progenitors of Type Ia supernovae (Starrfield et al., 1988; Hachisu et al., 1999).
The last three outbursts of U Sco were well studied, especially in the optical (Barlow et al., 1981; Williams et al., 1981; Sekiguchi et al., 1988; Anupama & Dewangan, 2000; Munari et al., 1999; Iijima, 2002). The only major IR study of U Sco was during the 1999 outburst by Evans et al. (2001), who obtained spectra between 2.34 and 27.28 days after outburst. An X-ray study of the super-soft phase was also made by Kahabka et al. (1999) for the 1999 eruption. These studies aimed at determining important physical parameters like the mass of the ejecta, spectral type of the secondary, and estimating the He abundance among other parameters. The present outburst was widely anticipated and a major world-wide multi-wavelength campaign was planned well in advance. As a result extensive data have been collected and preliminary results have been reported in the UV and X-rays from SWIFT (Osborne et al., 2010; Schaefer et al., 2010a; Schlegel et al., 2010a, b) and CHANDRA observations (Orio et al., 2010), in the optical (Anupama, 2010) and the infrared (IR; Ashok, Banerjee & Das, 2010; Das, Banerjee & Ashok, 2010). In this paper we present near-IR spectroscopic and photometric data during the early decline phase. The spectra taken 0.59 days after outburst are the earliest to be recorded for this object in the near-IR.
2 Observations
2.1 Mt. Abu
Near-IR observations were carried out in the bands at the Mt. Abu 1.2m telescope in the early declining phase of the outburst. The comparison star for photometry was SAO 159825 (). Spectra in the wavelength range 1.09–2.2m were obtained from day 0.56 to day 4.55 at a resolution of using a Near-Infrared Imager/Spectrometer with a HgCdTe NICMOS3 array. Spectral calibration was done using OH sky lines and telluric features that register with the stellar spectra. Sco (B1V, K) was chosen as the standard star and observed at similar airmass to U Sco to ensure the ratioing process removes telluric lines. Subsequent reduction of the spectra and processing of the photometric data follow a standard procedure that is described for e.g. in Naik, Banerjee & Ashok (2009). All data reduction was done using IRAF tasks.
2.2 ESO
IR spectroscopy was obtained at the 3.6m New Technology Telescope (NTT), using the SOFI IR spectrograph and imaging camera (Moorwood, Cuby & Lidman, 1998). Data were obtained on days 5.41 and 9.43 using the blue and red low resolution grisms, giving a wavelength coverage of 1–2.5m at . Flux calibration and the removal of atmospheric features was achieved by the dividing the target spectra by the spectra of the standard star HIP 45652 (B9V) on 2010 February 3 (MJD 5230.6). The data were wavelength calibrated using a Xenon lamp. A log of photometric and spectroscopic observations is given in Tables 1 and 2 respectively.
| MJD | (d) | |||
|---|---|---|---|---|
| 5225.5286 | 0.59 | 7.00.01 | 6.72.02 | 6.32.01 |
| 5226.5189 | 1.58 | 8.05.02 | 7.88.05 | 7.33.06 |
| 5227.5402 | 2.60 | 8.72.06 | 8.67.06 | 8.09.04 |
| 5228.5349 | 3.60 | 9.13.12 | 9.38.11 | 8.60.10 |
| 5229.5360 | 4.60 | 9.79.09 | 9.82.10 | 9.27.15 |
| 5230.4666 | 5.53 | 10.24.11 | 10.25.12 | 9.65.08 |
| 5231.4829 | 6.54 | 11.06.20 | 10.61.17 | 9.84.38 |
| 5232.4563 | 7.52 | 11.38.14 | 11.23.24 | 10.23.59 |
| 5233.4805 | 8.54 | 12.11.15 | 12.06.29 | 11.07.33 |
| 5234.4823 | 9.54 | 12.53.21 | 11.97.19 | 11.82.47 |
| MJD | (d) | Site | |||
|---|---|---|---|---|---|
| 5225.4959 | 0.56 | MtA | 120 | 120 | 150 |
| 5226.4820 | 1.54 | MtA | 200 | 180 | 180 |
| 5227.4886 | 2.55 | MtA | – | – | 250 |
| 5228.4850 | 3.54 | MtA | 500 | – | 500 |
| 5229.4845 | 4.55 | MtA | 600 | 500 | 500 |
| 5230.3476 | 5.41 | ESO | 360 | 480 | |
| 5234.3670 | 9.43 | ESO | 720 | 960 |

3 Results
3.1 IR light curves and spectra
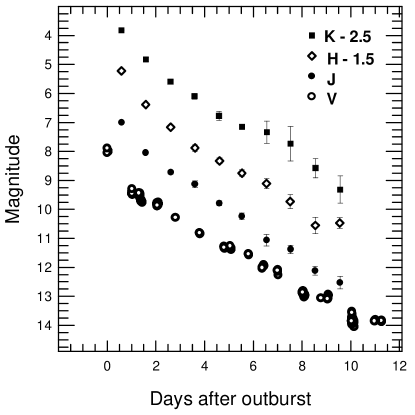
The lighcurves are shown in Fig. 1, along with a matching portion of the optical lightcurve for comparison. The evolution of the near-IR lightcurve is rather similar to the optical. Since sampling is only on a daily basis, we have interpolated between points to obtain mean ( averaged) and times of 2.4 and 4.0 days respectively for the near-IR. However these values are likely to be on the high side as we missed the fast declining stage between time zero to 0.59 days (when our first data point was recorded). For the present outburst, Munari, Dallaporta & Castellani (2010) estimate and days in the band. The distance to U Sco as based on and has been presented in a unified manner by Schaefer (2010) to be 37.7 kpc, but this is superceded by the blackbody distance of the companion star during the total eclipse, which is kpc (Schaefer, 2010).
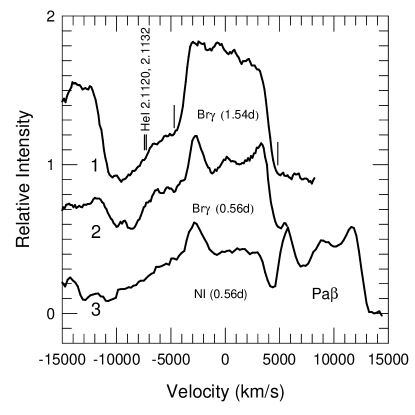
The spectra are presented in Fig. 2. The spectra are similar to those seen in novae outbursts occuring on massive white dwarfs, examples of which are V597 Pup, V2491 Cyg and RS Oph (Naik, Banerjee & Ashok, 2009; Banerjee, Das & Ashok, 2009). The prominent features detected in U Sco are the He i 1.0830m and Pa 1.0938m lines (blended), O i 1.1287m, Pa 1.2818m, He i 2.0581m and the H i Brackett series lines in the band. The Brackett series lines in the band are severely blended due to the large line widths.
A feature at m is likely N i 1.1625, 1.1651m. While this feature also coincides with He ii 1.16296, 1.1676m, we believe that N i is the more the likely: if it is He ii, its strength is expected to increase with time, as the level of ionization and excitation increases. While such behaviour is seen for the He i 1.083 and 2.0581m lines (Fig. 2), it is not seen for the 1.163m feature.
U Sco does not seem to show the presence of prominent carbon lines, and in general C lines are weak in optical spectra during outburst (Barlow et al., 1981; Rosino & Iijima, 1988). Carbon emission is a defining IR signature of novae occurring on CO white dwarfs, with mass M⊙ (the so-called “CO novae”). Typical spectra of CO novae, and their differences from the present spectra, can be seen in the cases of V2274 Cyg (Rudy et al., 2003) and V1280 Sco and V2615 Oph (Das et al., 2008; Das, Banerjee & Ashok, 2009). For example, in V2274 Cyg the C i line at 1.44m (3PD) was comparable in strength with Br but there is no evidence for it in U Sco.
The emission lines are remarkably broad and the H i lines (Pa and Br) consist of a core component and possible broad wings, a detailed discussion of which is given in Section 3.2. The core component has a FWZI in the range of 9 000–10 000 km s-1 for all the prominent lines. A triple-peaked profile is seen in the Pa, Br and He i2.058m lines in the earliest spectra, 0.56 days after outburst which, however, disappears by the next day (Figs 2, 3). Similar triple-peaked (“Batmanesque”) structure was seen in H in early optical spectra (Arai et al., 2010). A triple-peaked profile is also seen in the O i 1.1287m line on 2010 January 28.996 UT, but we caution that the region around this line has low atmospheric transmission and artificial structures can be generated in the profile during spectrum extraction.
The line fluxes for day 0.56 are given in Table 3.
| Line | OI 1.1287 | NI 1.1625,1.1651 | NI 1.2461,1.2470 | P 1.2818 | Br11 1.6806 | HeI 2.0581 | Br 2.1655 |
|---|---|---|---|---|---|---|---|
| Flux ( W cm-2) | 5.80 | 3.43 | 4.50 | 4.10 | 1.50 | 0.59 | 2.25 |
| Uncertainty ( W cm-2) |
3.2 Evidence for high-velocity ejecta
The FWHM of the IR emission lines in the 1999 eruption indicated velocities of km s-1 (Evans et al., 2001) and FWZI of km s-1 over the first 5 days; likewise the FWZI of the Balmer lines were km s-1 in the 1979 (Barlow et al., 1981) and 1999 (Iijima, 2002, data obtained on day 0.65, close to our first spectrum) eruptions. Examination of the Br profile in the 2010 eruption (Fig. 3) shows a core component with a FWZI of . More interesting however is the very extended blueward wing in the profiles for the first 2 days, which extend to about 10 000 km s-1 from the line center. It is not clear whether an equivalent red wing exists for Br, as our spectra do not extend that far redward. For the present we concern ourselves with the 10 000 km s-1 blueward wing.
We first establish that the extended blue wing of Br is genuine and intrinsic to the line by noting that the N i 1.2461, 1.2470m lines, also plotted in Fig. 3, exhibit a similar wing. It is difficult to conclude whether other lines have similar wings. Pa and O i 1.1287m are closely flanked on the blue side by other lines. There may be a wing on He i 2.0581m as there is a small undulation at m, km s-1, for first 2 days (see Fig. 2); a similar “bump” is seen in the 1999 spectrum of Evans et al. (2001). But we again caution that the position of this undulation is in a region of poor atmospheric transmission. Could the wings in Fig. 3 be caused by additional spectral lines? No such line is expected in the case of the N i, but the Br wing is the site of the He i 2.1120, 2.1132m lines. However the expected positions of these He i lines, marked in Fig. 3, are not too well centered with the extended wing. Thus it is unlikely that they contaminate the wing. Additionally the He i 2.1120m line may be expected to be weaker by a factor of at least 20 compared to He i 2.0581m (Benjamin, Skillman & Smits, 1999). Observations of other novae (e.g. RS Oph; Banerjee, Das & Ashok, 2009) strongly support this. However, Fig. 3 shows that the strength of the Br blue wing, especially in the spectrum 0.56 days after outburst, is too strong compared to He i 2.0581m, for it to be caused by the He i 2.1120m line. We thus consider it unlikely that there is any significant presence of He i 2.1120m and conclude that the broad wing is intrinsic to Br and therefore suggestive of material moving at km s-1; even if this represents the line-of-sight velocity of ejected material, it is well in excess of expected ejecta speeds, even for RNe.
It is possible that this material arises in a bipolar flow. Such bipolar flows have been observed in novae (e.g. RS Oph, V445 Pup; Bode et al., 2007; Woudt et al., 2009), and are explained on the basis of ejected material encountering density enhancements in the equatorial (orbital) plane compared to the polar direction; the outflowing material thus expands more freely in the polar direction, leading to high velocity polar flows. Such an outflow would be expected to be perpendicular to the orbital plane and, in the case of U Sco (as it is an eclipsing binary with inclination angle ; Hachisu et al., 2000), close to the plane of the sky. If we assume inclination and opening angle for the jet, the 10 000 km s-1 line-of-sight velocity translates to a space velocity of km s-1. Either way a very fast flow is being witnessed, possibly the fastest seen in any nova eruption.
We note that most of the spectral studies of the 1999 outburst showed the H profile to have similar broad wings. The doubt again arises whether these are intrinsic to the H line or caused by additional lines. For example Iijima (2002), in a spectrum taken 16 hrs after maximum, assigns the N ii line at 6482Å as a possible cause for the extended blue wing of the H profile. However, if it is an intrinsic structure and not really N ii 6482Å which is contributing, then it is seen that the wing extends to about 10 900 km s-1 from the line center (Figure 2 of Iijima, 2002). This is in good agreement with the above discussion, and is supporting evidence for a very fast flow.
3.3 Mass estimate using recombination analysis
In the analysis below we are able to set a useful upper limit on the ejecta mass; an exact determination is difficult due to uncertainty in the conditions in the ejecta, and the range of velocities present. For the recombination analysis we use the data for 2010 February 2.8 (day 5.41); we consider this to be the most favourable epoch, because the lines are more likely to be optically thick at earlier times, while the hydrogen lines for day 9.43 are likely contaminated by He ii Pickering lines, which occur at the same wavelengths as the H i lines. We use the best-defined lines from our data for this epoch, namely Br, Pa and Br11 (1.6806m). The strengths of the other Brackett series lines in the band are difficult to assess because of blending. We assume there is no significant contribution to the strength of these H i lines from the He ii Pickering lines on day 5.41.
We proceed on the assumption that the ejecta are optically thin in the Pa, Br and Br11 lines. It is expected that nova ejecta have density in the range to cm-3 in the early stages. Thus, for example, for cm-3 and K, Case B predicts ratios of 4.76 and 3.8 for Pa/Br and Br/Br 11 respectively. The observed ratios in U Sco for Pa/Br () and Br/Br 11 () are reasonably in agreement with these predictions, although there is no plausible combination of and that has the Pa/Br ratio as low as (the Case B emissivities at cm-3, K are , and erg cm3 s-1 for the Pa , Br and Br 11 lines respectively; Storey & Hummer, 1995). If the lines under consideration are largely optically thick, considerable changes are seen in the ratios (especially in the the Br/Br 11 ratio which can even drop below unity; see Banerjee, Das & Ashok, 2009).
The mass of the emitting gas is given by
where is the distance, the proton mass, the observed flux in a particular line, the corresponding case B emissivity; is the volume of the emitting gas, which is where , and are the filling factor, velocity and time after outburst respectively. We use kpc (Schaefer, 2010), km s-1 (although a range of a factor 2 either side of this value is implied by our data) and values of , and ergs s-1 cm-2 measured for the core components of the Pa , Br and Br11 lines respectively.
The greatest uncertainty in our analysis arises from our ignorance of the electron density and temperature in the ejecta, and from our assumption that Case B applies. If we suppose that and , then the mean (in erg s-1 cm3) is , and (Storey & Hummer, 1995) for Pa, Br and Br11 respectively, where the “error bars” represent the range of values. Over this range of and the Case B ratios for P/Br and Br11/Br range from 4.8 to 8.4, and 2.7 to 4.5 respectively. As already noted, the observed P/Br ratio is less than the lowest value expected for Case B, possibly indicating that Pa may not be optically thin; the mass derived from Pa may therefore be an underestimate. We find M⊙, M⊙ and M⊙, from Pa, Br and Br11 respectively. The errors in , , and the uncertainties in have been added in quadrature, although we recognise that this is not necessarily robust (e.g. the errors are asymmetric (see Barlow, 2003, for a discussion of this point), while the uncertainties in are not in any sense “errors” and are not distributed normally). Our best estimate of the ejecta mass is therefore M⊙ ( M⊙); since we must have that , M⊙.
An alternative estimate of the ejected mass can be provided by free-free (f–f) emission (cf. Evans et al., 2001, who found M⊙). We constructed the SED using magnitudes from AAVSO, our near-IR magnitudes, and reddening in the range 0.2 to 0.56 (Barlow et al., 1981; Hachisu et al., 2000). We have searched for a f–f excess on the first six days, where the errors on the magnitudes are small. Depending on the reddening, blackbody fits with effective temperatures in the range 6 000 – 8 000 K reasonably fit the data. However, while our analysis shows that a f–f excess might be present in the data, especially in the band, it is marginal and difficult to quantify. In view of this we do not use f–f to estimate a mass. Observations at mid-IR wavelengths should reveal any f–f emission as the emissivity is proportional to .
Acknowledgements
The research at PRL is funded by the Dept. of Space, Government of India. We acknowledge with thanks the use of AAVSO data.
References
- Anupama (2010) Anupama G. C., 2010, ATel, 2411
- Anupama & Dewangan (2000) Anupama G. C., Dewangan G. C., 2000, AJ, 119, 1359
- Arai et al. (2010) Arai A., Yamanaka M., Sasada M., Itoh R., 2010, CBET, 2152
- Ashok, Banerjee & Das (2010) Ashok N. M., Banerjee D. P. K., Das R. K., 2010, CBET 2153
- Banerjee, Das & Ashok (2009) Banerjee D. P. K., Das R. K., Ashok N. M., 2009, MNRAS, 399, 357
- Barlow et al. (1981) Barlow M. et al. 1981, MNRAS, 195, 61
- Barlow (2003) Barlow R., 2003, PHYSTAT2003, SLAC, Stanford, California
- Benjamin, Skillman & Smits (1999) Benjamin R. A., Skillman E. A., Smits D. P., 1999, ApJ, 514, 307
- Bode et al. (2007) Bode M. F., Harman D. J., O’Brien T. J., Bond H. E., Starrfield S., Darnley M. J., Evans A., Eyres S. P. S., 2007, ApJ, 665, L63
- Das et al. (2008) Das R. K., Banerjee D. P. K., Ashok N. M., Chesneau O., 2008, MNRAS, 391, 1874
- Das, Banerjee & Ashok (2009) Das R. K., Banerjee D. P. K., Ashok N. M., 2009, MNRAS, 398, 375
- Das, Banerjee & Ashok (2010) Das R. K., Banerjee D. P. K., Ashok N. M., 2010, CBET 2157
- Evans et al. (2001) Evans A., Krautter J., Vanzi L., Starrfield, S., 2001, A&A, 378, 132
- Hachisu et al. (2000) Hachisu I., Kato M., Kato T., Matsumoto K., 2000, ApJ, 528, L97
- Hachisu et al. (1999) Hachisu I., Kato M., Nomoto K., Umeda H., 1999, ApJ, 519, 314
- Iijima (2002) Iijima T., 2002, A&A, 387, 1013
- Kahabka et al. (1999) Kahabka P., Hartmann H. W., Parmar A. N., Neguerruela I., 1999, A&A, 347, L43
- Kato & Hachisu (2003) Kato M., Hachisu I., 2003, ApJ, 587, L39
- Moorwood, Cuby & Lidman (1998) Moorwood, A., Cuby, J. G., Lidman, C. 1998, The ESO Messenger, 91, 9
- Munari et al. (1999) Munari U. et al, 1999, A&A, 347, L43
- Munari, Dallaporta & Castellani (2010) Munari U., Dallaporta, S., Castellani F., 2010, IBVS, 5930
- Naik, Banerjee & Ashok (2009) Naik S., Banerjee D. P. K., Ashok N. M., 2009, MNRAS, 394, 1551
- Orio et al. (2010) Orio M., Nelson T., Luna J., Schaefer B., Page K., Beardmore A., Osborne J., 2010, ATel, 2451
- Osborne et al. (2010) Osborne J. et al., 2010, ATel, 2442
- Rosino & Iijima (1988) Rosino, L., Iijima, T., 1988, A&A, 201, 89
- Rudy et al. (2003) Rudy R. J., Dimpfl W. L., Lynch D. K., Mazuk S., Venturini C. C., Wilson J. C., Puetter R. C., Perry R. B., 2003, ApJ, 596, 1229
- Schaefer & Ringwald (1995) Schaefer B. E. & Ringwald F. A., 1995, ApJ, 447, L45
- Schaefer (2005) Schaefer B. E., 2005, ApJ, 621, L53
- Schaefer (2010) Schaefer B. E., 2010, ApJS, 187, 275
- Schaefer et al. (2010a) Schaefer B. E. et al., 2010a, ATel, 2452
- Schaefer et al. (2010b) Schaefer B. E. et al., 2010b, AJ, in press (arXiv:1004.2842)
- Schlegel et al. (2010a) Schlegel E. M., et al., 2010a, ATel, 2419
- Schlegel et al. (2010b) Schlegel E. M. et al., 2010b, ATel, 2430
- Sekiguchi et al. (1988) Sekiguchi K., Feast M. W., Whitelock P. A., Overbeek M. D., Wargau W., Jones, J. S., 1988, MNRAS, 234, 281
- Starrfield et al. (1988) Starrfield S., Sparks W. M., Shaviv G., 1988, ApJ, 325, L55
- Storey & Hummer (1995) Storey P. J., Hummer D.G., 1995, MNRAS, 272, 41
- Williams et al. (1981) Williams R. E., Sparks W. M., Gallagher J. S., Ney, E. P., Starrfield, S. G., Truran, J. W., 1981, ApJ, 251, 221
- Woudt et al. (2009) Woudt P. A., et al., 2009, ApJ, 706, 738