Observation of magneto-phonon resonance of Dirac fermions in graphite
Abstract
Coherent coupling of Dirac fermion magneto-excitons with an optical phonon is observed in graphite as marked magnetic-field dependent splittings and anti-crossing behavior of the two coupled modes. The sharp magneto-phonon resonance occurs in regions of the graphite sample with properties of superior single-layer graphene having enhanced lifetimes of Dirac fermions. The greatly reduced carrier broadening to values below the graphene electron-phonon coupling constant explains the appearance of sharp resonances that reveal a fundamental interaction of Dirac fermions.
The quest for ultra-high quality graphene, the new celebrated two-dimensional (2D) electron gas geim , is driven by expectations of discoveries of novel physics and applications linked to massless Dirac fermions andrei1 ; kim . A class of quantum coherent effects dictated to the rather weak electron-phonon interaction jun0 ; pisana is linked to the coherent coupling of the particle-hole transitions with optical phonons resonantly tuned by an external magnetic field ando ; falko .
These resonant coupling phenomena (magneto-phonon resonances or MPR) occur when the energy spacing between Landau levels (LLs) is continuously tuned to cross the energy of an optical phonon mode. MPRs have been largely explored in bulk semiconductor materials leadley ; barnes ; johnson , in two-dimensional semiconductor systems and in quantum dots chang ; hameau .
Recent theoretical studies in graphene have suggested that MPR leads to a rich splitting and anti-crossing phenomena of the even parity long wavelength optical mode due to its MPR interactions with excitations across Dirac fermion Landau levels (magneto-excitons) ando ; falko .
The experimental manifestation of the quantum interactions in the MPR relies on a delicate interplay between the lifetimes of Dirac fermion modes and the electron-phonon coupling. A magnetic field tunable anomaly in the optical phonon of graphene has been reported yan ; faugeras . In these works the resolution of the anti-crossing that is the signature of the coherent coupling of electron-phonon modes is impeded by the relatively short lifetimes of the fermion excitations. The manifestation of the sharp MPR requires damping of the Dirac fermion excitations well below the weak electron-phonon coupling. This qualitatively new regime of interacting Dirac Fermion modes has not been achieved so far.
In this letter we demonstrate the coherent mixing of the phonon and the Dirac fermion magneto-exciton mode that is the essence of the MPR. At selected values of the magnetic field we observe the emergence of two distinct modes displaying the characteristic anti-crossing behavior. These observations uncover unprecedented narrow linewidths of Dirac fermion magneto-exciton transitions. The Landau level transition Lorentzian widths of 3.2 meV reported here are about three times smaller than those of previous investigations at similar magnetic fields faugeras ; andrei ; orlita and yield damping values below the graphene electron-phonon coupling constant. Surprisingly, the enhanced Dirac fermion lifetimes required for the observations of the characteristic MPR electron-phonon mode anti-crossings are found in selected regions of graphite.
We show below that our findings can be modeled with a simple coupled mode Hamiltonian describing the mode and sharp magneto-excitons of a graphene layer. The sharp Landau level transitions found in this work and the interpretation in terms of a single-layer graphene model are in line with recent experimental and theoretical studies that suggest the existence of high-quality decoupled graphene flakes in bulk graphite andrei ; potemski ; lopes . In our work the unique areas are identified by the capability to scan regions of the sample within the environment of the magneto-optics experiment. Consistent with this interpretation, our spatially-resolved Raman analysis reveals a large non-uniformity of the graphite sample and areas of the sample where no MPRs are identified (see Supplementary).
The main MPR is found close to 5T and involves the and Landau level transitions of Dirac fermions (Landau levels in the () conduction (valence) band correspond to the positive (negative) integers) as shown in Fig.1a. Representative examples of spectra showing the two coupled modes and are presented in Fig.1c and d together with the magnetic-field evolution of the expected mode anti-crossing behavior (Fig.1 b). The simple coupled mode physics underlying the data enables algebraic extraction of parameters of the interacting system including the Dirac fermion lifetimes.
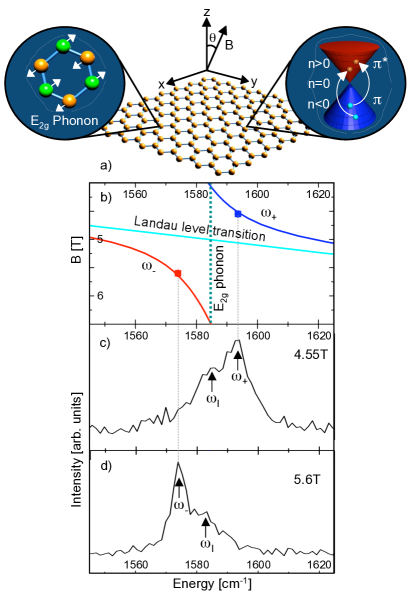
Raman experiments were performed at 2K in a magnetic field up to 14T in a backscattering configuration with a tilt angle of = 20∘ between the magnetic field and the c-axis direction of Kish graphite (Toshiba ceramics) which was deposited onto a substrate (see Fig.1a). A diode-pumped solid-state laser with a 532nm emission line was used as the excitation source and focussed on the sample with a spot size of about and a power of around . The laser spot was moved around on the sample to select regions with optimized MPR responses. We also performed micro-Raman measurements (spatial resolution of ) at room temperature in air on a different piece of the sample which exhibits large spatial variations of the 2D band (see Supplementary).
Figure 2 displays the magnetic-field dependence of the Raman spectra that we obtained on two different spots of the sample. The phonon displays drastically different behavior. In Fig.2a the spectra are very sensitive to the tuning of the magnetic field, while in Fig.2b no changes are observed. This highlights the non-uniformity of the graphite and the presence of regions that behave like single-layer graphene. Further support for this picture comes from the spatially-dependent analysis of the Raman spectra that is reported in the supplementary material section. Behavior similar to that in Fig.2b has been reported and ascribed to the usual Bernal stacked graphite faugeras . Below we will focus on the remarkable data displayed in Fig.2a.
The magnetic-field evolution of the mode energies of these spectra are shown in Fig.2c. Previous studies have observed a phonon energy modulation of about 40 cm-1 using magnetic fields up to 30 Tesla faugeras . Here we found the optical phonon energy is modulated by more than 60 cm-1 with fields less than 6 Tesla, indicating the presence of very high quality Dirac fermions with long lifetimes in the sample.
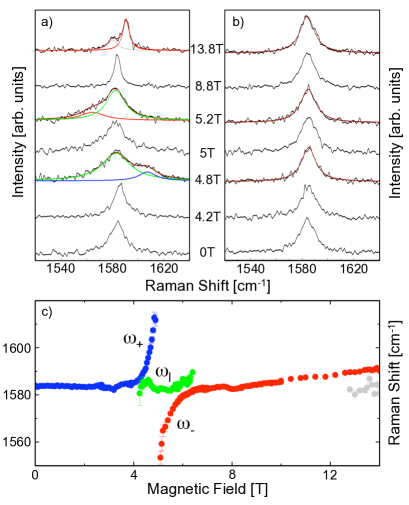
The extreme sensitivity of the spectral lineshape to magnetic field changes seen in Fig.2a suggests the existence of LL transitions that come into and out of resonance with the phonon energy. It is also remarkable that at 6.5 Tesla the phonon becomes extremely sharp, with a width of 4cm-1. To the best of our knowledge this is the narrowest phonon width reported in graphene-related materials.
Electric-field effect studies have shown that a sharp phonon is linked to the absence of resonant electron-hole pair transition states that the lattice vibration can decay into jun0 ; pisana ; ando1 . This indicates that at around 6.5 Tesla no LL transition exists that resonantly interacts with the phonon. It follows that observations of a very sharp phonon have a nontrivial implication on the LL structure of the underlying electronic system. Furthermore, the significant lineshape changes around 5T suggest that a LL transition with large degeneracy comes into resonance with the long wavelength optical phonon. Comparing with current LL studies of graphitic materials toy ; orlita2 ; orlita3 , the transition matches well with the (and ) transitions of Dirac fermions. Based on these considerations we proceed to model the electron system in the MPR anticrossing displayed in Figs. 2a and 2c as Dirac fermions with discrete LL structures charateristic of those in single-layer graphene of high perfection.
Figure 3 shows the detailed evolution of the phonon spectrum. We observe that the lineshape is very asymmetric and the asymmetry changes side when crossing 5 Tesla. As shown, all the asymmetric spectra can be decomposed into two Lorentzian peaks.
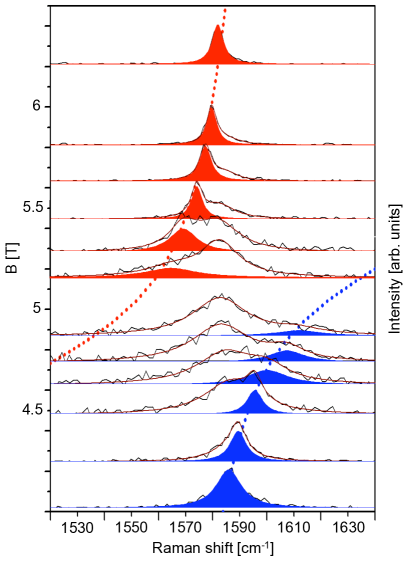
The red and blue modes which we highlight in the figure form a paired behavior at about 5 Tesla. Taking into account the 20∘ angle between the magnetic field and the graphite c-axis, at resonance the field perpendicular to the basal plane is 4.7 Tesla. The resonance condition of the LL transition of Dirac fermions gives meV where is the magnetic length, 196 meV is the phonon energy. This determines the Fermi velocity to be 1.03m/s, in good agreement with studies of Dirac fermions in graphitic materials.
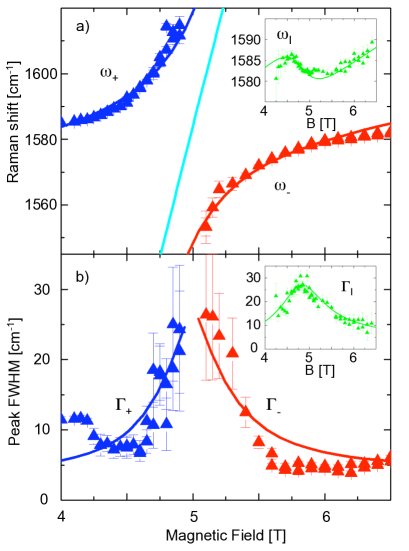
The mode energy and linewidth obtained from the analysis are displayed in Fig.4. The splitting of the two anti-crossing branches asymptotically approaches a large value of 70 cm-1 at the resonance field of 5 Tesla. This is in contrast with results in Fig.2b and the studies reported in Ref.faugeras , in which the impact of the LL transition is seen largely as a weak perturbation that only weakly renormalizes the phonon energy and broadens the phonon Raman peak. In the results shown in Fig.4, the sharpness of the LL transition leads to the strong mixing of the optical phonon with a magneto-exciton, and to the establishment of two distinct new collective modes that have characteristic anti-crossing behavior.
To quantitatively analyze our data, we employ a coupled mode theory that was proposed by Goerbig et al. in Ref.falko where the two coupled normal modes are described as
| (1) |
In the equation, and describe the phonon and magneto-exciton respectively, while is the coupling parameter. To explicitly describe the broadening of the modes, we let , where , , and are energies and half widths of the phonon and magneto-exciton.
At resonance , . The phonon width in the absence of Landau damping into electron-hole pairs is 4cm-1 so . The analysis using data in Fig.4 yields the energy and broadening of the two coupled modes at resonance: and . These experimental data allow us to algebraically determine all the parameters in the coupled mode Hamiltonian: , and .
The value of provides a direct measurement of the electron-phonon coupling strength since it is directly linked to the dimensionless electron-phonon coupling constant ando by where . Using the experimental result , we find . Physically, this coupling strength reflects the modulation rate of the nearest neighbor hopping integral with respect to the stretching of the carbon-carbon bond length and we obtain eV/Å. These values are in reasonable agreement with experiments on monolayer graphene yanssc and epitaxial graphenefaugeras .
The Landau level transition half width of 26cm-1 (roughly 3 meV) is an important indication that the Dirac fermions residing in graphite are of a very high degree of perfection. As a comparison, in epitaxial graphene with a reported mobility of 250,000cm2/(Vs) orlita , the Landau level width at 5 Tesla is about 10meV.
The narrow width less than , a condition not met before, allows for the coherent coupling between the phonon and the fermion excitations leading to the anti-crossing phenomenon seen in our data. The observation of the delicate MPR coherent processes in graphite opens further venues for fundamental optics research on Dirac fermions.
We now briefly discuss the green mode labelled with energy and width displayed in the insets to Fig.4. The behavior of this mode is quite similar to the magnetic oscillations observed in Ref. faugeras . Interestingly, we found that the resonance field of is slightly lower (at 4.8T) than that of the two anti-crossing modes (at 5T). This might indicate disorder-induced Fermi velocity renormalization of graphene. The existence of the the mode is a further indication of sample non-uniformity.
For the magnetic field range below 4 Tesla, magneto-phonon resonance with interband transitions of higher LL indexes are expected. However, we were unable to clearly identify such resonances, possibly due to the smaller LL degeneracy as well as limitations imposed by our signal to noise ratio detection limit.
Starting at about 13 Tesla, the phonon splits again indicating the occurrence of another anti-crossing (Fig.2c). This resonance could be due to the LL transition that is expected at 14.6 Tesla or the transition expected at 29.1 Tesla. Because the resonance is incomplete, we are unable to rule out one or the other unambiguously.
Supplementary materials
Spatially-resolved Raman analysis of the 2D phonon peak in Kish graphite
Kish graphite was deposited on a substrate using the standard micromechanical cleavage method. Spatially-resolved Raman spectroscopy measurements were acquired in ambient conditions. An argon ion laser emitting at 488 nm, used to excite the phonons in the graphite sample, was focused to a spot size of about 0.5 with a power of about 20 mW. The position of the sample was controlled by piezoelectric stages. Visual feedback was provided by a CCD camera, allowing for precise control of the position and focus of the laser on the sample. Raman measurements were obtained every 1 , over an area of 40 , with an acquisition time of one minute.
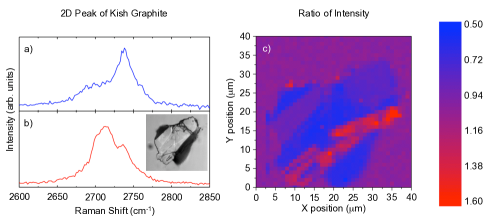
We focus our spatially-resolved investigations on the 2D peak. In fact, the 2D peak of graphite is extremely sensitive to the number of layers present in the sample ferrari ; ferrarissc . It is one of the trademark Raman signatures used to distinguish between single and bilayer graphene ferrari ; ferrarissc . In monolayer graphene, the 2D peak is a single symmetric peak whereas in bilayer graphene the 2D peak can be fitted with four peaks, evidence of the four possible double resonance processes that occur due to the splitting of the valence and conduction bands in the vicinity of the Dirac points ferrari ; ferrarissc ; reich . Analysis of the 2D peak of our sample exhibits variations from the standard graphite peak shown in Fig.5a. The double peak structure shifts from including the more intense peak on the higher energy side to the lower energy side. The lower energy peak component has been shown by Luk yanchuk, et al., to correspond to the single layer 2D peak position luk . The nonuniformity of the 2D peak is a strong indication of the decoupling of the layers leading to areas of the sample with a high contribution of electronically decoupled layers.
The ratio between the intensity of the peak positions of the two components comprising the 2D peak of graphite are plotted as a function of position in Fig.5c. The regions in which the 2D peak corresponds to the characteristic graphite 2D spectrum (Fig.5a) are indicated by the blue areas in Fig.5c. The spectra in which the lower energy component dominates (Fig.5b) are red in Fig.5c. Variations of the intensity of the two peaks is a clear indication of the irregular single layer contribution to the Raman signal.
Acknowledgement The authors would like to thank V. Piazza for assistance in the spatially-resolved measurements. This work is supported by ONR (N000140610138 and Graphene MURI), by NSF (CHE-0641523), and the NYSTAR. P.K. acknowledges support from the FENA MARCO Center. A. P. is supported by NSF (DMR-0803691), and a grant from the Keck Foundation. V.P is supported by a grant of the Ministry of Foreign Affairs (Italy).
References
- (1) A.K. Geim, and K.S. Novoselov, Nature Mater. 6, 183-191 (2007).
- (2) X. Du, et al. Nature 462, 192-195 (2009).
- (3) K.I. Bolotin, et al. Nature 462, 196-199 (2009).
- (4) J. Yan, et al. Phys. Rev. Lett. 98, 166802 (2007).
- (5) S. Pisana, et al. Nature Mater. 6, 198-201 (2007).
- (6) T. Ando, J. Phys. Soc. Jpn. 76, 024712 (2007).
- (7) M.O. Goerbig, et al. Phys. Rev. Lett. 99, 087402 (2007).
- (8) D.R. Leadley, et al. Phys. Rev. Lett. 73, 589-592 (1994).
- (9) D.J. Barnes, et al. Phys. Rev. Lett. 66, 794-797 (1991).
- (10) E.J. Johnson, and D.M. Larsen, Phys. Rev. Lett. 16, 655-659 (1966).
- (11) Y.J. Wang, et al. Phys. Rev. Lett. 79, 3226-3229 (1997).
- (12) S. Hameau, et al. Phys. Rev. Lett. 83, 4152-4155 (1999).
- (13) J. Yan, et al. Bulletin of the American Physical Society, 2009 APS March Meting, Vol. 54.
- (14) C. Faugeras, et al. Phys. Rev. Lett. 103, 186803 (2009).
- (15) G. Li, A. Luican, and E.Y. Andrei Phys. Rev. Lett. 102, 176804 (2009).
- (16) M. Orlita, et al. Phys. Rev. Lett. 101, 267601 (2008).
- (17) P. Neugebauer, et al. Phys. Rev. Lett. 103, 136403 (2009).
- (18) J.M.B. Lopes dos Santos, et al. Phys. Rev. Lett. 99, 256802 (2007).
- (19) T. Ando, J. Phys. Soc. Jpn. 75, 124701 (2006).
- (20) W.W. Toy, M.S. Dresselhaus, and G. Dresselhaus, Phys. Rev. B 15, 4077-4090 (1977).
- (21) M. Orlita, et al. Phys. Rev. Lett. 100, 136403 (2008).
- (22) M. Orlita, et al. Phys. Rev. Lett. 102, 166401 (2009).
- (23) J. Yan, et al. Solid State Commun. 143, 39-43 (2007).
- (24) A.C. Ferrari, et al. Phys. Rev. Lett. 97, 187401 (2006).
- (25) A.C. Ferrari, Solid State Commun. 143, 47-57 (2007).
- (26) S. Reich, S. and C. Thomsen, Phil. Trans. R. Soc. A 362, 2271-2288 (2004).
- (27) I.A. Luk yanchuk, Y. Kopelevich, and M. El Marssi Physica B: Cond. matter 404 404-406 (2009).