The faint end of the galaxy luminosity function in Abell 1689: a steep red faint end upturn at
Abstract
We present a deep and wide luminosity function for galaxies in Abell 1689 () from a mosaic of HST WFPC2 images covering on the side. The main result of this work is the detection of a steep upturn in the dwarf galaxy LF, with . The dwarf to giant ratio appears to increase outwards, but this is because giant galaxies are missing in the cluster outskirts, indicating luminosity segregation. The red sequence LF has the same parameters, within errors, as the total LF, showing that the faint end upturn consists of red quiescent galaxies. We speculate that the upturn is connected to the ‘filling-in’ of the red sequence at and may represent the latest installment of ‘downsizing’ as the least massive galaxies are being quenched at the present epoch.
Subject headings:
galaxies: luminosity function, mass function — galaxies: dwarf — galaxies: clusters: individual (Abell 1689)1. Introduction
The luminosity function (hereafter LF) of galaxies provides a powerful handle to understand galaxy formation and evolution. In the usual Schechter form, the characteristic luminosity may be taken as a measure of the mean luminosity of giant galaxies, while the slope measures the relative abundance of dwarf galaxies. The variation of these two parameters with redshift and environment yields a measure of the growth (in terms of stellar light and mass, although the relationship between these two quantities is not straightforward) of luminous objects and probes the evolution of the dwarf population. As a zeroth order description of galaxy properties, the LF is both an essential ingredient and an important test for models of galaxy formation (e.g., see Bower et al. 2010).
The LF is measured most economically in clusters of galaxies, whose members can be enumerated statistically or distinguished on the basis of their characteristic colors and morphologies. One advantage of clusters is that we may consider their populations to constitute a volume-limited sample of galaxies observed at the same cosmic epoch and in an environment that corresponds to the densest peaks in the dark matter distribution at each epoch. Clusters of galaxies then may represent a snapshot of the evolving galaxy population out to very high lookback times and their LFs allow us to reconstruct the history of galaxy formation.
The observational consensus is that giant galaxies have assembled most of their mass by (De Propris et al., 1999; Andreon, 2006; De Propris et al., 2007; Muzzin et al., 2008) and also have formed their stellar populations rapidly and at (Blakeslee et al., 2003; Mei et al., 2006a, b, 2009). The behavior of dwarf galaxies is however not yet as well understood. In clusters from the ESO Distant Cluster Survey (hereafter EDisCS), De Lucia et al. (2007) find that the red sequence is weaker at lower luminosities, indicating a relative deficit of quiescent dwarf galaxies compared to present-day clusters. This result is still somewhat controversial, with some further studies confirming or even strengthening the observed deficit (e.g., Stott et al. 2007; Gilbank et al. 2008; Hansen et al. 2009) but others finding no evidence for evolution of the faint end of the red sequence (e.g., Andreon 2008, Crawford, Bershady & Hoessel 2009) and arguing that the apparent lack of faint red galaxies may be due to selection effects and/or cluster to cluster variations (cf., the reanalysis of the original Stott et al. 2007 data by Capozzi, Collins & Stott 2010).
The deficit of faint red galaxies in clusters may represent a cluster version of ‘downsizing’: dwarfs may either reside in the cluster blue cloud and migrate to the red sequence once their star formation is quenched, or may be accreted from the general field. Locally, there is evidence that at least some of the fainter dwarfs in the Virgo cluster were forming stars until recently (Jerjen, Kalnajs & Binggeli 2000; Conselice, Gallagher & Wyse 2001; Janz & Lisker 2009), while in the Coma cluster Smith et al. (2009) find that dwarf galaxies span a wide range of ages: however, dwarfs in the cluster core are generally as old as the giants, while a younger population is present in the outskirts, consistent with recent infall from the surrounding field.
Also of importance is the slope of the total LF. Although this is more difficult to measure, it is this quantity that would allow us to answer the question whether the fainter dwarf galaxies are already present in clusters but lie on the blue sequence at the EDisCS epoch, or they have been recently accreted. Determining the total LF slope at high redshift is a more complex proposition, because of the lower contrast against the foreground and background contamination compared to the small color range sampled by the red sequence. This requires deep and wide field observations of several clusters, with homogeneous imaging of ‘blank’ fields to assess the number of contaminating objects statistically, and/or numerous bandpasses to perform photometric redshift analysis.
We have begun a project to determine the evolution of the LF in clusters using archival data from the Hubble Space Telescope (HST): most of the original observations we use were taken to study galaxy lensing and are therefore deep and cover enough area to sample the faint end of the LF even at large distances from the cluster centres. With these data we can exploit HST’s superior photometric performance and stability, small point spread function (especially important for dwarf galaxies), high spatial resolution, and the availability of numerous deep ‘blank’ fields (e.g., COSMOS, EGS, GOODS) to provide a homogeneous set of data (taken under the same conditions) for statistical subtraction of foreground and background galaxies lying along the cluster line of sight.
In Pracy et al. (2004) we applied this method to a wide band mosaic of WFPC2 fields in Abell 2218 and derived a LF down to , showing that the LF slope appears to steepen outwards and that the faintest dwarfs avoid the cluster centre. Harsono & De Propris (2007, 2009) have derived a deep composite LF in six bands for five clusters at and find that the population of dwarf galaxies down to was already present, fully assembled and lying on the red sequence at , but find no faint end upturn. Here we present a study of the faint end of the band (F814W) LF in Abell 1689 () over a field imaged with HST WFPC2. The next section describes the data and photometry, while we present our results and discussion in the following sections. We adopt the WMAP7 cosmological parameters: , and H km s-1 Mpc-1.
2. Data Analysis
The data used in this paper consist of a WFPC2 mosaic of Abell 1689 covering on the sky with exposure times of 1800s in the (F606W) band and 2300s in the (F814W) band. The images were retrieved as fully processed and drizzled files from the HST Legacy Archive (PID: 5993; PI: Kaiser).
In order to determine the LF of cluster galaxies we need to estimate the contribution to the total galaxy counts in the cluster line of sight from galaxies in the field (in the foreground or background). We use the band counts in the COSMOS field (Leauthaud et al., 2007). These counts have similar photometric depth to our data (the exposure times are similar, but the ACS is about a factor of 2 more efficient than WFPC2), cover a large area (1.64 deg2; therefore minimizing the effects of cosmic variance) and are taken in a closely related filter. We therefore expect that we can use these counts to decontaminate our dataset statistically and recover the LF of cluster members.
For consistency, we analyze our data in the same manner as Leauthaud et al. (2007): we run the Sextractor (Bertin & Arnouts, 1996) package twice and with the same parameters as used for the COSMOS field. A first pass with coarse search parameters is used to detect the bright galaxies without deblending them, while a second pass with finer search parameters is used for the faint galaxies. All detections were visually inspected to remove spurious sources, artifacts and especially arclets. All photometry was calibrated to the AB system using published zeropoints. By this approach we are able to use the COSMOS counts for our background removal. In addition, we also measured two aperture magnitudes in and (in an aperture equivalent to 5 kpc) in order to determine the galaxy colors, identify the red sequence, and use this to estimate the red sequence luminosity function. We also measure the ellipticity and position angle of galaxies: these are used for a companion paper on the alignment effect (Hung et al. 2010, in preparation).
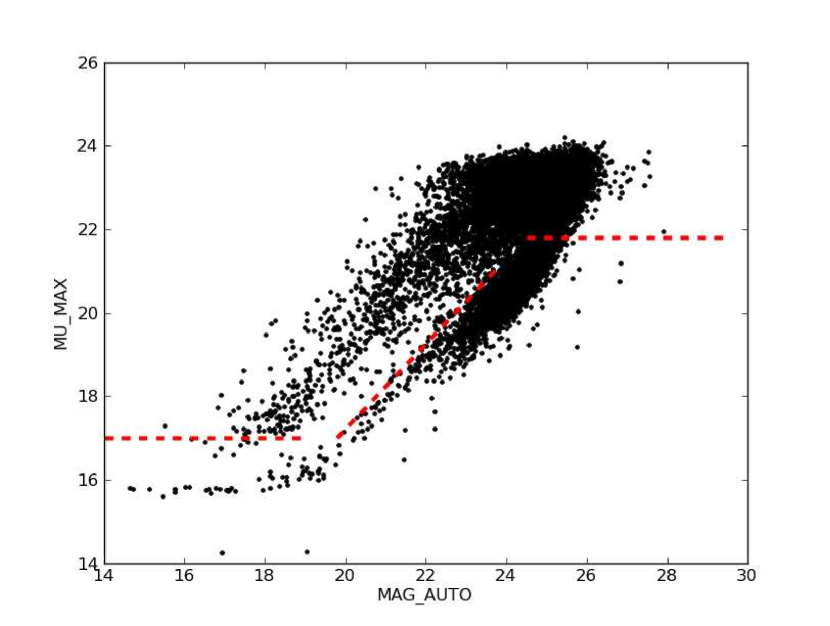
Star-galaxy separation is carried out using the vs. diagram shown in Figure 1 (Leauthaud et al., 2007), where is the central surface brightness of each object. Stars will define a tight sequence in this plot, while galaxies will occupy a cloud of points at lower for a given total luminosity. The adopted discriminant between stars and galaxies is shown in Figure 1. As a check on our method, we determined galaxy counts in the band for the two Hubble Deep Fields (Williams et al., 1996; Casertano et al., 2000) and verified that we obtain good agreement with the COSMOS counts reported by Leauthaud et al. (2007).
3. The Luminosity Functions of Galaxies in Abell 1689
In Figure 2(a) we show the LF of galaxies in Abell 1689 for the entire area covered by the WFPC2 observations. We subtracted the scaled fore/back-ground counts derived from the COSMOS field, assuming Poissonian errors for the galaxy counts and including terms due to clustering errors (as per Huang et al. 1997; Driver et al. 2003). All errors are added in quadrature. It is clear that the data are not a good fit to a standard Schechter function: the LF appears to flatten at intermediate magnitudes and presents a steep rise at faint luminosities. This is similar to the local deep composite LFs for Sloan and RASS clusters observed by Popesso et al. (2006) and to the original claims for a steep faint end upturn of the LF in clusters of galaxies (Driver et al., 1994; De Propris et al., 1995).

Following Popesso et al. (2006), we fit our data with a combination of a Schechter function and a power law:
where , and are the usual Schechter function parameters, is the transition magnitude between the Schechter function and power-law behavior and is the index of the power-law at the faint end. The best fitting values are reported in Table 1. The errors on each parameter are derived by holding each of the other parameters fixed. The table columns are: the region over which the LF is determined, the four parameters that determine its shape (, , , ) and their errors and the dwarf to giant ratio (as defined below). This appears to indicate the presence of a steep upturn in Abell 1689, as earlier found by Wilson et al. (1997) using ground-based data in the band.
The deficit (or otherwise) of faint red galaxies is measured using the dwarf to giant ratio, i.e., the ratio of the numbers of galaxies within specified luminosity intervals. In our case the most appropriate intervals may be defined from the transition magnitude between the Schechter and power-law behavior in the LF. We take ’giants’ to be galaxies with and ’dwarfs’ to be galaxies with and tabulate the derived ratio in Table 1. This is different than the definition used by De Lucia et al. (2007) and others, but allows us to measure the importance of the faint end upturn as a function of cluster-centric radius and may be interpreted as an estimate of the relative strength of the separate dwarf and giant populations, which obey different LFs (e.g., Binggeli, Sandage & Tammann 1988; Lu et al. 2009).
In our previous work Pracy et al. (2004) found a trend for the LF slope to steepen in the outskirts of Abell 2218 (however, there was no prominent upturn as in Abell 1689 and the LF was well fitted by a single Schechter function), with the faintest dwarf galaxies preferentially avoiding the central region. In Figures 2(b) and 2(c) we plot the LFs for galaxies within the region containing 50% of the area surveyed and 50% of the galaxy counts, respectively. These correspond to a cluster-centric radius of 590 and 630 kpc, respectively, or around 20% of the cluster virial radius (). The LF parameters and dwarf to giant ratios for these LFs are tabulated in Table 1. These LFs are consistent with each other and with the presence of a steep upturn.
| Region | D/G ratio | ||||
|---|---|---|---|---|---|
| Entire Field | |||||
| Inner 50% Area | |||||
| Inner 50% Counts | |||||
| Outer 50% Area | |||||
| Outer 50% Counts | |||||
| Red sequence |
In panels 2(d) and 2(e) we show the LFs for the outer 50% area and that containing the remaining 50% of the counts respectively. The areas covered go out to the edge of the observed mosaic (about 1 Mpc for the chosen cosmological parameters or 32% of the virial radius). The brighter galaxies appear to be substantially deficient in these regions and we are only able to fit a power law to galaxies fainter than where we should probe the parameter of the LF in equation 1. The best fit for both these LF has . The derived dwarf to giant ratio is higher (by about a factor of 2) than in the two inner regions. However, the LF slope is shallower than in the central 600 kpc. The increase in the dwarf to giant ratio is therefore due to a relative lack of giants rather than to an increased dwarf contribution, consistent with luminosity segregation.
4. Discussion
We have found a steep upturn in the band LF of Abell 1689 and shown that this upturn extends throughout the inner 600 kpc of this cluster. The LF is steep in this region but becomes shallower in the cluster outskirts. It is now clear that an upward inflection of the LF is common for clusters at (Popesso et al., 2006).
What is the nature of the faint upturn population ? In the clusters surveyed by Popesso et al. (2006) the similarity of LF parameters across the SDSS bands suggests that these galaxies are mostly red. Similarly, the red sequence LF in the lowest redshift bin (, their Fig. 16) in Lu et al. (2009) shows an upturn (although of course their data reach to brighter magnitudes than ours). Abell 1689 hosts a prominent red sequence population (Figure 3). The previous work by Wilson et al. (1997) also finds a steep upturn for this cluster in the V band with similar parameters to those we derive for the band. This suggests that the upturn in Abell 1689 also consists of galaxies on the red sequence.
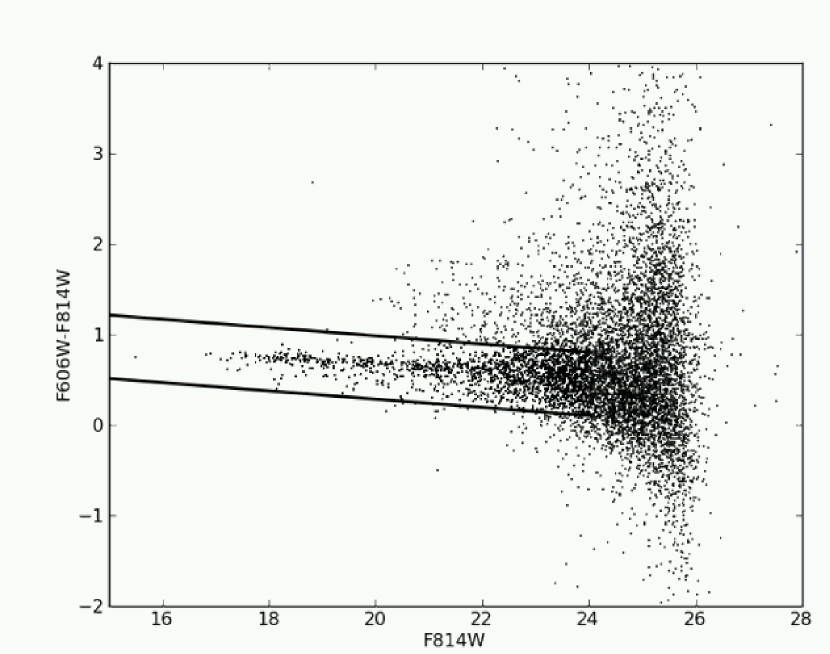
Unfortunately, the COSMOS field has not been imaged with HST in the (F606W) band, although it includes extensive ground based observations. We cannot therefore carry out an appropriate background subtraction in the band or on the color-magnitude relation. Nevertheless, we can check whether the LF on the red sequence is at least consistent with a steep upturn. We fit a straight line to the red sequence and assume that all galaxies within of this ‘ridge-line’ are cluster members. The selection region is shown in Figure 3. Figure 2(f) shows the red sequence LF and best fit; the parameters are tabulated in Table 1. This also shows a steep upturn, with slope and dwarf to giant ratio consistent with the LFs for the entire cluster areas and those within the two central regions. Although this is not corrected for background contamination (which may produce an excessively steep LF), it suggests, together with the concordance between the band LF from Wilson et al. (1997) and ours in the band, that the faint upturn population consists largely of red galaxies.
Additionally, although the dwarf to giant ratio appears to increase outwards, this is due to a reduced contribution from the giant population at large cluster-centric radii rather than from a steep dwarf galaxy LF from newly infalling objects (see the steep LF derived for the general field by Christlein et al. 2009). This suggests that Abell 1689 has experienced luminosity segregation, as observed elsewhere (Andreon, 2002; Mercurio et al., 2003). The faint end of the LF appears to steepen inward, arguing that the red upturn population may already have been present in the cluster (although it might have resided in the blue cloud at earlier epochs), rather than having been accreted from the field. A caveat to this interpretation is the finding by Pracy et al. (2004) that the less luminous galaxies tend to avoid the cluster core, while Harsono & De Propris (2007, 2009) and Riley et al. (2009) also find relatively flat LFs ( ) in the inner of clusters. Of course it is possible that the cluster core is particularly hostile to dwarf galaxies, while these may be abundant immediately outside of the giant-dominated region, and the results may not be inconsistent with our findings.
If we accept the evidence for a deficit of faint red galaxies at from the EDisCS sample and other studies (De Lucia et al. 2007; Gilbank et al. 2008; Hansen et al. 2009, modulo the critiques of Andreon (2008); Crawford et al. (2009)), then a large population of faint dwarfs must have arrived on the red sequence between and at least (Abell 963, the LF in Lu et al. 2009’s Fig. 16). Our data suggest that these dwarf galaxies were already part of the cluster environment and therefore must have had their star formation quenched in the interval.
Lu et al. (2009) conclude that most dwarfs have reached the red sequence at but find little evolution at The best comparison is provided by their LF in their Fig. 6. Lu et al. (2009) find a ‘dip’ at moderate luminosity followed by an upturn. This resembles closely our total LF for Abell 1689 as well as our ‘best-guess’ red LF in Fig. 2(f). According to Lu et al. (2009) the dwarf to giant ratio should increase at lower redshifts, although this is based on a comparison with different data. Abell 1689 itself may not be the best comparison, as it may be more highly evolved (as indicated by the observation of luminosity segregation).
The behavior of the upturn at higher redshifts cannot be determined from Lu et al. (2009), whose data only reach to the LF inflection at . However, if the faint red dwarfs have reached the upturn by and were already present in the cluster (based on the increasing slope in the inner regions), the blue band LF in moderate redshift clusters should be quite steep. Our deep data at – (Harsono & De Propris, 2007, 2009) do not show an upturn, but cluster cores may be hostile to dwarf galaxies.
It is tempting to speculate that the rapid onset of the red sequence and the faint end upturn are connected and that we may be witnessing the epoch of migration (from the blue cloud to the red sequence) of the faintest galaxies, progressing steadily to lower luminosities as we come closer to the present epoch, and eventually producing a red sequence LF resembling the original steep LF expected from CDM models. However, this is ultimately a question that can only be answered by more data: the Multi-Cycle treasury program to carry out multi-wavelength observations of galaxy clusters, other archival data and targeted programs to study the dwarf galaxy evolution in clusters, will provide further clues to this issue.
References
- Andreon (2002) Andreon, S. 2002, A&A, 382, 821
- Andreon (2006) Andreon, S. 2006, A&A, 448, 447
- Andreon (2008) Andreon, S. 2008, MNRAS, 386, 1045
- Bertin & Arnouts (1996) Bertin, E. & Arnouts, S. 1996, A&AS, 117, 393
- Binggeli et al. (1988) Binggeli, B., Sandage, A. & Tammann, G. A. 1988, ARA&A, 26, 509
- Blakeslee et al. (2003) Blakeslee, J. et al. 2003, ApJ, 586, L143
- Bower et al. (2010) Bower, R. G., Vernon, I., Goldstein, M., Benson, A. J., Lacey, C. G., Baugh, C. M., Cole, S. & Frenk, C. S. 2010, arXiv 1004.0711
- Capozzi et al. (2010) Capozzi, D., Collins, C. A. & Stott, J. P. 2010, MNRAS, 403, 1274
- Casertano et al. (2000) Casertano, S. et al. 2000, AJ, 120, 2747
- Christlein et al. (2009) Christlein, D., Gawiser, E., Marchesini, D. & Padilla, N. 2009, MNRAS, 400, 429
- Conselice et al. (2001) Conselice, C. J., Gallagher, J. S. & Wyse, R. F. G. 2001, ApJ, 559, 791
- Crawford et al. (2009) Crawford, S. M., Bershady, M. A. & Hoessel, J. G. 2009, ApJ, 690, 1158
- De Lucia et al. (2007) De Lucia, G. et al. 2007, MNRAS, 374, 809
- De Propris et al. (1995) De Propris, R., Pritchet, C. J., Hartwick, F. D. A. & McClure, R. D. 1995, ApJ, 450, 534
- De Propris et al. (1999) De Propris, R., Stanford, S. A., Eisenhardt, P. R., Dickinson, M. & Elston, R. 1999, AJ, 118, 719
- De Propris et al. (2007) De Propris, R., Stanford, S. A., Eisenhardt, P. R., Dickinson, M. & Rosati, P. 2007, AJ, 133, 2207
- Driver et al. (1994) Driver, S. P., Phillipps, S., Davies, J. I., Morgan, I. & Disney, M. J. 1994, MNRAS, 268, 393
- Driver et al. (2003) Driver, S. P., Odewahn, S. C., Echevarria, L., Cohen, S. H., Windhorst, R. A., Phillipps, S. & Couch, W. J. 2003, AJ, 126, 2662
- Gilbank et al. (2008) Gilbank, D. G., Yee, H. K. C., Ellingson, E., Gladders, M. D., Loh, Y.-S., Barrientos, L. F. & Barkhouse, W. A. 2008, ApJ, 673, 742
- Hansen et al. (2009) Hansen, S. M., Sheldon, E. S., Wechsler, R. H. & Koester, B. P. 2009, ApJ, 699, 1333
- Harsono & De Propris (2007) Harsono, D. & De Propris, R. 2007, MNRAS, 380, 1036
- Harsono & De Propris (2009) Harsono, D. & De Propris, R. 2009, AJ, 137, 3091
- Huang et al. (1997) Huang, J.-S., Cowie, L. L., Gardner, J. P., Hu, E. M., Songaila, A. & Wainscoat, R. J. 1997, ApJ, 476, 12
- Janz & Lisker (2009) Janz, J. & Lisker, T. 2009, ApJ, 696, L102
- Jerjen et al. (2000) Jerjen, H., Kalnajs, A. & Binggeli, B. 2000, A&A, 358, 845
- Leauthaud et al. (2007) Leauthaud, A. et al. 2007, ApJS, 172, 219
- Lu et al. (2009) Lu, T., Gilbank, D., Balogh, M. L. & Bognat, A. 2009, MNRAS, 399, 1858
- Mercurio et al. (2003) Mercurio, A., Massarotti, M., Merluzzi, P., Girardi, M., La Barbera, F. & Busarello, G. 2003, A&A, 408, 57
- Mei et al. (2006a) Mei, S. et al. ApJ, 639, 81
- Mei et al. (2006b) Mei, S. et al. ApJ, 644, 759
- Mei et al. (2009) Mei, S. et al. 2009, ApJ, 690, 42
- Muzzin et al. (2008) Muzzin, A., Wilson, G., Lacy, M., Yee, H. K. C. & Stanford, S. A. 2008, ApJ, 686, 966
- Popesso et al. (2006) Popesso, P., Biviano, A., Böhringer, H. & Romaniello, M. 2006, A&A, 445, 29
- Pracy et al. (2004) Pracy, M. B., De Propris, R., Driver, S. P., Couch, W. J. & Nulsen, P. E. J. 2004, MNRAS, 352, 1135
- Pracy et al. (2005) Pracy, M. B., Driver, S. P., De Propris, R., Couch, W. J. & Nulsen, P. E. J. 2005, MNRAS, 364, 1147
- Riley et al. (2009) Riley, S., Bruursema, J., Ford, H. C., Zekser, K. C., Infante, L. & Postman, M. 2009, BAAS, 41, 23
- Smith et al. (2009) Smith, R. J., Lucey, J. R., Hudson, M. J., Allanson, S. P., Bridges, T. J., Hornschmeier, A. E., Marzke, R. O. & Miller, N. A. 2009, MNRAS, 392, 1265
- Stott et al. (2007) Stott, J. P., Smail, I., Edge, A. C., Ebeling, H., Smith, G. P., Kneib, J.-P. & Pimbblet, K. 2007, ApJ, 661, 95
- Williams et al. (1996) Williams, R. E. et al. 1996, AJ, 112, 1335
- Wilson et al. (1997) Wilson, G., Smail, I., Ellis, R. S. & Couch, W. J. 1997, MNRAS, 284, 915