The Large Magellanic Cloud: A power spectral analysis of Spitzer images
Abstract
We present a power spectral analysis of Spitzer images of the Large Magellanic Cloud. The power spectra of the FIR emission show two different power laws. At larger scales (kpc) the slope is , while at smaller ones (tens to few hundreds of parsecs) the slope is steeper, with a value . The break occurs at a scale pc. We interpret this break as the scale height of the dust disk of the LMC. We perform high resolution simulations with and without stellar feedback. Our AMR hydrodynamic simulations of model galaxies using the LMC mass and rotation curve, confirm that they have similar two-component power-laws for projected density and that the break does indeed occur at the disk thickness. Power spectral analysis of velocities betrays a single power law for in-plane components. The vertical component of the velocity shows a flat behavior for large structures and a power law similar to the in-plane velocities at small scales. The motions are highly anisotropic at large scales, with in-plane velocities being much more important than vertical ones. In contrast, at small scales, the motions become more isotropic.
1 Introduction
The LMC belongs to the de Vaucouleurs classification bin SB(s)m and is kpc away (based on a distance modulus , following Freedman et al. 2001). The LMC is thus an ideal laboratory for studies of both morphology and of turbulence, due to the high spatial resolution possible due to its close proximity. Furthermore, the LMC has relatively little shear, and has no strong spiral arms: the structure of the interstellar medium (ISM) is less affected by density wave shocks.
The study of the morphology of galaxies facilitates our understanding of the physical processes of formation and of secular evolution which forge the distribution of stars, gas, dust, and the like.
Particularly interesting is the study of the spatial structure of the ISM. Atomic hydrogen HI gas is a sensitive tracer of the ISM. Due to the fact that radio observations of nearby galaxies can attain a good spatial and velocity resolution, HI gas distributions may been analysed in terms of power spectral analysis (Crovisier & Dickey 1983, Green 1993, Stanimirovic et al. 1999, Elmegreen et al. 2001, Dutta et al. 2008, 2009a,b).
Another tracer of the structure of the ISM is cold dust, in the form of carbonaceous and silicate grains, at temperatures of K. These grains are the dominant emitters in the FIR. Li & Draine (2001) have extensively modeled COBE/FIR observations of the diffuse ISM in the Milky Way. Li & Draine (2002) focus their attention on the SMC and show that carbonaceous and silicate grains of different sizes dominate the spectra at wavelengths in the range 50 to 400 m. Large ( Å) grains become more important for wavelengths larger than 50 Å, while small carbonaceous grains prevails at shorter wavelengths, where one observes PAH’s lines.
In this study, we present a power spectral study conducted on images of the LMC secured with the Spitzer Space Telescope and MIPS. We analyse images at 24, 70 and 160 m. The longest of these wavelengths traces the dominant component of interstellar matter: cold dust grains. At 70 m the emission arises from both warm and cold dust grains, while at 24 m the emission is from warm dust grains and PAH’s. Cold dust grains are responsible for the extinction in optical images, the scattering of starlight, as well as polarization. It is reasonable to state that in studying emission longward of 60 m, one is investigating the structure of the optical mask itself.
2 Data
The coverage in the MIPS images of the LMC is degrees, with a total integration time of 217 hours. The point source sensitivity estimates for the SAGE survey improve previous surveys of the LMC (such as those with the Infrared Astronomy Satellite IRAS) by three orders of magnitude (Meixner et al. 2006).
At 24 m and 70 m, the images sizes are 8192 8192 pixels, at a scale of 4.98′′ and 4.8′′ per pixel, respectively. At 160 m, the image size is 2048 pixels, at a scale of 15.6′′ per pixel. As far as deprojecting images of the LMC are concerned, there is no unique “center” - the dynamical center of the HI is offset by almost a full degree from the photometric center of the LMC bar (Westerlund 1997). We choose to conduct our deprojections about the dynamical centre of the LMC, which has right ascension and declination (J2000.0), following section 7 in van der Marel et al. (2002). In order to test the robustness of our analysis, we also deprojected the MIPS images about the bar center as opposed to the dynamical center of the LMC; the resulting power spectra are only marginally affected.
3 Analysis
A power spectral calculation is straightforward. In two dimensions, the prescription is as follows;
| (1) |
where is the intensity of each pixel, and and are the conjugate variables to and , respectively. The full 2D power spectra is given by
| (2) |
A 1D PS can be calculated using . Mathematically, this corresponds to take circles in the Fourier space .
4 Results
In Figure 1, the left hand panel shows emission from LMC dust at 160 m. At top right is seen the Fourier space while the power spectrum itself is shown at the lower right of Figure 1.

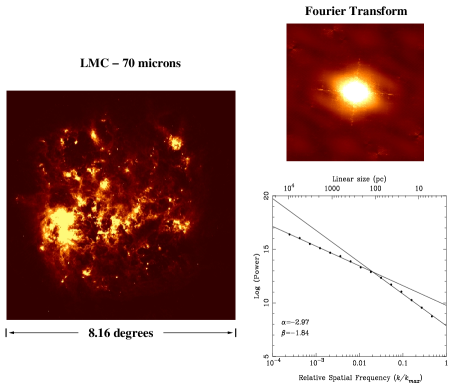
The 2D power spectrum of the LMC at 160 m demonstrates two distinct power laws (see Block et al. 2010 for further details). The steeper least-squares slope at higher spatial frequencies has a value of , while the shallower least-squares slope is . A distinct ‘knee’ or ‘break’ in the power spectrum is seen at approximately 200 parsecs. Figure 2 shows a very similar behaviour – this time for the 70 image. At all three MIPS wavelengths, the knee is found to lie in the interval spanning the pc. The least-square slopes at the three different MIPS wavelengths are similar, but with a slight progression, as follows: at high spatial frequency, the values are , and at 160 m, 70 m and 24 m, respectively, while at low spatial frequency, they are computed to be , and in these three passbands. The implication may mean that cool dust is more diffuse or dispersed than hot dust.
The spatial resolution of the MIPS images allows one to probe structures of dust emission at both small and large physical scales. At small scales (smaller than the disk scale height), the behavior of the power spectra is a 3D one, while for large scales, the PS is more akin to that in 2D. The LMC disk is relatively thin, with a height/size ratio of ; nevertheless, motions do not occur in strictly 2D, as in an infinitely thin 2D sheet.
We have no information on the actual velocities seen in the LMC images, but we believe that two different physical process are acting in the distribution of the ISM at large and small scales. Conceivably, more localized energy sources (from stars, OB associations and SN explosions) should drive 3D motions and contribute to the small scale sector of the power spectrum. In contrast, density-wave and bar-driven streaming motions are often 5 to 10 times faster than the perpendicular motions which produce the disk thickness and which are thus responsible for the 2D behavior of the ISM distribution.

5 Simulations
We have performed high spatial and mass resolution hydrodynamic simulations (up to 0.8 pc and M⊙), to study the properties of the ISM substructure and turbulence of LMC models. We use an AMR (Adaptive Mesh Refinement) software written by Romain Teyssier (see Teyssier 2002). A complete discussion appears in Bournaud et al. (2010); in this present paper, we highlight some details. We initialize an exponential stellar disk containing M⊙, a scalelength of 1.5 kpc and a truncation radius of 3 kpc. A non-rotating bulge ( M⊙) and a halo ( M⊙) are both included. The initial gas disk is exponential, with a scalelength of 3.0 kpc, and a scaleheight of 50 pc (truncated at 500 pc). The total gas mass is M⊙. Initially, the gas is purely rotating, with no macroscopic velocity dispersions. With time, gravity generates turbulence at several scales. For purposes of comparison, we generated two models: with and without the feedback from star formation.
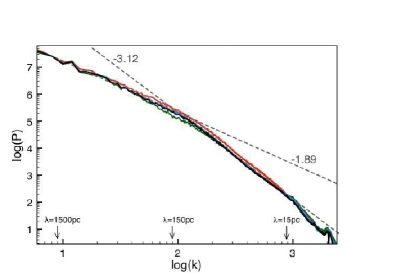
In Fig. 3 we show the power spectra of the gas distribution for the ‘with star formation feedback’ run at times T=254 Myr and at three subsequent times, incremented by 7 Myr. The two slopes are clearly seen, and their values are for large scales, and for small scales. These values agree with those calculated observationally, using the MIPS FIR images above. We have also computed power spectra of the velocities (in-plane and , and vertical ) (seen in Fig. 4). At small scales, all of the PS of velocities have the same slope with a marginal difference in power. At large scales, the motions are strongly non-isotropic, with the power spectra being flat, with less power, compared to in-plane velocities. The latter ones present the same slope at high and low frequencies. This result is significant, because it demonstrates that the vertical component of the velocity behaves very different for high and low spatial frequencies. At high frequencies, the turbulence is more 3D (almost the same power for , , and ). At low frequencies (large scales), however, the motions are 2D (much less power for than for the in-plane velocities). These 2D streams, generated primarily by disk self-gravity – but possibly also by tidal forces from companion galaxies, as in Mastropietro et al. (1999) and from intergalactic ram pressure, as discussed by Tonnesen & Bryan (2009) and by Dutta et al. (2010) – contribute to the low frequency portion of the power spectrum.
6 Conclusions
For the first time, power spectra are presented for emission for dust grains in the LMC. This is facilitated by analysing FIR images at wavelengths of 24, 70, and 160 m from MIPS, on board the Spitzer Space Telescope. The power spectra reveal two distinct power laws in the high and low frequency domain, representing small and large physical scales, respectively. The ‘knee’ or ‘break’ in the power spectra occurs at pc. We interpret this break as the scale height of the dust disk of our closest magellanic neighbor, the LMC, following Elmegreen, Kim, & Staveley-Smith (2001). High resolution AMR simulations of LMC models affirm that the same behavior follows in the power spectra generated from our simulated ISM: simulations confirm the existence of two different power laws, with the ‘break’ occurring at the scale height of the disk. Observations and simulations are in excellent accord. As far as velocity components are concerned, we find that for high frequencies (small scales), the motions are quite isotropic, while at low frequencies, in-plane motions are much more important than vertical ones. These results affirm that the power spectra of the ISM does indeed depend upon the geometry of the system being simulated. At large scales, perturbations create flows akin to those in two dimensions, while at small scales, simulations betray a behavior which is more three dimensional in nature.
Acknowledgements.
IP extends his thanks to the Mexican Foundation Conacyt. He also expresses profound gratitude to the School of Computational and Applied Mathematics at the University of the Witwatersrand, Johannesburg, for their hospitality during his many visits to the University, spanning more than twelve years.References
- (1) Block, D.L., Puerari, I., Elmegreen, B.G., Bournaud, F. 2010, ApJL, submitted
- (2) Bournaud, F., Elmegreen, B.G., Teyssier, R., Block, D.L., Puerari, I. 2010, MNRAS, submitted
- (3) Crovisier, J., Dickey, J.M. 1983, A&A, 122, 282
- (4) Dutta, P., Begum, A., Bharadwaj, S., Chengalur, J.N. 2008, MNRAS, 384, L34
- (5) — 2009a, MNRAS, 397, L60
- (6) — 2009b, MNRAS, 398, 887
- (7) — 2010, arXiv1004.1528
- (8) Elmegreen, B.G., Kim, S., Staveley-Smith, L. 2001, ApJ, 548, 749
- (9) Finkbeiner, D.P., Davis, M., Schlegel, D.J. 1999, ApJ, 524, 867
- (10) Freedman, W.L. et al. 2001, ApJ, 553, 47
- (11) Green, D.A. 1993, MNRAS, 262, 327
- (12) Li, A., Draine, B.T. 2001, ApJ, 554, 778
- (13) Li, A., Draine, B.T. 2002, ApJ, 576, 762
- (14) Mastropietro, C., Burkert, A., Moore, B. 2009, MNRAS, 399, 2004
- (15) Meixner, M. et al. 2006, AJ, 132, 2268
- (16) Stanimirovic, S. et al. 1999, MNRAS, 302, 417
- (17) Teyssier, R. 2002, A&A, 385, 337
- (18) Tonnesen, S., Bryan, G.L. 2009, ApJ, 694, 789
- (19) van der Marel, R.P., Alves, D.R., Hardy, E. & Suntzeff, N.B. 2002, AJ, 124, 2639
- (20) Westerlund, B.E. 1997, The Magellanic Clouds, Cambridge Astrophysics Series, Cambridge University Press