myctr
COMPARATIVE TEST OF TWO METHODS OF QUANTUM EFFICIENCY ABSOLUTE MEASUREMENT BASED ON SQUEEZED VACUUM DIRECT DETECTION
Abstract
We realize and test in experiment a method recently proposed for measuring absolute quantum efficiency of analog photodetectors. Similarly to the traditional (Klyshko) method of absolute calibration, the new one is based on the direct detection of two-mode squeezed vacuum at the output of a traveling wave OPA. However, in the new method one measures the difference-photocurrent variance rather than the correlation function of photocurrents (number of coincidences), which makes the technique applicable for high-gain OPA. In this work we test the new method versus the traditional one for the case of photon-counting detectors where both techniques are valid.
keywords:
quantum optics; absolute calibration; twin-beam squeezed vacuum.1 Introduction
In almost all quantum optic experiments, photodetectors of two types are used: counting detectors, mainly avalanche photodiodes[1] or photomultipliers, capable to detect single photons, and analog ones, basically pin photodiodes working with or without charge integration[2, 3]. These detectors do not resolve single photons but can be used for registering intensity fluctuations. One of the main characteristics of a photodetector is its quantum efficiency (QE). Since the operation principles of counting and analog detectors are different, there are two different definitions of QE. For a counting detector, quantum efficiency is the ratio of the photocount number to the number of photons incident on the detector during a certain period of time. For analog detectors, ”the photocount number” in the previous definition should be replaced by ”the number of registered photoelectrons”. The observed QEs for avalanche photodiodes take values up to 76%[4] while the record QE for counting detectors is 88%[5]. For the best pin diodes, QE is close to 100%. Typically, QE measurements are based on reference sources (black body)[6, 7] or reference detectors (blackbody radiometers)[8]. In the first case the spectral radiation density is determined from the known temperature of the source, in the second one the intensity is determined by the calorimetric measurement of the heat produced by the beam incident on the blackened detector of known absorptivity[9].
1.1 Klyshko method of QE absolute measurement
There is an alternative method of measuring quantum efficiency, which is absolute in the sense that it needs no reference sources or detectors. This method, based on the perfect pairwise correlation of photons produced by spontaneous parametric down-conversion (SPDC),[10, 11, 12, 13, 14, 15, 16, 17, 18, 19] is usually referred to as the Klyshko method of absolute calibration. The key point of the method is measuring the rate of photocount coincidences for two detectors that register signal and idler radiation at the output of an unseeded nondegenerate optical parametric amplifier (NOPA). The detection of a photon in the idler beam guarantees the presence of the photon in the signal one and vice versa. Thus the absence of photodetection in one of the channels and its presence in the conjugate one means that the detector has not registered photon because of its imperfect quantum efficiency. Since numbers of photons in the signal (s) and idler (i) beams are the same and equal to the number of created pairs N,
| (1) |
there will be and photons detected in the signal and idler channels, respectively, with denoting the quantum efficiencies in the signal and idler channels. At the same time, the number of coincidences is
| (2) |
The quantum efficiency of one (tested) detector can be determined as the ratio of the coincidence number and the photocount number in the other (reference) detector:
| (3) |
In experiment the frequency and angular spectrum registered by the reference detector should be obviously covered by all conjugate modes collected by the detector under test (DUT). The numbers of accidental coincidences and unwanted noises (fluorescence, dark noise, etc.) should be also taken into account as[4]
| (4) |
The accuracy of such a measurement reduces when the number of accidental coincidences is high. Therefore, the method works well only at low parametric gain, when the normalized second-order Glauber’s correlation function is much larger than unity and, correspondingly, the number of accidental coincidences is much smaller than the number of the real ones. In Ref. \refciteS.Polyakov, it was tested by means of comparison with another method, using a national primary standard detector scale.
1.2 QE absolute measurement based on registering difference-signal variance
Recently a new universal111This method works at any parametric gain and can be used for the calibration of both counting and analog detectors. calibration method of photodetectors based on the registration of two-mode squeezing at the output of a traveling-wave OPA [21, 22, 23, 24, 25] was suggested [26]. The method is based on the fact that signal and idler beams emitted via PDC are twins in the sense that they have identical photon number fluctuations at any parametric gain. In this context, strong correlations are manifested in the noise reduction of the intensity difference for signal and idler beams below the shot-noise level. Noise Reduction Factor () is used as a quantitative characteristic of two-mode squeezing, which can be measured in the experiment. This value is defined as
| (5) |
where is the difference between photocurrents in the signal and idler detectors and is the sum of the averaged signals (usually giving the Shot Noise Level ). In the case of ideal alignment, does not depend on the parametric gain. It is important that can be also measured by single-photon detectors[27], in which case and should be replaced by and , the difference and sum of the photocount numbers in the signal and idler detectors, and Eq. (5) should be modified to
| (6) |
Similarly to the Klyshko absolute calibration method, the difference-signal method provides the total QE of the optical channel, , where is the QE of the detector itself and is the optical transmission. Under the assumption that the QEs of the signal and idler optical channels are the same, , is only defined by ,
| (7) |
In the case of different quantum efficiencies , calculation shows that Eq. (7) becomes more complicated,
| (8) |
where is the mean number of photons per mode. In the case of small-gain parametric down-conversion, the third term in (8) can be neglected. In the high-gain regime, the difference of losses in the two channels leads to dependence on and to the reduction of the amount of two-mode squeezing[28]. This unbalance of the quantum efficiencies can be canceled by inserting additional losses into one of the channels (7) or by numerical multiplication of the signal in the idler channel by a factor ,
| (9) |
The other condition to be satisfied in the detection of twin-beam squeezing is conjugate multi-mode registration. For PDC radiation, even an infinitely narrow part of the frequency-angular spectrum of the signal beam is correlated with a finite frequency-angular spectrum in the idler beam and vice versa[29, 30]. Any restriction of the registered spectrum leads to the existence of unmatched modes which deteriorate the observable squeezing. Therefore, in order to reduce the contribution of unmatched modes in comparison with the number of conjugate ones the detection volumes should be made as large as possible[30, 28, 31].
This method of the QE measurement has been first applied to the calibration of avalanche photodiode in Ref. \refciteIskhakovJL. Recently it was used for the absolute calibration of a CCD camera[32].
It is interesting to compare the difference-signal method with the coincidence (Klyshko) one because totally different conditions should be satisfied to realize them. For the coincidence method, the number of collected modes and the parametric gain should be small to reduce the number of accidental coincidences. On the contrary, for the difference-signal method, the number of collected modes should be as large as possible and it can be equally applied at any parametric gain. The last feature makes this method universal and allows it to be used for the calibration of both counting and analogue detectors. Therefore, our comparative test of the two methods was performed with counting (single-photon) detectors.
2 Photon-counting detectors and the dead-time effect
It is worth stressing, however, that special measures were to be taken to adapt the difference-signal method to the use with single-photon detectors. An important feature of the latter is the dead-time (DT) effect[33, 34]. Namely, after each photon registration a single-photon detector is unable to register another photon during a certain period of time, called the dead time. This effect restricts the maximum counting rate and therefore influences the photocount statistics. For example, a Poissonian statistics of photons at the input of a counting detector converts to a sub-Poissonian statistics of photocounts at the output. So if there is an n-photon pulse, with the duration smaller than the DT, at the input of a single-photon detector with quantum efficiency , there will be only one “click” at the output, with the probability . For PDC, the probability distribution of photon numbers in signal and idler beams is thermal, but if a large number of modes is registered, photon-number distribution for the whole ensemble is Poissonian, , with the mean photon number . The probability of a photocount is then
| (10) |
Taking into account this formula, as well as the fact that the intensities in the signal and idler beams are absolutely correlated, we find the value of according to (6). Up to the terms linear in the mean photon numbers per pulse in the signal and idler detectors, , the measured value of is
| (11) |
where .
We see that the DT effect can be only negligible at . However, working at extremely low signal levels, such as or less, is technically difficult as it requires large acquisition times. In our experiment, we worked at , and the DT effect had to be taken into account. This was performed by measuring and and then solving Eq. (11) for (only the positive root of the quadratic equation was taken into account).
In the coincidence method, the DT effect leads to the underestimation of both coincidences and singles numbers in Eq. (4). As the reference detector selects much narrower frequency and angular bands than the DUT, its mean number of counts per pulse is usually small (in our case, it was on the order of ), and the denominator in Eq. (4) did not require any DT corrections. At the same time, the DUT mean number of counts per pulse was typically as high as , and its DT effect led to the reduction of the coincidence counting rate. The same simple model as we use to describe the DT effect on the predicts the reduction of measured mean coincidence number per pulse by a value of , where is the mean number of real coincidences per pulse. In all measurements of QE using Eq. (4), this correction was taken into account.
3 Experiment
In the comparative test of the difference-signal method and the coincidence-counting one, we used the experimental setup shown in Fig. 1. PDC was generated in a 3 mm crystal by the third harmonic of a pulsed Nd:YAG laser with the wavelength 355 nm, pulse duration 5 ns, and repetition rate 10kHz. The beam waist diameter in the crystal was mm. The crystal was cut for type-I phase matching and oriented to generate signal and idler radiation at wavelengths 650 nm and 780 nm in the collinear direction. The parametric gain could be varied by rotating the half-wave plate in front of a Glan prism (GP) in the pump beam. In our experiment, it took values of up to , so that the spontaneous regime of PDC was realized. To eliminate the fundamental and second-harmonic radiation, as well as the fluorescence of the optical elements in the pump beam, a dispersive prism in combination with an aperture and an ultraviolet filter (UVG1) were used. Another ultraviolet filter (UVG2) was inserted to eliminate the Glan prism fluorescence. After the crystal, a dichroic mirror UVM and a white-glass filter (WG) cut off the radiation of the pump and transmitted the SPDC radiation. The fluorescence of the crystal was reduced by the red-glass filter RG. Signal and idler beams were separated by a dichroic beamsplitter (DBS) and focused by lenses on the detectors, which were avalanche photodiodes (“Perkin&Elmer” APD 30902S) operating in the Geiger mode with passive quenching. The angular spectrum detected in each channel was restricted by iris apertures (A1, A2) inserted at the outputs of the DBS. All optical elements after the crystal had antireflection coating within the band nm - nm to reduce the losses. The signals from the detectors were processed in the registration part of the setup consisting of two counters (N1, N2) and the coincidence circuit (CC) with the time resolution 4.2 ns. The counters were gated by pulses of duration 30 ns, synchronized with the pump pulses. As a result, the dark count noise was reduced to the level of photons per gate. At the output, the registration system provided the numbers of photocounts from the detectors as well as the numbers of coincidences during each laser pulse. The average photocount number per pulse did not exceed 0.03 but even in this case the DT effect had a certain influence on the method.

Using simple modifications of this setup it was possible to realize both calibration methods for the detector registering idler radiation (at the wavelength nm). To measure QE by the coincidence counting method, in the reference (signal) channel an interference filter was inserted with the bandwidth 10 nm centered at 650 nm (IF 650nm) and the diameter of the A2 aperture was 2 mm. In the channel under test, the aperture size was 8 mm and no filter was inserted. The distance from the crystal to the apertures was 108 cm. The quantum efficiency was determined from Eq. (4), with a correction for the dead-time effect. The number of accidental coincidences was found as[35] , where . To measure the noise in the reference channel, , the orientation of the crystal was changed to eliminate the SPDC.
For the difference-signal method, the aperture diameters in the signal and idler channels were matched to satisfy the transverse phasematching condition for PDC[28]:
| (12) |
As a result, conjugated modes of the signal and idler radiation were registered. In the experiment, the aperture diameters were chosen to be 5 and 6 mm. The QE was calculated with an account for the DT effect, according to Eq. (11).
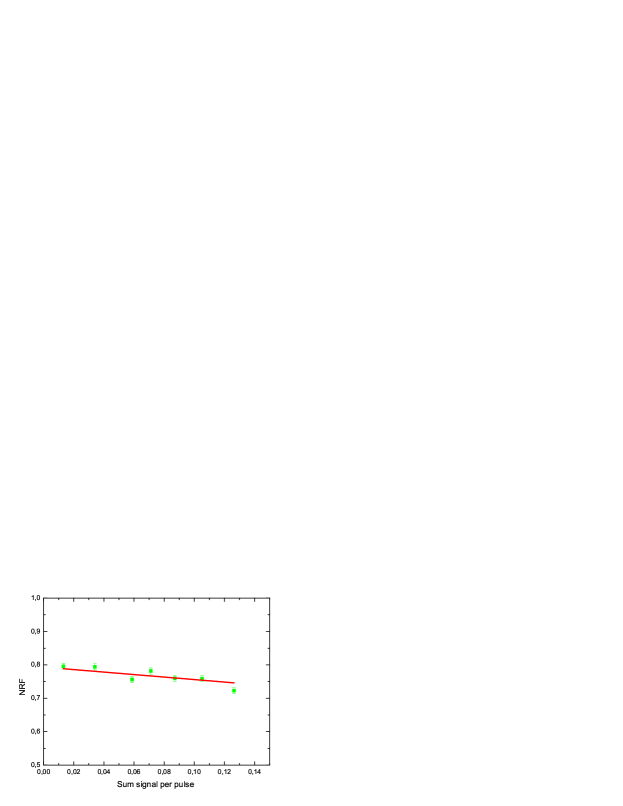
In the first measurement, we checked the validity of Eq. (11) by measuring versus the mean number of photocounts per pulse, which was changed by varying the parametric gain. Dependence of on the sum signal in the two channels is presented in Fig. 2. Since the variance of the difference photon number for SPDC, according to the theory, does not depend on the gain, the observed decrease with the growth of the signal is only due to the DT effect. Solid line is a fit plotted according to (11) with the only fitting parameter . The parameter was measured independently, from the ratio of the signals in the channels.
For the comparison of two calibration methods, QE was measured as a function of the main parameters of the detectors, such as the temperature and the wavelength. In addition, some ‘external’ parameters were added: losses in the optical channel and a strong background noise. All measurements were carried out with the other parameters kept constant. Unless stated otherwise, the temperature of the detector was and the bias voltage was V above the breakdown one. With these parameters fixed, the quantum efficiency was measured by both methods. The resulting values were from the coincidence method and from the difference-signal method, which is in perfect agreement. The averaged value , was used further for plotting the theoretical dependencies.
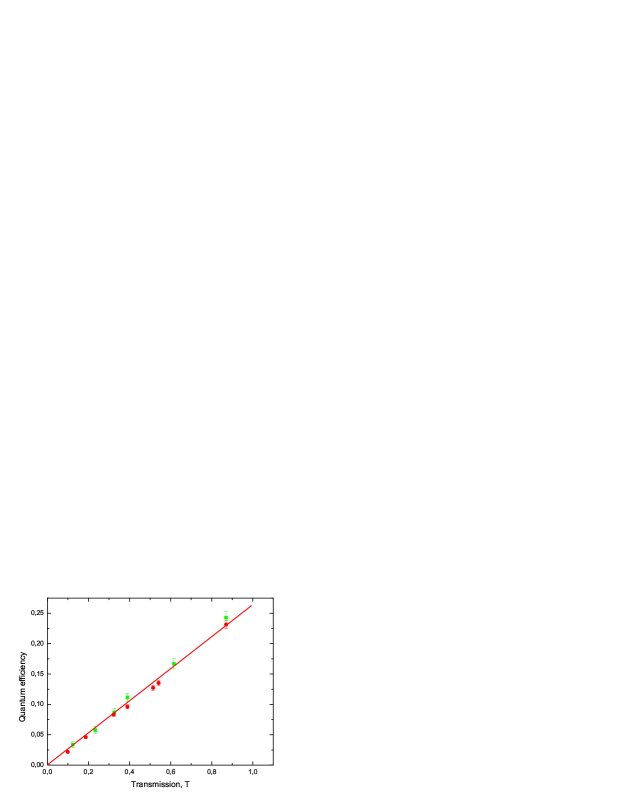
Dependence of the QE on the transmission of the optical channel obtained by the difference-signal method (squares) and the coincidence counting one (circles) is shown in Fig. 3. Variable losses were produced by a polarization filter inserted in front of the DUT. Transmission of the optical channel was estimated using the output DUT signal. Within the limits of accuracy, the measured points are in good agreement with each other. They are also in agreement with the theoretical dependence, , shown in the figure by a solid line.
Dependence of the QE on the temperature is shown in Fig. 4. For each point, the bias voltage was changed to keep the same level over the breakdown voltage, as the latter increases with the temperature. Under these conditions, the datasheets predict no dependence of the QE on the temperature[36]. In good agreement with this, both methods show no temperature dependence (Fig. 4), and the data are in a satisfactory agreement with each other. Solid line shows the expected value of the QE, , for all temperatures.
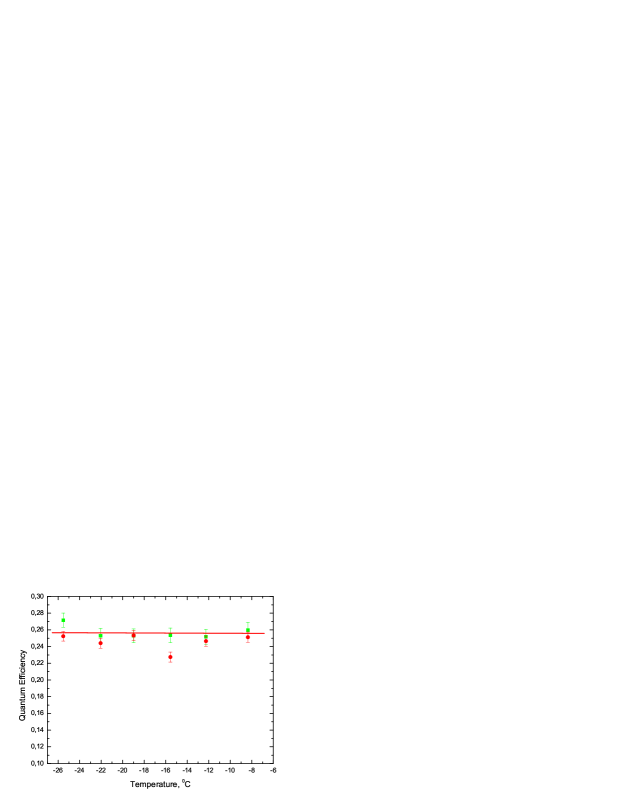
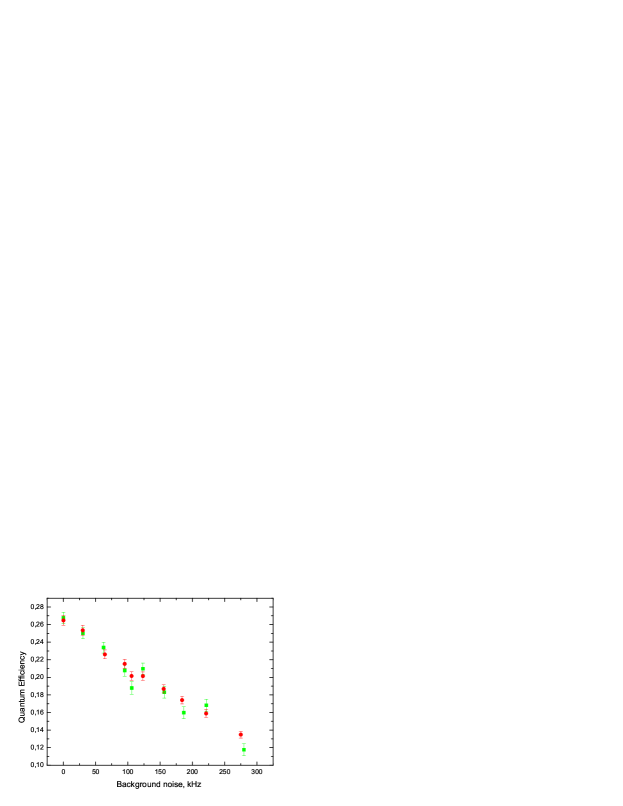
Figure 5 shows the influence of the external continuous noise on the QE measured by two different methods. The external noise reduces the QE due to the DT effect, which leads to the saturation of the detector; the QE measurement is possible since the noise is continuous while the signal is pulsed. A daylight bulb was used as a continuous external noise source. In addition to reducing the QE, the external noise added to the signal measured during -ns gates, but this additional noise was taken into account by making a separate measurement, with the signal eliminated. The external noise radiation was found to be weak enough to be shot-noise limited. Taking into account all this, as well as the fact that the noise and the SPDC radiation are statistically independent, we can write Eq. (6) as
| (13) |
where , and , are the variances of the difference signal and the mean sum signals for PDC and the external noise, respectively. For measuring the QE by the difference-signal method, the values of , were subtracted from the numerator and denominator in the left-hand side of (13). In the coincidence method, the QE value was calculated from (4) taking into account the number of accidental coincidences and the background noise. This dependence is of practical use as it demonstrates the QE reduction and the consequent reduction of the communication speed in systems based on counting detectors. Fig.5 shows a good agreement between the data obtained by both methods.
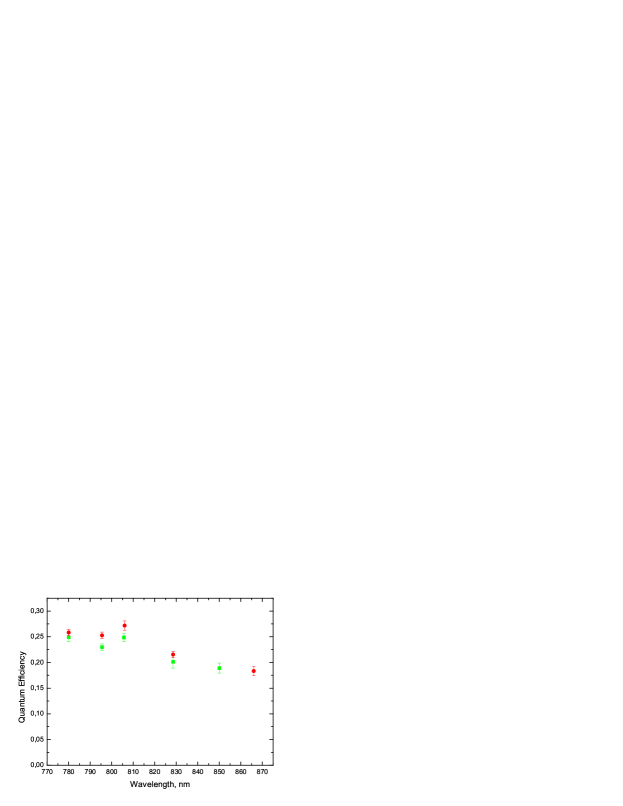
Finally, we have applied the two methods to the measurement of QE spectral dependence. In this case, every point requires a different alignment of the setup. Indeed, the orientation of the crystal should be adjusted each time to provide the phase matching at the corresponding wavelengths. In addition, the difference-signal method implies condition (12), and hence the iris diameters should be chosen different for every point of the spectral dependence. The results of the QE measurement in the range from nm to nm are shown in Fig. 6. For aligning the crystal, a narrowband interference filter was inserted into the reference channel, and then the QE was measured by means of the coincidence method. After that, the filter was removed, the diameters of the irises were set according to Eq. (12), and the QE was measured by means of the difference-signal method. At the wavelength nm, only the coincidence counting method was applied as the dichroic beamsplitter did not well separate the signal and idler beams (transmitted too much of the signal radiation). At nm, the QE was measured only by the difference-signal method because of the absence of the corresponding narrowband filter at the signal wavelength. The measurements by two different methods are in a satisfactory agreement with each other and the data presented in the datasheet[36].
In conclusion, we have tested the recently proposed method of absolute quantum efficiency measurement based on twin-beam squeezing. Our test relied on the comparison between this method and the well-known absolute calibration method based on registering coincidences of photocounts. Since the latter works well only for photon-counting detectors, both methods were realized in a setup with low-gain parametric down-conversion and single-photon detectors. However, measurement of twin-beam squeezing has certain difficulties in the case of single-photon detectors, and one of the results of our work is developing a technique for measuring the difference-signal variance with single-photon detectors. In particular, the dead-time effect in single-photon detectors was taken into account. The obtained results demonstrate both the validity of the method based on the difference-signal variance and its applicability to single-photon detectors. Dependencies of quantum efficiency on the additional losses, wavelength, temperature, and external noise (which influences quantum efficiency due to the dead-time effect) were obtained.
Acknowledgments
This work was supported by the Russian Foundation for Basic Research, grants ## 08-02-00555, 08-02-00741, 10-02-00202. Theoretical help by A. L. Chekhov in taking into account the dead-time effect is gratefully acknowledged.
References
- [1] A. V. Burlakov, C. Novero, A passively quenched avalanche photodiode for single photon detection, R.T.630 (2001).
- [2] H. Hansen, T. Aichele, C. Hettich, P. Lodahl, A. I. Lvovsky, J. Mlynek, S. Schiller, An ultra-sensitive pulsed balanced homodyne detector: application to time-domain quantum measurements, Opt., Lett. 26 (2001) 1714–1716.
- [3] Y. Yamamoto, N. Imoto, S. Machida, Amplitude squeezing in a semiconductor laser using quantum nondemolition measurement and negative feedback,Phys. Rev. A 33 (1986) 3243.
- [4] P. G. Kwiat, A. M. Steinberg, R. Y. Chiao, P. H. Eberhard, M. D. Petroff, High-efficiency single-photon detectors, Phys. Rev. A 48 (1993) R867–R870.
- [5] S. Takeuchi, J. Kim ,Y. Yamamoto, H. H. Hogue, Development of a high-quantum-effciency single-photon counting system, Appl. Phys. Lett. 74 (1999) 1063.
- [6] W. R. Ott, P. Fieffe-Prevost, and W. L. Wiese, VUV Radiometry with Hydrogen Arcs. 1: Principle of the Method and Comparisons with Blackbody Calibrations from 1650Å to 3600Å, Applied Optics 12, Issue 7 (1973) 1618–1629.
- [7] T. E. Ingerson, R. J. Kearney, and R. L. Coulter, Photon counting with photodiodes, Appl. Opt. 22 (1983) 2013–2018.
- [8] J. M. Kendall, Sr. and C. M. Berdahl, Two Blackbody Radiometers of High Accuracy, Appl. Opt. 9, Issue 5 (1970) 1082-1091.
- [9] D. B. Betts, E. J. Gillham, An International Comparison of Radiometric Scales, Metrologia 4, (1968) 101.
- [10] C. Y. Zel’dovich and D. N. Klyshko, Statistics of feld in parametric luminescence, Sov. Phys. JETP Lett. 9 (1969) 40–44.
- [11] D. C. Burnham and D. L. Weinberg, Observation of Simultaneity in Parametric Production of Optical Photon Pairs, Phys. Rev. Lett. 25 (1970) 84–87.
- [12] D. N. Klyshko, Sov. J. Quantum Electron 7 (1977) 591.
- [13] D. N. Klyshko, Use of two-photon light for absolute calibration of photoelectric detectors, Sov. J. Quantum Electron. 10 (1980) 1112–1116.
- [14] A. A. Malygin, A. N. Penin, and A. V. Sergienko, Absolute calibration of the sensitivity of photodetectors using a two-photon field, Sov. Phys. JETP Lett. 33 (1981) 477–480.
- [15] D. N. Klyshko and A. N. Penin, The prospects of quantum photometry, Sov. Phys. Usp. 30 (1987) 716–723.
- [16] A. Migdall, Correlated-Photon Metrology Without Absolute Standards, Phys. Today 52 (1999) 41–46.
- [17] V. M. Ginzburg, N. G. Keratishvili, E. L. Korzhenevich, G. V. Lunev, A. N. Penin, and V. I. Sapritsky, Absolute meter of photodetector quantum efficiency based on the parametric down-conversion effect, Opt. Eng. 32 (1993) 2911–2916.
- [18] G. Brida, M. Genovese, and C. Novero, An application of two photon entangled states to quantum metrology, J. Mod. Opt. 47 (2000) 2099–2104.
- [19] G. Brida, M. Genovese, M. Gramegna,Twin-photon techniques for photo-detector calibration, Laser Physics Letters 3 no. 3 (2006) 115–123.
- [20] S. V. Polyakov and A. L. Migdall, High accuracy photon-counting detector calibration and independent verification of a correlated-photon calibration technique, Optics Express 15, Issue 4 (2007) 1390–1407.
- [21] O. Jedrkiewicz, Y.-K. Jiang, E. Brambilla, A. Gatti, M. Bache, L. A. Lugiato, P. Di Trapani, Detection of sub-shot-noise spatial correlations in high-gain Parametric Down Conversion, Phys. Rev. Lett. 93 (2004) 243601.
- [22] M. Bondani, A. Allevi, G. Zambra, M. G. A. Paris, A. Andreoni, Sub-shot-noise photon-number correlation in mesoscopic twin-beam of light, Phys. Rev. A 76 (2007) 013833.
- [23] T. Sh. Iskhakov, M. V. Chekhova, G. Leuchs, Generation and direct detection of broadband mesoscopic polarisation-squeezed vacuum, Phys. Rev. Lett. 102 (2009) 183602.
- [24] J.-L. Blanchet, F. Devaux, L. Furfaro, and E. Lantz, Measurement of Sub-Shot-Noise Correlations of Spatial Fluctuations in the Photon-Counting Regime, Phys. Rev. Lett. 101 (2008) 233604.
- [25] G. Brida, L. Caspani, A. Gatti, M. Genovese, A. Meda, and I. Ruo-Berchera, Measurement of Sub-Shot-Noise Spatial Correlations without Background Subtraction, Phys. Rev. Lett. 102 (2009) 213602.
- [26] G. Brida, M. Genovese, I. Ruo-Berchera, M. V. Chekhova, and A. N. Penin, Possibility of absolute calibration of analog detectors by using parametric downconversion: a systematic study, JOSA B 23, Issue 10 (2006) 2185–2193; G. Brida, M. Chekhova, M. Genovese, A. Penin, M.L. Rastello and I. Ruo-Berchera, Absolute calibration of analog detectors by using parametric down conversion, IEEE Trans. I.&M. 56 (2007) 275; G. Brida, M. Chekhova, M. Genovese, I. Ruo-Berchera, Analysis of the possibility of analog detectors calibration by exploiting stimulated parametric down conversion, Optics Express 16 (2008) 12550–12558; G. Brida, M. Chekhova, M. Genovese, M.L. Rastello, I. Ruo-Berchera, Absolute calibration of Analog Detectors by using Stimulated Parametric Down Conversion, Journal of Modern Optics 56 (2009) 401–404.
- [27] T. Sh. Iskhakov, E. D. Lopaeva, A. N. Penin, G. O. Rytikov, and M. V. Chekhova, Two Methods for Detecting Nonclassical Correlations in Parametric Scattering of Light, JETP Lett. 88 (2008) 660–664.
- [28] I. N. Agafonov, M. V. Chekhova, G. Leuchs, Two-Color Bright Squeezed Vacuum, Phys. Rev. A, to appear (2010).
- [29] E. Brambilla, A. Gatti, M. Bache, and L. A. Lugiato, Simultaneous near-feld and far-feld spatial quantum correlations in the high-gain regime of parametric down-conversion, Phys. Rev. A 69 (2004) 023802.
- [30] G. O. Rytikov and M. V. Chekhova, Detection of two-mode compression and degree of entanglement in continuous variables in parametric scattering of light, Jetp 134, No. 6 (2008) 1082–1092.
- [31] I. Agafonov, M. Chekhova, T. Iskhakov and G. Leuchs, Multimode Detection of Broadband Squeezed Vacuum,Proceedings of NATO Advanced Research Workshop Quantum Cryptography and Computing: Theory and Implementation’, Gdansk, Poland, 9–12 September (2009).
- [32] G. Brida, I. Degiovanni, M. Genovese, M. Rastello, I. Ruo-Berchera, Detection of multimode spatial correlation in PDC and application to the absolute calibration of a CCD camera, arXiv 1005.2937.
- [33] L. Mandel, Inversion problem in photon counting with dead time, JOSA 70, Issue 7 (1979) 873–874.
- [34] J. Sabol, Dead-time Corrections and Effects of Dead-Time on the Counting Statistics of G-M Counters Used in Mixed Neutron-Gamma Radiation Dosimetry, Radiation Protection Dosimetry 23, Issue 1-4 (1988) 445–447.
- [35] O. A. Ivanova, T. Sh. Iskhakov, A. N. Penin, M. V. Chekhova, Multiphoton correlations in parametric down-conversion and their measurement in the pulsed regime,Quantum Electronics 36, Issue 10 (2006) 951–956.
- [36] Product data sheets C30902E, C30902S, C30921E, C30921S, PerkinElmer Optoelectronic.