A Universal Scaling Law for the Fractal Energy Dissipation Domain in Self-Organized Criticality Systems
Abstract
Nonlinear dissipative systems in the state of self-organized criticality release energy sporadically in avalanches of all sizes, such as in earthquakes, auroral substorms, solar and stellar flares, soft gamma-ray repeaters, and pulsar glitches. The statistical occurrence frequency distributions of event energies generally exhibit a powerlaw-like function with a powerlaw slope of . The powerlaw slope of energies can be related to the fractal dimension of the spatial energy dissipation domain by , which predicts a powerlaw slope for area-rupturing or area-spreading processes with . For solar and stellar flares, 2-D area-spreading dissipation domains are naturally provided in current sheets or separatrix surfaces in a magnetic reconnection region. Thus, this universal scaling law provides a useful new diagnostic on the topology of the spatial energy dissipation domain in geophysical and astrophysical observations.
1 INTRODUCTION
The statistics of catastrophic events in geophysics (e.g., earthquakes, landslides, forest fires) as well as in astrophysics (e.g., auroral substorms, solar and stellar flares, pulsar glitches) is generally quantified in a log-number versus log-size histogram, which often exhibits a powerlaw-like function, also called occurrence frequency distribution. The most widely known example is the distribution of earthquakes magnitudes, which has a powerlaw slope of for the differential frequency distribution (Turcotte 1999), the so-called Gutenberg-Richter (1954) law. Bak, Tang, and Wiesenfeld (1987, 1988) introduced the theoretical concept of self-organized criticality (SOC), which has been initially applied to sandpile avalanches at a critical angle of repose, but has been generalized to nonlinear dissipative systems that are driven in a critical state. Comprehensive reviews on this subject can be found for applications in geophysics (Turcotte 1999), solar physics (Charbonneau et al. 2001), and astrophysics (Aschwanden 2010).
Hallmarks of SOC systems are the scale-free powerlaw distributions of various event parameters, such as the peak energy dissipation rate , the total energy , or the time duration of events. While the powerlaw shape of the distribution function can be explained by the statistics of nonlinear processes that have an exponential growth phase and saturate after a random time interval (e.g., Willis and Yule 1922; Fermi 1949; Rosner and Vaiana 1978; Aschwanden et al. 1998), no general theoretical model has been developed that predicts the numerical value of the powerlaw slope of SOC parameter distributions. Simple analytical models that characterize the nonlinear growth phase with an exponential growth time and the random distribution of risetimes with an average value of , predict a powerlaw slope of for the peak dissipation rate (e.g., Rosner and Vaiana 1978; Aschwanden et al. 1998), but observations of the time scales and require time profiles with an exponentially-growing risetime, which can reliably be determined in simple single-peak events only, while larger events often show complex multi-peak time profiles. Moreover, an estimate of the powerlaw slope of energies requires an additional relationship between the peak energy dissipation rate and the total energy . An alternative theoretical explanation for a slope was put forward by a dimensional argument (Litvinenko 1998), which can be derived from the definition of the kinetic energy of convective flows with mass , length scale , and time scale . Note, that this dimensional argument predicts a unique fixed value and presupposes kinetic motion for an energy dissipation process. In this Letter we propose a more general concept where the powerlaw slope of the energy distribution depends on the fractal geometry of the energy dissipation domain of SOC events.
2 THEORETICAL CONCEPT
We aim for a universal statistical model of nonlinear energy dissipation processes in systems that operate in a state of self-organized criticality. We start with the spatial structure of nonlinear energy dissipation domains. Let us consider a system with volume that is subject to continuous energy input. Examples are sandpiles (on which sand is steadily dropped), the Earth crust (which is sheared by tectonic plates), or the solar corona (to which magnetic energy emerges, generated by the solar dynamo from the interior). Once such a system is in a state of self-organized criticality, the steadily stored energy is sporadically dissipated in small or large catastrophic events, such as in form of sandpile avalanches, earthquakes, or solar flares. In the statistical average we may assume that the energy input is homogeneously distributed throughout the volume that is susceptible to energy dissipation, while energy dissipation processes occur randomly at different places and times, with a time-averaged energy dissipation rate that matches the average energy input rate. However, the size or magnitude of individual dissipation events is unpredictable and affects an arbitrary subvolume . The subvolume affected in an energy dissipation event depends very much on the propagation characteristics of the instability that triggers the catastropic energy dissipation event. A lightening may propagate mostly along a 1-dimensional (1-D) path, snow avalanches may spread over a 2-dimensional (2-D) area, earthquakes may spread along 2-D tectonic plates, solar flares may propagate along 2-D separatrix surfaces in magnetic reconnection regions, or a fire may spread in a 3-dimensional (3-D) volume wherever flammable material is available. We may characterize the volume affected in a nonlinear energy dissipation domain with a fractal dimension as function of the length scale ,
where denotes the volumetric fractal dimension , e.g., as defined by the Hausdorff dimension. Assuming a constant energy density in the time average, the total released energy is than proportional to the fractal volume,
Energy dissipation events can have all possible spatial sizes up to the maximum length scale of the system. Considering the probability of fragmentation into larger or smaller scales, the statistical ratio between different size scales must be reciprocal to the volume in the time average, if energy balance is required between the time-averaged input rate and the time-averaged dissipation rate. This simple volume fragmentation rule directly yields the probability or occurrence frequency distribution of released energies (using Eq. 2),
We see that the assumption of a fractal dimension automatically leads to a powerlaw distribution of energies, at least over some range of sizes (i.e., the inertial range), which is one of the hallmarks of systems with self-organized criticality. This simple statistical argument let us predict the following energy distributions for the three integer fractal dimensions , (but the fractal dimension can also take any non-integer value in the range of ),
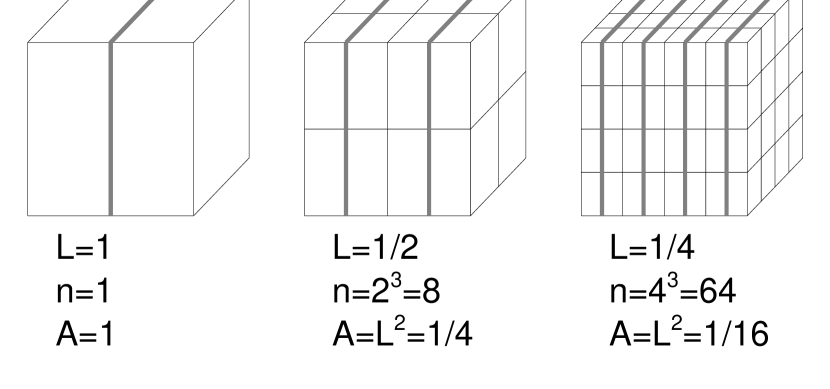
For example, dissipation events with a 1-D propagation path (e.g., lightenings) are expected to produce frequency distributions of , while events with 2-D propagation paths (e.g., tectonic plates, magnetic separator surfaces) are expected to produce distributions of . In the following we concentrate mostly on the latter case with area-like propagation characteristics, which is known in geophysics as the type of area rupture process (e.g., Turcotte 1999). The spatial fragmentation law is visualized in Fig. 1 for a cartesian geometry of a cube with volume , which is divided into length scales of , where the area rupture in each subcube scales as , and the number of subcubes is . If the released energy is proportional to the area, , the released energy per cube is , and the resulting occurrence frequency distribution has then the powerlaw slope .
Frequency distributions of energies, or proxy parameters of the energy, are measured for a substantial number of phenomena associated with nonlinear dissipative systems in the state of self-organized criticality, which generally display a powerlaw-like distribution function over some inertial range,
If we set the observed distribution function (Eq. 5) equal to the theoretical model (Eq. 3), we obtain from the observable powerlaw slope a diagnostic of the fractal dimension of the propagation characteristics of the energy release process,
For instance, if a powerlaw distribution of is observed, we expect a space-filling or Euclidian propagation characteristics (), such as a diffusion-like or fractional Brownian motion process (which, however, is not a SOC process). Powerlaws with are expected to have area-like rupturing or spreading characteristics (), while powerlaws with are expected to have linear propagation characteristics (). Thus, the observed frequency distributions convey fundamental information on the fractal geometry of the energy dissipation domain.
3 DISCUSSION
In the following we compile measurements of observed occurrence frequency distributions of energies in SOC phenomena, or proxy parameters of energies. We quote only measurements that refer to the total energy of a SOC event, such as the thermal, nonthermal, magnetic, or kinetic energy, or the time-integrated radiative output in time profiles (i.e., the time-integrated counts or fluence) in astrophysical observations. Table 1 lists the SOC phenomena, the observed powerlaw slopes of energy parameters, and the fractal dimension inferred with Eq. (6). We briefly discuss the results in the following.
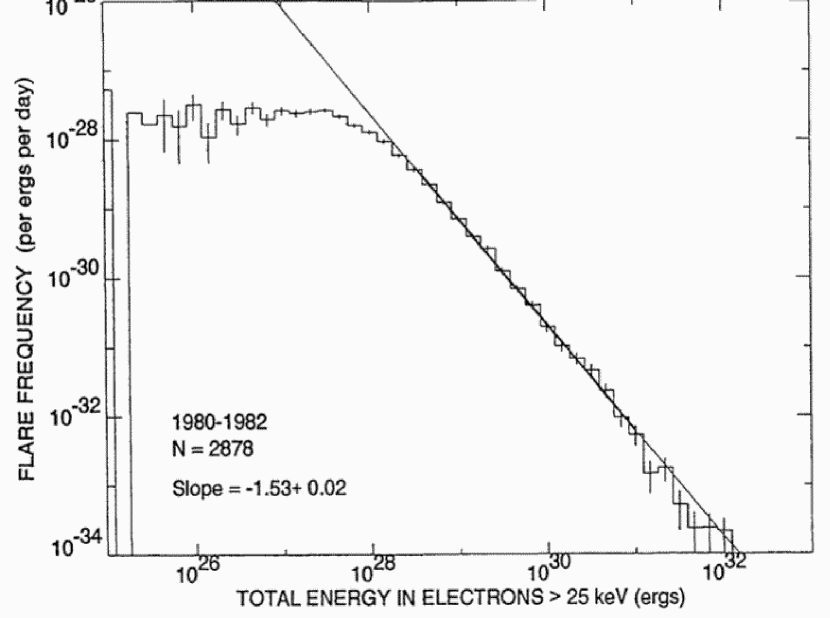
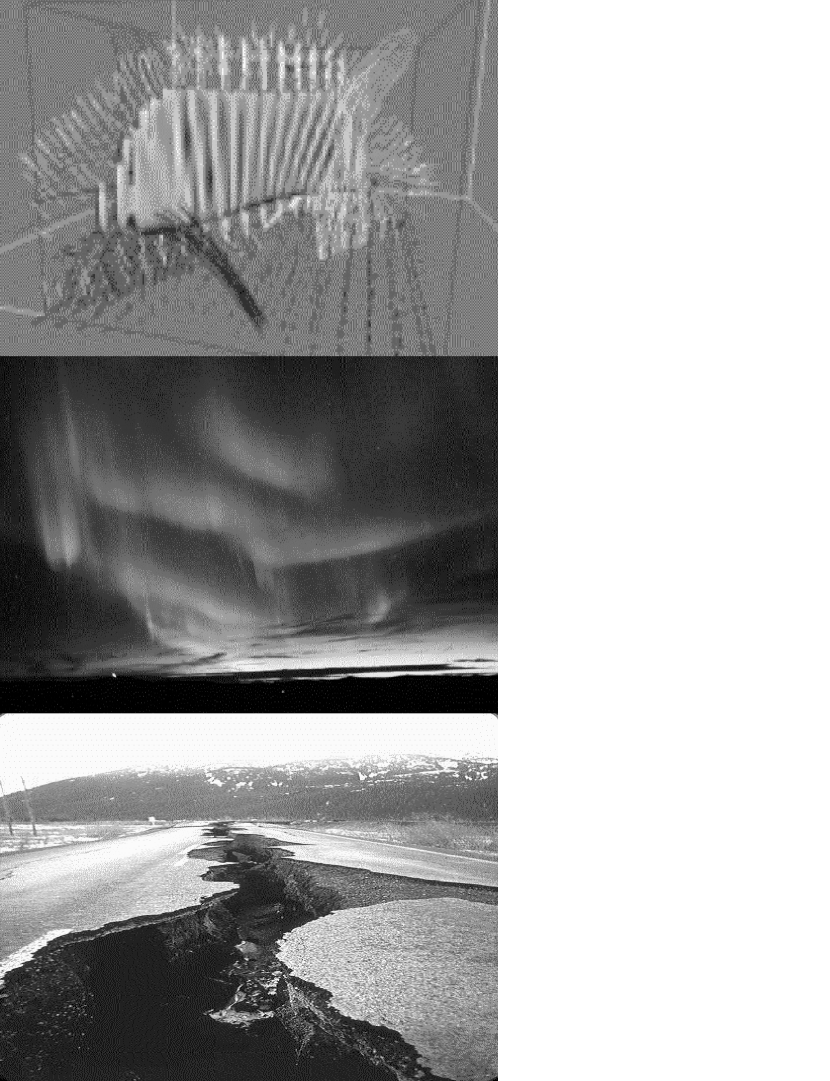
Solar flares observed in hard X-rays are believed to provide the most direct measure of dissipated energy. An example of a frequency distribution of nonthermal energy in electrons at energies of keV is shown in Fig. 2, which shows a powerlaw with a slope of extending over an energy range of four orders of magnitude, i.e., erg (Crosby, Aschwanden, and Dennis 1993). This powerlaw slope implies a fractal dimension of , which is perfectly consistent with a fractal 2-D energy dissipation domain, such as current sheets or separatrix surfaces in magnetic reconnection regions (Fig. 3, top). An early cellular automaton model was able to reproduce this value consistently for different system sizes (Lu et al. 1993). Other measurements of hard X-ray energies yield similar values in the range of (Lee et al. 1993; Bromund et al. 1995; Perez-Enriquez and Miroshnichenko 1999; Georgoulis et al. 2001; Christe et al. 2008), which are approximately consistent with a fractal dimension of .
Solar flares observed in soft X-rays provide a measure of the thermal energy, which are also found to be in the range of (Drake et al. 1971; Shimizu 1995), except for one measurement with a somewhat higher value of (Veronig et al. 2002a,b), which may be affected by background-subtraction issues. The general coincidence between energy distributions in soft and hard X-rays can be taken as evidence for the Neupert effect, which implies that the thermal flare plasma is evaporated from the chromosphere by heating through precipitating nonthermal particles. Thus, although the spatial geometry of soft X-ray radiating postflare loops is 1-D, their energy distribution reflects the 2-D geometry of current sheets where the primary energy dissipation took place.
For solar nanoflares observed in EUV we see two trends: (1) Powerlaw slopes of energy distributions inferred from single EUV temperature filters have values in the range of (Krucker and Benz 1998; Parnell and Jupp 2000; Aschwanden et al. 2000; Benz and Krucker 2002), which suffer from the bias of underestimating the thermal energy due to the lack of high-temperature filters; (2) Powerlaw slopes inferred from combined EUV and soft X-ray temperature filters yield a value of (Aschwanden and Parnell 2002), which is again consistent with a fractal dimension of as derived from flare energies observed in soft and hard X-rays.
Solar energetic particle (SEP) events were reported to have flatter powerlaw distributions, i.e., (Gabriel and Feynman 1996), which are preferentially associated with the largest flares, and thus their statistics is subject to a selection effect that is not representative for all flares.
Stellar flares were found to have a large range of powerlaw slopes, in the range of (Audard et al. 2000; Robinson et al. 1999), but each star provides only very few events per observing run (typically ), and thus the large spread can be explained by small-number statistics.
Soft-gamma repeaters were reported to have burst fluence distributions with powerlaw slopes of (Gogus et al. 1999, 2000; Chang et al. 1996) and implies fractal geometries of , which may reflect area-like fractures in neutron star crusts strained by evolving magnetic stresses (Thompson and Duncan 1995).
In magnetospheric physics, the energy of geomagnetic substorms was estimated from the area sizes of auroras (Fig. 3, middle) and the dissipated power, which were found to have frequency distributions with powerlaw slopes of (Lui et al. 2000) and imply a fractal dimension of . This suggests an Euclidean or volume-filling spreading of energy dissipation, which may reflect the 3-D geometry of the plasmoid that forms during the expansion phase in the geotail (Baumjohann and Treuman 1996).
In geophysics, earthquakes were found to have powerlaw distributions of (Turcotte 1999), which implies a fractal dimension of , possibly reflecting a mixture of 1-D earthquake fault ruptures (Fig. 3, bottom) and 2-D ruptures or tectonic plate spreading. Landslides were found in a range of , which also implies a mixed dimensionality of , ranging from 1-D avalanches guided along local valleys to 2-D avalanches that spread over flat hill sides. Forest fires were reported to have powerlaw slopes of (Turcotte 1999), which is perfectly consistent with 2-D area-spreading in extended forest regions. Even city sizes were found to follow a powerlaw slope of (Zanette 2007), which corresponds to the urban sprawl over 2-D areas.
Besides energy distributions, also the distributions of spatial scales of SOC events can shed some light into the fractal geometry of the energy dissipation regions. According to Eq. 3 we expect a fragmentation scaling of . Such a spatial fragmentation scaling law is indeed confirmed for the sizes or Saturn rings, i.e., (Zebker et al. 1985; French and Nicholson 2000); for the sizes of asteroids, i.e., (Ivezic et al. 2001); and for sizes of lunar craters, i.e., a cumulative distribution (Cross 1966), which corresponds to the differential distribution .
4 CONCLUSIONS
In conclusion, our universal model for fractal energy dissipation domains in systems with self-organized criticality predicts (i) the powerlaw shape of occurrence frequency distributions of energies, as well as (ii) a relationship of between the the powerlaw slope and the fractal dimension of the energy dissipation domain. Most observed occurrence frequency distributions of SOC events exhibit a powerlaw-like function with a slope of , which is predicted for instabilities that have 2-D area-like propagation characteristics, such as tectonic plate ruptures in earthquakes or current sheets in magnetic reconnection regions. This new scaling law could be corroborated by investigating the geometric morphology of energy dissipation events and their statistical frequency distributions in observations with spatial imaging capabilities, while it provides geometric predictions for non-imaging astrophysical observations.
REFERENCES
Aschwanden, M.J., Dennis, B.R., and Benz, A.O. 1998, ApJ 497, 972.
Aschwanden, M.J., Tarbell, T., Nightingale, R., Schrijver, C.J., Title, A., Kankelborg, C.C., Martens, P.C.H., and Warren, H.P. 2000, ApJ 535, 1047.
Aschwanden, M.J. and Parnell, C.E. 2002, ApJ 572, 1048.
Aschwanden, M.J., 2010, Self-Organized Criticality in Astrophysics. Statistics of Nonlinear Processes in the Universe, Springer-PRAXIS: New York (in press).
Audard, M., Güdel, M., Drake, J.J., and Kashyap, V.L. 2000, ApJ 541, 396.
Bak, P., Tang, C., and Wiesenfeld, K. 1987, Phys. Rev. Lett. 59/27, 381.
Bak, P., Tang, C., and Wiesenfeld, K. 1988, Phys. Rev. A 38/1, 364.
Baumjohann, W. and Treuman, R.A. 1996, Basic Space Plasma Physics, Imperial College Press: London.
Benz, A.O. and Krucker, S. 2002, ApJ 568, 413.
Bromund, K.R., McTiernan, J.M., and Kane, S.R. 1995, ApJ 455, 733.
Chang, H.K., Chen, K., Fenimore, E.E., and Ho, C. 1996, AIP Conf. Proc. 384, 921.
Charbonneau, P., McIntosh, S.W., Liu, H.L., and Bogdan, T.J. 2001, Solar Phys. 203, 321.
Christe, S., Hannah, I.G., Krucker, S., McTiernan, J., and Lin, R.P. 2008, ApJ 677, 1385.
Crosby, N.B., Aschwanden, M.J., and Dennis, B.R. 1993, Solar Phys. 143, 275.
Crosby, N.B., Meredith, N.P., Coates, A.J., and Iles, R.H.A. 2005, Nonlinear Processes in Geophysics 12, 993.
Cross, C.A. 1966, MNRAS 134, 245.
Drake, J.F. 1971, Solar Phys. 16, 152.
Fermi, E. 1949, Phys. Rev. Lett. 75, 1169.
French, R.G. and Nicholson, P.D. 2000, Icarus 145, 502.
Gabriel, S.B. and Feynman, J. 1996, Solar Phys. 165, 337.
Galsgaard, K., Priest, E.R., and Nordlund, A. 2000, Solar Phys. 193, 1.
Georgoulis, M.K., Vilmer,N., and Crosby,N.B. 2001, A&A 367, 326.
Gogus, E., Woods, P.M., Kouveliotou, C., van Paradijs, J., Briggs, M.S., Duncan, R.C., and Thompson, C. 1999, ApJ 526, L93.
Gogus, E., Woods, P.M., Kouveliotou, C., and van Paradijs, J. 2000, ApJ 532, L121.
Gutenberg, B. and Richter, C.F. 1954, Seismicity of the Earth and Associated Phenomena, Princeton University Press, Princeton, NJ, p.310 (2nd ed.).
Ivezic, Z., Tabachnik, S., Rafikov, R., Lupton, R.H., Quinn, T., Hammergren, M., Eyer, L., Chu, J., Armstrong, J.C., Fan, X., Finlator, K., Geballe, T.R., Gunn, J.E., Hennessy, G.S., Knapp, G.R., et al. (SDSS Collaboration) 2001, AJ 122, 2749.
Krucker, S. and Benz, A.O. 1998, ApJ 501, L213.
Lee, T.T., Petrosian, V., and McTiernan, J.M. 1993, ApJ 412, 401.
Litvinenko, Y.E. 1998, Solar Phys. 180, 393.
Lu, E.T., Hamilton, R.J., McTiernan, J.M., and Bromund, K.R. 1993, ApJ 412, 841.
Lui, A.T.Y., Chapman, S.C., Liou,K., Newell, P.T., Meng, C.I., Brittnacher, M., and Parks, G.K. 2000, GRL 27/7, 911.
Parnell,C.E. and Jupp,P.E. 2000, ApJ 529, 554.
Perez-Enriquez, R. and Miroshnichenko, L.I. 1999, Solar Phys. 188, 169.
Robinson, R.D., Carpenter, K.G., and Percival, J.W. 1999, ApJ 516, 916.
Rosner, R., and Vaiana, G.S. 1978, ApJ 222, 1104.
Shimizu, T. 1995, Publ. Astron. Soc. Japan 47, 251.
Thompson, C. and Duncan, R.C. 1995, MNRAS, 275, 255.
Turcotte, D.L. 1999, Rep. Prog. Phys. 62, 1377.
Veronig, A., Temmer, M.,Hanslmeier, A., Otruba, W., and Messerotti, M. 2002a, A&A 382, 1070.
Veronig, A., Temmer, M., and Hanslmeier, A. 2002b, Hvar Observatory Bulletin 26/1, 7.
Willis, J.C. and Yule, G.U. 1922, Nature 109, 177.
Zanette, D.H. 2007, in ”The Dynamics of Complex Urban Systems. An Interdisciplinary Approach”, (eds. S. Albeverio, D. Andrey, P. Giordano, and A. Vancheri, eds. (Springer, Berlin, 2007).
Zebker, H.A., Maroufm, E.A., and Tyler, G.L. 1985, Ikarus 64, 531.
| SOC Phenomenon | Powerlaw slope | Fractal dimension | Reference |
|---|---|---|---|
| Solar flare, hard X-rays | 1.530.03 | 1.9-2.0 | 1) |
| 1.51 | 2.0 | 2) | |
| 1.62 | 1.9 | 3) | |
| 1.74 | 1.7 | 4) | |
| 1.39 | 2.1 | 5) | |
| 1.39 | 2.1 | 6) | |
| 1.7 | 1.8 | 7) | |
| Solar flares, soft X-rays | 1.44 | 2.1 | 8) |
| 1.5-1.6 | 1.9-2.0 | 9) | |
| 1.88 | 1.6 | 10) | |
| Solar flares, EUV | 2.3-2.6 | 1.2-1.3 | 11) |
| 2.0-2.6 | 1.2-1.5 | 12) | |
| 1.790.08 | 1.6-1.8 | 13) | |
| 2.0-2.6 | 1.2-1.5 | 14) | |
| 1.540.03 | 1.9-2.0 | 15) | |
| Solar energetic particles | 1.2-1.4 | 2.1-2.5 | 16) |
| Stellar flares | 1.3-2.4 | 1.2-2.3 | 17) |
| 2.0 | 1.5 | 18) | |
| Soft gamma repeaters | 1.66 | 1.8 | 19) |
| 1.4-1.7 | 1.8-2.1 | 20) | |
| Auroral blobs | 1.0-1.2 | 2.5-3.0 | 21) |
| Outer radiation belt | 1.5-2.1 | 1.4-2.0 | 22) |
| City sizes | 1.4 | 2.1 | 23) |
| Forest fires | 1.3-1.5 | 2.0-2.3 | 24) |
| Earthquakes | 2.0 | 1.5 | 24) |
| Landslides | 1.7-3.3 | 0.9-1.8 | 24) |